
可伸缩性和性能
扩展 OpenShift Container Platform 集群并调整产品环境的性能
摘要
第 1 章 推荐的性能和可扩展性实践
1.1. 推荐的 control plane 实践
本主题为 OpenShift Container Platform 中的 control plane 提供推荐的性能和可扩展性实践。
1.1.1. 扩展集群的建议实践
本节中的指导信息仅与使用云供应商集成的安装相关。
应用以下最佳实践来扩展 OpenShift Container Platform 集群中的 worker 机器数量。您可以通过增加或减少 worker MachineSet 中定义的副本数量来扩展 worker 机器集。
将集群扩展到具有更多节点时:
- 将节点分散到所有可用区以获得更高的可用性。
- 同时扩展的机器数量不要超过 25 到 50 个。
- 考虑在每个可用区创建一个具有类似大小的替代实例类型的新计算机器集,以帮助缓解周期性供应商容量限制。例如,在 AWS 上,使用 m5.large 和 m5d.large。
云供应商可能会为 API 服务实施配额。因此,需要对集群逐渐进行扩展。
如果同时将计算机器集中的副本设置为更高数量,则控制器可能无法创建机器。部署 OpenShift Container Platform 的云平台可以处理的请求数量将会影响该进程。当尝试创建、检查和更新有状态的机器时,控制器会开始进行更多的查询。部署 OpenShift Container Platform 的云平台具有 API 请求限制,如果出现过量查询,则可能会因为云平台的限制而导致机器创建失败。
当扩展到具有大量节点时,启用机器健康检查。如果出现故障,健康检查会监控状况并自动修复不健康的机器。
当对大型且高密度的集群减少节点数时,可能需要大量时间,因为这个过程涉及排空或驱除在同时终止的节点上运行的对象。另外,如果要驱除的对象太多,对客户端的请求处理会出现瓶颈。默认客户端查询每秒(QPS)和突发率当前分别设置为 50 和 100。这些值无法在 OpenShift Container Platform 中修改。
1.1.2. Control plane 节点大小
控制平面节点资源要求取决于集群中的节点和对象的数量和类型。以下控制平面节点大小是基于控制平面密度测试的结果,或 Clusterdensity。此测试会在给定很多命名空间中创建以下对象:
- 1 个镜像流
- 1 个构建
-
5 个部署,其中 2 个 pod 副本处于
睡眠状态,每个状态都挂载 4 个 secret、4 个配置映射和 1 Downward API 卷 - 5 个服务,每个服务都指向前一个部署的 TCP/8080 和 TCP/8443 端口
- 1 个路由指向上一个服务的第一个路由
- 包含 2048 个随机字符串字符的 10 个 secret
- 10 个配置映射包含 2048 个随机字符串字符
| worker 节点数量 | 集群密度(命名空间) | CPU 内核 | 内存 (GB) |
|---|---|---|---|
| 24 | 500 | 4 | 16 |
| 120 | 1000 | 8 | 32 |
| 252 | 4000 | 16,但如果使用 OVN-Kubernetes 网络插件,则为 24 | 64,但在使用 OVN-Kubernetes 网络插件时为 128 |
| 501,但使用 OVN-Kubernetes 网络插件时未测试 | 4000 | 16 | 96 |
上表中的数据基于在 AWS 上运行的 OpenShift Container Platform,使用 r5.4xlarge 实例作为 control-plane 节点,m5.2xlarge 实例作为 worker 节点。
在具有三个 control plane 节点的大型高密度集群中,当其中一个节点停止、重启或失败时,CPU 和内存用量将会激增。故障可能是因为电源、网络、底层基础架构或意外情况造成意外问题,因为集群在关闭后重启,以节约成本。其余两个 control plane 节点必须处理负载才能高度可用,从而增加资源使用量。另外,在升级过程中还会有这个预期,因为 control plane 节点被封锁、排空并按顺序重新引导,以应用操作系统更新以及 control plane Operator 更新。为了避免级联失败,请将 control plane 节点上的总体 CPU 和内存资源使用量保留为最多 60% 的所有可用容量,以处理资源使用量激增。相应地增加 control plane 节点上的 CPU 和内存,以避免因为缺少资源而造成潜在的停机。
节点大小取决于集群中的节点和对象数量。它还取决于集群上是否正在主动创建这些对象。在创建对象时,control plane 在资源使用量方面与对象处于运行(running)阶段的时间相比更活跃。
Operator Lifecycle Manager(OLM)在 control plane 节点上运行,其内存占用量取决于 OLM 在集群中管理的命名空间和用户安装的 operator 的数量。Control plane 节点需要相应地调整大小,以避免 OOM 终止。以下数据基于集群最大测试的结果。
| 命名空间数量 | 处于空闲状态的 OLM 内存(GB) | 安装了 5 个用户 operator 的 OLM 内存(GB) |
|---|---|---|
| 500 | 0.823 | 1.7 |
| 1000 | 1.2 | 2.5 |
| 1500 | 1.7 | 3.2 |
| 2000 | 2 | 4.4 |
| 3000 | 2.7 | 5.6 |
| 4000 | 3.8 | 7.6 |
| 5000 | 4.2 | 9.02 |
| 6000 | 5.8 | 11.3 |
| 7000 | 6.6 | 12.9 |
| 8000 | 6.9 | 14.8 |
| 9000 | 8 | 17.7 |
| 10,000 | 9.9 | 21.6 |
您只能为以下配置修改正在运行的 OpenShift Container Platform 4.15 集群中的 control plane 节点大小:
- 使用用户置备的安装方法安装的集群。
- 使用安装程序置备的基础架构安装方法安装的 AWS 集群。
- 使用 control plane 机器集管理 control plane 机器的集群。
对于所有其他配置,您必须估计节点总数并在安装过程中使用推荐的 control plane 节点大小。
建议基于在带有 OpenShiftSDN 作为网络插件的 OpenShift Container Platform 集群上捕获的数据点。
在 OpenShift Container Platform 4.15 中,与 OpenShift Container Platform 3.11 及之前的版本相比,系统现在默认保留半个 CPU 内核(500 millicore)。确定大小时应该考虑这一点。
1.1.2.1. 为 control plane 机器选择更大的 Amazon Web Services 实例类型
如果 Amazon Web Services (AWS) 集群中的 control plane 机器需要更多资源,您可以为 control plane 机器选择更大的 AWS 实例类型。
使用 control plane 机器集的集群的步骤与不使用 control plane 机器集的集群的步骤不同。
如果不确定集群中 ControlPlaneMachineSet CR 的状态,您可以验证 CR 状态。
1.1.2.1.1. 使用 control plane 机器集更改 Amazon Web Services 实例类型
您可以通过更新 control plane 机器集自定义资源 (CR) 中的规格来更改 control plane 机器使用的 Amazon Web Services (AWS) 实例类型。
先决条件
- 您的 AWS 集群使用 control plane 机器集。
流程
运行以下命令来编辑 control plane 机器集 CR:
$ oc --namespace openshift-machine-api edit controlplanemachineset.machine.openshift.io cluster
编辑
providerSpec字段中的以下行:providerSpec: value: ... instanceType: <compatible_aws_instance_type> 1- 1
- 使用与之前选择相同的基础指定较大的 AWS 实例类型。例如,您可以将
m6i.xlarge更改为m6i.2xlarge或m6i.4xlarge。
保存您的更改。
-
对于使用默认
RollingUpdate更新策略的集群,Operator 会自动将更改传播到 control plane 配置。 -
对于配置为使用
OnDelete更新策略的集群,您必须手动替换 control plane 机器。
-
对于使用默认
1.1.2.1.2. 使用 AWS 控制台更改 Amazon Web Services 实例类型
您可以通过更新 AWS 控制台中的实例类型来更改 control plane 机器使用的 Amazon Web Services (AWS) 实例类型。
先决条件
- 您可以使用修改集群的 EC2 实例所需的权限访问 AWS 控制台。
-
您可以使用具有
cluster-admin角色的用户访问 OpenShift Container Platform 集群。
流程
- 打开 AWS 控制台并为 control plane 机器获取实例。
选择一个 control plane 机器实例。
- 对于所选 control plane 机器,通过创建 etcd 快照来备份 etcd 数据。如需更多信息,请参阅 "恢复 etcd"。
- 在 AWS 控制台中,停止 control plane 机器实例。
- 选择已停止的实例,然后点 Actions → Instance Settings → Change instance type。
-
将实例更改为较大的类型,确保类型与之前选择相同,并应用更改。例如,您可以将
m6i.xlarge更改为m6i.2xlarge或m6i.4xlarge。 - 启动实例。
-
如果您的 OpenShift Container Platform 集群具有实例对应的
Machine对象,请更新对象的实例类型以匹配 AWS 控制台中设置的实例类型。
- 为每个 control plane 机器重复此步骤。
其他资源
1.2. 推荐的基础架构实践
本主题为 OpenShift Container Platform 中的基础架构提供推荐的性能和可扩展性实践。
1.2.1. 基础架构节点大小
基础架构节点是标记为运行 OpenShift Container Platform 环境组成部分的节点。基础架构节点的资源要求取决于集群中的集群年龄、节点和对象,因为这些因素可能会导致 Prometheus 的指标或时间序列增加。以下基础架构节点大小是基于在 Control plane 节点大小 部分中详述的集群密度测试中观察到的结果,其中监控堆栈和默认 ingress-controller 被移到这些节点。
| worker 节点数量 | 集群密度或命名空间数量 | CPU 内核 | 内存 (GB) |
|---|---|---|---|
| 27 | 500 | 4 | 24 |
| 120 | 1000 | 8 | 48 |
| 252 | 4000 | 16 | 128 |
| 501 | 4000 | 32 | 128 |
通常,建议每个集群有三个基础架构节点。
这些大小建议应用作指导行。Prometheus 是一个高内存密集型应用程序,资源使用量取决于各种因素,包括节点、对象、Prometheus 指标提取间隔、指标或时间序列以及集群的年龄。此外,路由器资源使用量也可以受到路由数量和入站请求的数量/类型的影响。
这些建议只适用于在集群创建过程中安装监控、Ingress 和 Registry 基础架构组件的基础架构节点。
在 OpenShift Container Platform 4.15 中,与 OpenShift Container Platform 3.11 及之前的版本相比,系统现在默认保留半个 CPU 内核(500 millicore)。这会影响缩放建议。
1.2.2. 扩展 Cluster Monitoring Operator
OpenShift Container Platform 会提供 Cluster Monitoring Operator 在基于 Prometheus 的监控堆栈中收集并存储的数据。作为管理员,您可以通过进入 Observe → Dashboards 来查看 OpenShift Container Platform Web 控制台中的系统资源、容器和组件指标的仪表板。
1.2.3. Prometheus 数据库存储要求
红帽对不同的扩展大小进行了各种测试。
- 以下 Prometheus 存储要求并不具有规定性,应该将它们视为参考信息。取决于具体的工作负载和资源的使用,集群中可能会出现高的资源消耗,包括 Prometheus 收集的指标,如 pod 、容器、路由或其他资源的数量。
- 您可以配置基于大小的数据保留策略,以满足您的存储要求。
表 1.1. Prometheus 数据库的存储要求取决于集群中的节点/pod 数量
| 节点数 | pod 数量(每个 pod 2 个容器) | 每天增加的 Prometheus 存储 | 每 15 天增加的 Prometheus 存储 | 网络(每个 tsdb 块) |
|---|---|---|---|---|
| 50 | 1800 | 6.3 GB | 94 GB | 16 MB |
| 100 | 3600 | 13 GB | 195 GB | 26 MB |
| 150 | 5400 | 19 GB | 283 GB | 36 MB |
| 200 | 7200 | 25 GB | 375 GB | 46 MB |
大约 20%的预期大小被添加为开销,以保证存储要求不会超过计算的值。
上面的计算用于默认的 OpenShift Container Platform Cluster Monitoring Operator。
CPU 利用率会有轻微影响。这个比例为在每 50 个节点和 1800 个 pod 的 40 个内核中大约有 1 个。
针对 OpenShift Container Platform 的建议
- 至少使用两个基础架构 (infra) 节点。
- 至少使用三个带有非易失性存储器 (SSD 或 NVMe) 驱动器的 openshift-container-storage 节点。
1.2.4. 配置集群监控
您可以为集群监控堆栈中的 Prometheus 组件增加存储容量。
流程
为 Prometheus 增加存储容量:
创建 YAML 配置文件
cluster-monitoring-config.yaml。例如:apiVersion: v1 kind: ConfigMap data: config.yaml: | prometheusK8s: retention: {{PROMETHEUS_RETENTION_PERIOD}} 1 nodeSelector: node-role.kubernetes.io/infra: "" volumeClaimTemplate: spec: storageClassName: {{STORAGE_CLASS}} 2 resources: requests: storage: {{PROMETHEUS_STORAGE_SIZE}} 3 alertmanagerMain: nodeSelector: node-role.kubernetes.io/infra: "" volumeClaimTemplate: spec: storageClassName: {{STORAGE_CLASS}} 4 resources: requests: storage: {{ALERTMANAGER_STORAGE_SIZE}} 5 metadata: name: cluster-monitoring-config namespace: openshift-monitoring- 1
- Prometheus 保留的默认值为
PROMETHEUS_RETENTION_PERIOD=15d。时间单位使用以下后缀之一 : s 、m 、h 、d。 - 2 4
- 集群的存储类。
- 3
- 一个典型的值是
PROMETHEUS_STORAGE_SIZE=2000Gi。存储值可以是一个纯整数,也可以是带有以下后缀之一的整数: E 、P 、T 、G 、M 、K。您也可以使用以下效果相同的后缀:Ei 、Pi 、Ti 、Gi 、Mi 、Ki。 - 5
- 一个典型的值
是 alertmanager_STORAGE_SIZE=20Gi。存储值可以是一个纯整数,也可以是带有以下后缀之一的整数: E 、P 、T 、G 、M 、K。您也可以使用以下效果相同的后缀:Ei 、Pi 、Ti 、Gi 、Mi 、Ki。
- 为保留周期、存储类和存储大小添加值。
- 保存该文件。
运行以下命令应用这些更改:
$ oc create -f cluster-monitoring-config.yaml
1.2.5. 其他资源
1.3. 推荐的 etcd 实践
本主题为 OpenShift Container Platform 中的 etcd 提供了推荐的性能和可扩展性实践。
1.3.1. 推荐的 etcd 实践
因为 etcd 将数据写入磁盘并在磁盘上持久化,所以其性能取决于磁盘性能。虽然 etcd 并不是有非常高的 I/O 负载,但它需要使用一个具有低延迟的块设备才能获得最佳性能和稳定性。因为 etcd 的共识协议依赖于将元数据永久存储到一个日志 (WAL),所以 etcd 对磁盘的写延迟非常敏感。减慢来自其他进程的磁盘活动和磁盘活动可能会导致长时间的 fsync 延迟。
这些延迟可能会导致 etcd 丢失心跳,不会及时向磁盘提交新的建议,并最终遇到请求超时和临时丢失问题。高写入延迟也会导致 OpenShift API 较慢,这会影响集群性能。由于这些原因,请避免在具有 I/O 敏感或密集型的 control-plane 节点上并置其他工作负载,并共享相同的底层 I/O 基础架构。
就延迟而言,应该在一个可最少以 50 IOPS 按顺序写入 8000 字节的块设备上运行。也就是说,当有一个 10ms 的延迟时,使用 fdatasync 来同步 WAL 中的写入操作。对于高负载的集群,建议使用 8000 字节的连续 500 IOPS (2 毫秒)。要测量这些数字,您可以使用基准测试工具,如 fio。
要实现这样的性能,在由低延迟和高吞吐量的 SSD 或 NVMe 磁盘支持的机器上运行 etcd。考虑使用单层单元(SLC)固态驱动器(SSD)(它为每个内存单元提供 1 位),这是可靠的,非常适合于写密集型工作负载。
影响 etcd 上的负载的因素包括静态因素,如节点和 pod 的数量,以及动态因素,包括因为 pod 自动扩展、pod 重启、作业执行和其他与工作负载相关的事件,以及其他与负载相关的事件。要准确调整 etcd 设置的大小,您必须分析工作负载的特定要求。考虑影响 etcd 负载的节点、pod 和其他相关因素的数量。
以下硬盘驱动器实践提供最佳的 etcd 性能:
- 使用专用 etcd 驱动器。避免通过网络通信的驱动器,如 iSCSI。不要将日志文件或其他重重工作负载放在 etcd 驱动器中。
- 首选驱动低延迟来支持快速读写操作。
- 首选高带宽写入,以便更快地压缩和整理碎片。
- 首选高带宽读取,以便更快地从故障恢复。
- 使用固态硬盘作为最低选择。在生产环境中首选 NVMe 驱动器。
- 使用服务器级硬件提高可靠性。
避免 NAS 或 SAN 设置,以及旋转驱动器。Ceph Rados 块设备 (RBD) 和其他类型的网络附加存储可能会导致网络延迟无法预计。要大规模向 etcd 节点提供快速存储,请使用 PCI 透传将 NVM 设备直接传递给节点。
始终使用相关工具(如 fio)进行基准测试。当集群性能增加时,您可以使用这些工具不断监控集群性能。
避免使用网络文件系统 (NFS) 协议或其他基于网络的文件系统。
需要在部署的 OpenShift Container Platform 集群上监控的一些关键指标包括,日志持续时间之前的 etcd 磁盘写入的 p99 值,以及 etcd leader 更改的数量。使用 Prometheus 跟踪这些指标。
在正常操作过程中,etcd 成员数据库大小可能会因集群而异。这种差异不会影响集群升级,即使领导大小与其他成员不同。
要在创建 OpenShift Container Platform 集群之前或之后验证 etcd 的硬件,您可以使用 fio。
先决条件
- 您正在测试的机器上安装了 Podman 或 Docker 等容器运行时。
-
数据被写入
/var/lib/etcd路径。
流程
运行 fio 并分析结果:
如果使用 Podman,请运行以下命令:
$ sudo podman run --volume /var/lib/etcd:/var/lib/etcd:Z quay.io/cloud-bulldozer/etcd-perf
如果使用 Docker,请运行以下命令:
$ sudo docker run --volume /var/lib/etcd:/var/lib/etcd:Z quay.io/cloud-bulldozer/etcd-perf
输出会报告磁盘是否足够快以运行 etcd,它会检查测试运行中获得的 fsync 指标的 p99 值是否小于 10ms。一些最重要的 etcd 指标可能受到 I/O 性能的影响,如下所示:
-
etcd_disk_wal_fsync_duration_seconds_bucket指标报告了 etcd 的 WAL fsync 持续时间。 -
etcd_disk_backend_commit_duration_seconds_bucket指标报告 etcd 后端提交延迟持续时间 -
etcd_server_leader_changes_seen_total指标报告领导更改
etcd 在所有成员间复制请求,因此其性能会严重依赖于网络输入/输出(I/O)的延迟。大量网络延迟会导致 etcd heartbeat 的时间比选举超时时间更长,这会导致一个可能会对集群造成破坏的领导选举。在部署的 OpenShift Container Platform 集群上监控的一个关键指标是每个 etcd 集群成员上的 etcd 网络对延迟的 p99 百分比。使用 Prometheus 跟踪指标数据。
histogram_quantile(0.99, rate(etcd_network_peer_round_trip_time_seconds_bucket[2m]) 指标报告 etcd 在成员间复制客户端请求的时间。确保它小于 50 ms。
1.3.2. 将 etcd 移动到不同的磁盘
您可以将 etcd 从共享磁盘移到独立磁盘,以防止或解决性能问题。
Machine Config Operator (MCO) 负责为 OpenShift Container Platform 4.15 容器存储挂载辅助磁盘。
这个编码脚本只支持以下设备类型的设备名称:
- SCSI 或 SATA
-
/dev/sd* - 虚拟设备
-
/dev/vd* - NVMe
-
/dev/nvme*[0-9]*n*
限制
-
当新磁盘附加到集群时,etcd 数据库是 root 挂载的一部分。当主节点被重新创建时,它不是二级磁盘的一部分或预期的磁盘。因此,主节点不会创建单独的
/var/lib/etcd挂载。
先决条件
-
已安装 OpenShift CLI(
oc)。 -
您可以使用
cluster-admin权限访问集群。 - 在上传机器配置前添加额外的磁盘。
-
MachineConfigPool必须与metadata.labels[machineconfiguration.openshift.io/role]匹配。这适用于控制器、worker 或自定义池。
这个过程不会将 root 文件系统的部分内容(如 /var/ )移到已安装节点上的另一个磁盘或分区。
流程
将新磁盘附加到集群,并在 debug shell 中运行
lsblk命令来验证节点中是否检测到磁盘:$ oc debug node/<node_name>
# lsblk
记录下
lsblk命令报告的新磁盘的设备名称。根据您的环境解码和替换脚本中的设备名称。
#!/bin/bash set -uo pipefail for device in <device_type_glob>; do 1 /usr/sbin/blkid $device &> /dev/null if [ $? == 2 ]; then echo "secondary device found $device" echo "creating filesystem for etcd mount" mkfs.xfs -L var-lib-etcd -f $device &> /dev/null udevadm settle touch /etc/var-lib-etcd-mount exit fi done echo "Couldn't find secondary block device!" >&2 exit 77- 1
- 将
<device_type_glob>替换为您的块设备类型的 shell glob。对于 SCSI 或 SATA 驱动器,使用/dev/sd*; 对于虚拟驱动器,使用/dev/vd*; 对于 NVMe 驱动器,使用/dev/nvme*[0-9]*n*。
创建名为
etcd-mc.yml的MachineConfigYAML 文件,其内容如下:apiVersion: machineconfiguration.openshift.io/v1 kind: MachineConfig metadata: labels: machineconfiguration.openshift.io/role: master name: 98-var-lib-etcd spec: config: ignition: version: 3.1.0 storage: files: - path: /etc/find-secondary-device mode: 0755 contents: source: data:text/plain;charset=utf-8;base64,<encoded_etc_find_secondary_device_script> 1 systemd: units: - name: find-secondary-device.service enabled: true contents: | [Unit] Description=Find secondary device DefaultDependencies=false After=systemd-udev-settle.service Before=local-fs-pre.target ConditionPathExists=!/etc/var-lib-etcd-mount [Service] RemainAfterExit=yes ExecStart=/etc/find-secondary-device RestartForceExitStatus=77 [Install] WantedBy=multi-user.target - name: var-lib-etcd.mount enabled: true contents: | [Unit] Before=local-fs.target [Mount] What=/dev/disk/by-label/var-lib-etcd Where=/var/lib/etcd Type=xfs TimeoutSec=120s [Install] RequiredBy=local-fs.target - name: sync-var-lib-etcd-to-etcd.service enabled: true contents: | [Unit] Description=Sync etcd data if new mount is empty DefaultDependencies=no After=var-lib-etcd.mount var.mount Before=crio.service [Service] Type=oneshot RemainAfterExit=yes ExecCondition=/usr/bin/test ! -d /var/lib/etcd/member ExecStart=/usr/sbin/setsebool -P rsync_full_access 1 ExecStart=/bin/rsync -ar /sysroot/ostree/deploy/rhcos/var/lib/etcd/ /var/lib/etcd/ ExecStart=/usr/sbin/semanage fcontext -a -t container_var_lib_t '/var/lib/etcd(/.*)?' ExecStart=/usr/sbin/setsebool -P rsync_full_access 0 TimeoutSec=0 [Install] WantedBy=multi-user.target graphical.target - name: restorecon-var-lib-etcd.service enabled: true contents: | [Unit] Description=Restore recursive SELinux security contexts DefaultDependencies=no After=var-lib-etcd.mount Before=crio.service [Service] Type=oneshot RemainAfterExit=yes ExecStart=/sbin/restorecon -R /var/lib/etcd/ TimeoutSec=0 [Install] WantedBy=multi-user.target graphical.target- 1
- 使用之前创建的编码字符串,并将其替换为您记下的编码脚本。
验证步骤
在节点的 debug shell 中运行
grep /var/lib/etcd /proc/mounts命令,以确保挂载磁盘:$ oc debug node/<node_name>
# grep -w "/var/lib/etcd" /proc/mounts
输出示例
/dev/sdb /var/lib/etcd xfs rw,seclabel,relatime,attr2,inode64,logbufs=8,logbsize=32k,noquota 0 0
1.3.3. 分离 etcd 数据
对于大型、高密度的集群,如果键空间增长过大并超过空间配额,etcd 的性能将会受到影响。定期维护并处理碎片化的 etcd,以释放数据存储中的空间。监控 Prometheus 以了解 etcd 指标数据,并在需要时对其进行碎片处理;否则,etcd 可能会引发一个集群范围的警报,使集群进入维护模式,仅能接受对键的读和删除操作。
监控这些关键指标:
-
etcd_server_quota_backend_bytes,这是当前配额限制 -
etcd_mvcc_db_total_size_in_use_in_bytes,表示历史压缩后实际数据库使用量 -
etcd_mvcc_db_total_size_in_bytes显示数据库大小,包括等待碎片整理的可用空间
在导致磁盘碎片的事件后(如 etcd 历史记录紧凑)对 etcd 数据进行清理以回收磁盘空间。
历史压缩将自动每五分钟执行一次,并在后端数据库中造成混乱。此碎片空间可供 etcd 使用,但主机文件系统不可用。您必须对碎片 etcd 进行碎片清除,才能使这个空间可供主机文件系统使用。
碎片清理会自动发生,但您也可以手动触发它。
自动清理碎片非常适合大多数情况,因为 etcd operator 使用集群信息来确定用户最有效的操作。
1.3.3.1. 自动清理
etcd Operator 自动清理碎片磁盘。不需要人工干预。
查看以下日志之一来验证碎片整理过程是否成功:
- etcd 日志
- cluster-etcd-operator pod
- Operator 状态错误日志
自动清除可能会导致各种 OpenShift 核心组件中的领导选举失败,如 Kubernetes 控制器管理器,这会触发重启失败的组件。重启会有危害,并会触发对下一个正在运行的实例的故障切换,或者组件在重启后再次恢复工作。
成功进行碎片处理的日志输出示例
etcd member has been defragmented: <member_name>, memberID: <member_id>
进行碎片处理失败的日志输出示例
failed defrag on member: <member_name>, memberID: <member_id>: <error_message>
1.3.3.2. 手动清理
Prometheus 警报指示您需要手动进行碎片处理。该警报在两个情况下显示:
- 当 etcd 使用超过 50% 的可用空间超过了 10 分钟
- 当 etcd 活跃使用小于其数据库总大小的 50% 超过了 10 分钟
您还可以通过检查 etcd 数据库大小(MB)来决定是否需要进行碎片整理。通过 PromQL 表达 (etcd_mvcc_db_total_size_in_bytes - etcd_mvcc_db_total_size_in_use_in_bytes)/1024/1024 来释放空间。
分离 etcd 是一个阻止性操作。在进行碎片处理完成前,etcd 成员将没有响应。因此,在每个下一个 pod 要进行碎片清理前,至少等待一分钟,以便集群可以恢复正常工作。
按照以下步骤对每个 etcd 成员上的 etcd 数据进行碎片处理。
先决条件
-
您可以使用具有
cluster-admin角色的用户访问集群。
流程
确定哪个 etcd 成员是领导成员,因为领导会进行最后的碎片处理。
获取 etcd pod 列表:
$ oc -n openshift-etcd get pods -l k8s-app=etcd -o wide
输出示例
etcd-ip-10-0-159-225.example.redhat.com                3/3     Running     0          175m   10.0.159.225   ip-10-0-159-225.example.redhat.com   <none>           <none>
etcd-ip-10-0-191-37.example.redhat.com                 3/3     Running     0          173m   10.0.191.37    ip-10-0-191-37.example.redhat.com    <none>           <none>
etcd-ip-10-0-199-170.example.redhat.com                3/3     Running     0          176m   10.0.199.170   ip-10-0-199-170.example.redhat.com   <none>           <none>
选择 pod 并运行以下命令来确定哪个 etcd 成员是领导:
$ oc rsh -n openshift-etcd etcd-ip-10-0-159-225.example.redhat.com etcdctl endpoint status --cluster -w table
输出示例
Defaulting container name to etcdctl.
Use 'oc describe pod/etcd-ip-10-0-159-225.example.redhat.com -n openshift-etcd' to see all of the containers in this pod.
+---------------------------+------------------+---------+---------+-----------+------------+-----------+------------+--------------------+--------+
|         ENDPOINT          |        ID        | VERSION | DB SIZE | IS LEADER | IS LEARNER | RAFT TERM | RAFT INDEX | RAFT APPLIED INDEX | ERRORS |
+---------------------------+------------------+---------+---------+-----------+------------+-----------+------------+--------------------+--------+
|  https://10.0.191.37:2379 | 251cd44483d811c3 |   3.5.9 |  104 MB |     false |      false |         7 |      91624 |              91624 |        |
| https://10.0.159.225:2379 | 264c7c58ecbdabee |   3.5.9 |  104 MB |     false |      false |         7 |      91624 |              91624 |        |
| https://10.0.199.170:2379 | 9ac311f93915cc79 |   3.5.9 |  104 MB |      true |      false |         7 |      91624 |              91624 |        |
+---------------------------+------------------+---------+---------+-----------+------------+-----------+------------+--------------------+--------+
基于此输出的
IS LEADER列,https://10.0.199.170:2379端点是领导。与上一步输出匹配此端点,领导的 pod 名称为etcd-ip-10-0-199-170.example.redhat.com。
清理 etcd 成员。
连接到正在运行的 etcd 容器,传递 不是 领导的 pod 的名称:
$ oc rsh -n openshift-etcd etcd-ip-10-0-159-225.example.redhat.com
取消设置
ETCDCTL_ENDPOINTS环境变量:sh-4.4# unset ETCDCTL_ENDPOINTS
清理 etcd 成员:
sh-4.4# etcdctl --command-timeout=30s --endpoints=https://localhost:2379 defrag
输出示例
Finished defragmenting etcd member[https://localhost:2379]
如果发生超时错误,增加
--command-timeout的值,直到命令成功为止。验证数据库大小是否已缩小:
sh-4.4# etcdctl endpoint status -w table --cluster
输出示例
+---------------------------+------------------+---------+---------+-----------+------------+-----------+------------+--------------------+--------+
|         ENDPOINT          |        ID        | VERSION | DB SIZE | IS LEADER | IS LEARNER | RAFT TERM | RAFT INDEX | RAFT APPLIED INDEX | ERRORS |
+---------------------------+------------------+---------+---------+-----------+------------+-----------+------------+--------------------+--------+
|  https://10.0.191.37:2379 | 251cd44483d811c3 |   3.5.9 |  104 MB |     false |      false |         7 |      91624 |              91624 |        |
| https://10.0.159.225:2379 | 264c7c58ecbdabee |   3.5.9 |   41 MB |     false |      false |         7 |      91624 |              91624 |        | 1
| https://10.0.199.170:2379 | 9ac311f93915cc79 |   3.5.9 |  104 MB |      true |      false |         7 |      91624 |              91624 |        |
+---------------------------+------------------+---------+---------+-----------+------------+-----------+------------+--------------------+--------+
本例显示这个 etcd 成员的数据库大小现在为 41 MB,而起始大小为 104 MB。
重复这些步骤以连接到其他 etcd 成员并进行碎片处理。最后才对领导进行碎片清除。
至少要在碎片处理操作之间等待一分钟,以便 etcd pod 可以恢复。在 etcd pod 恢复前,etcd 成员不会响应。
如果因为超过空间配额而触发任何
NOSPACE警告,请清除它们。检查是否有
NOSPACE警告:sh-4.4# etcdctl alarm list
输出示例
memberID:12345678912345678912 alarm:NOSPACE
清除警告:
sh-4.4# etcdctl alarm disarm
1.3.4. 为 etcd 设置调优参数
您可以将 control plane 硬件速度设置为 "Standard"、"Slower" 或默认值,即 ""。
默认设置允许系统决定使用哪个速度。这个值允许从此功能不存在的版本进行升级,因为系统可以从之前的版本中选择值。
通过选择其中一个其他值,您要覆盖默认值。如果您看到由于超时或丢失了心跳而导致的很多领导选举机制,且您的系统被设置为 "" 或 "Standard",请将硬件速度设置为 "Slower",使系统能够更好地接受增加延迟。
调整 etcd 延迟容错功能只是一个技术预览功能。技术预览功能不受红帽产品服务等级协议(SLA)支持,且功能可能并不完整。红帽不推荐在生产环境中使用它们。这些技术预览功能可以使用户提早试用新的功能,并有机会在开发阶段提供反馈意见。
有关红帽技术预览功能支持范围的更多信息,请参阅技术预览功能支持范围。
1.3.4.1. 更改硬件速度容错
要更改 etcd 的硬件速度容错功能,请完成以下步骤。
先决条件
- 您已编辑了集群实例,以启用技术预览功能。如需更多信息,请参阅"了解功能门"。
流程
输入以下命令来查看当前值:
$ oc describe etcd/cluster | grep "Control Plane Hardware Speed"
输出示例
Control Plane Hardware Speed: <VALUE>
注意如果输出为空,则未设置该字段,并且应被视为默认值("")。
输入以下命令来更改值。将
<value>替换为一个有效值:""、"Standard"或"Slower":oc patch etcd/cluster --type=merge -p '{"spec": {"controlPlaneHardwareSpeed": "<value>"}}'下表显示了每个配置集的心跳间隔和领导选举超时。这些值可能随时更改。
profile
ETCD_HEARTBEAT_INTERVAL
ETCD_LEADER_ELECTION_TIMEOUT
""根据平台的不同而有所不同
根据平台的不同而有所不同
Standard(标准)100
1000
速度较慢500
2500
查看输出:
输出示例
etcd.operator.openshift.io/cluster patched
如果您输入了有效值之外的任何值,则会显示错误输出。例如,如果您以值形式输入
"Faster",输出如下:输出示例
The Etcd "cluster" is invalid: spec.controlPlaneHardwareSpeed: Unsupported value: "Faster": supported values: "", "Standard", "Slower"
输入以下命令验证值是否已更改:
$ oc describe etcd/cluster | grep "Control Plane Hardware Speed"
输出示例
Control Plane Hardware Speed: ""
等待 etcd pod 推出:
oc get pods -n openshift-etcd -w
以下输出显示了 master-0 的预期条目。继续之前,等到所有 master 都显示为
4/4 Running。输出示例
installer-9-ci-ln-qkgs94t-72292-9clnd-master-0           0/1     Pending             0          0s
installer-9-ci-ln-qkgs94t-72292-9clnd-master-0           0/1     Pending             0          0s
installer-9-ci-ln-qkgs94t-72292-9clnd-master-0           0/1     ContainerCreating   0          0s
installer-9-ci-ln-qkgs94t-72292-9clnd-master-0           0/1     ContainerCreating   0          1s
installer-9-ci-ln-qkgs94t-72292-9clnd-master-0           1/1     Running             0          2s
installer-9-ci-ln-qkgs94t-72292-9clnd-master-0           0/1     Completed           0          34s
installer-9-ci-ln-qkgs94t-72292-9clnd-master-0           0/1     Completed           0          36s
installer-9-ci-ln-qkgs94t-72292-9clnd-master-0           0/1     Completed           0          36s
etcd-guard-ci-ln-qkgs94t-72292-9clnd-master-0            0/1     Running             0          26m
etcd-ci-ln-qkgs94t-72292-9clnd-master-0                  4/4     Terminating         0          11m
etcd-ci-ln-qkgs94t-72292-9clnd-master-0                  4/4     Terminating         0          11m
etcd-ci-ln-qkgs94t-72292-9clnd-master-0                  0/4     Pending             0          0s
etcd-ci-ln-qkgs94t-72292-9clnd-master-0                  0/4     Init:1/3            0          1s
etcd-ci-ln-qkgs94t-72292-9clnd-master-0                  0/4     Init:2/3            0          2s
etcd-ci-ln-qkgs94t-72292-9clnd-master-0                  0/4     PodInitializing     0          3s
etcd-ci-ln-qkgs94t-72292-9clnd-master-0                  3/4     Running             0          4s
etcd-guard-ci-ln-qkgs94t-72292-9clnd-master-0            1/1     Running             0          26m
etcd-ci-ln-qkgs94t-72292-9clnd-master-0                  3/4     Running             0          20s
etcd-ci-ln-qkgs94t-72292-9clnd-master-0                  4/4     Running             0          20s
输入以下命令查看值:
$ oc describe -n openshift-etcd pod/<ETCD_PODNAME> | grep -e HEARTBEAT_INTERVAL -e ELECTION_TIMEOUT
注意这些值可能没有从默认值更改。
其他资源
第 2 章 根据对象限制规划您的环境
在规划 OpenShift Container Platform 集群时,请考虑以下对象限制。
这些限制基于最大可能的集群。对于较小的集群,最大值限制会较低。很多因素会影响指定的阈值,包括 etcd 版本或者存储数据格式。
在大多数情况下,超过这些限制会降低整体性能。它不一定意味着集群会出现错误。
对于快速变化的集群(如集群中包括多个启动和停止的 pod)可能会有比记录中小的实际最大大小。
2.1. OpenShift Container Platform 为主发行版本测试了集群最大值
红帽不提供针对 OpenShift Container Platform 集群大小调整的直接指导。这是因为,判断集群是否在 OpenShift Container Platform 支持的边界内,需要仔细考虑限制集群扩展的所有多维因素。
OpenShift Container Platform 支持测试的集群最大值,而不是绝对集群最大值。并非所有 OpenShift Container Platform 版本、control plane 工作负载和网络插件的组合都会被测试,因此下表并不表示所有部署的扩展绝对预期。可能无法同时扩展到所有维度上的最大值。表包含特定工作负载和部署配置的测试的最大值,并充当扩展指南,如类似部署的预期内容。
| 最大类型 | 4.x 测试的最大值 |
|---|---|
| 节点数 | 2,000 [1] |
| pod 数量 [2] | 150,000 |
| 每个节点的 pod 数量 | 2,500 [3][4] |
| 每个内核的 pod 数量 | 没有默认值。 |
| 命名空间数量 [5] | 10,000 |
| 构建(build)数 | 10,000(默认 pod RAM 512 Mi)- Source-to-Image (S2I) 构建策略 |
| 每个命名空间的 pod 数量 [6] | 25,000 |
| 每个 Ingress Controller 的路由和后端数量 | 每个路由器 2,000 个 |
| secret 的数量 | 80,000 |
| 配置映射数量 | 90,000 |
| 服务数量 [7] | 10,000 |
| 每个命名空间的服务数 | 5,000 |
| 每个服务中的后端数 | 5,000 |
| 每个命名空间的部署数量 [6] | 2,000 |
| 构建配置数 | 12,000 |
| 自定义资源定义 (CRD) 的数量 | 1,024 [8] |
- 部署暂停 Pod 以在 2000 个节点规模下对 OpenShift Container Platform 的 control plane 组件进行压力测试。扩展至类似数量的功能会根据特定的部署和工作负载参数而有所不同。
- 这里的 pod 数量是 test pod 的数量。实际的 pod 数量取决于应用程序的内存、CPU 和存储要求。
-
在具有 31 个服务器的集群中测试:3 个 control plane、2 个基础架构节点和 26 个 worker 节点。如果您需要 2,500 个用户 pod,则需要
hostPrefix为20,它为每个节点分配一个足够大的网络,以便每个节点包含 2000 个 pod,并将maxPods设置为2500的自定义 kubelet 配置。如需更多信息,请参阅在 OCP 4.13 上每个节点运行 2500 个 pod。 -
使用
OVNKubernetes网络插件的集群测试的最大 pod 为 2,500。OpenShiftSDN网络插件的每个节点测试的最大 pod 是 500 个 pod。 - 当有大量活跃的项目时,如果键空间增长过大并超过空间配额,etcd 的性能将会受到影响。强烈建议您定期维护 etcd 存储(包括整理碎片)来释放 etcd 存储。
- 系统中有一些控制循环必须迭代给定命名空间中的所有对象,作为对一些状态更改的响应。在单一命名空间中有大量给定类型的对象可使这些循环的运行成本变高,并降低对给定状态变化的处理速度。限制假设系统有足够的 CPU 、内存和磁盘来满足应用程序的要求。
-
每个服务端口和每个服务后端在
iptables中都有对应条目。给定服务的后端数量会影响端点对象的大小,这会影响到整个系统发送的数据大小。 -
在具有 29 个服务器的集群中测试:3 个 control plane、2 个基础架构节点和 24 个 worker 节点。集群有 500 个命名空间。OpenShift Container Platform 的限制是 1,024 个总自定义资源定义(CRD),其中包括由 OpenShift Container Platform 安装的产品、与 OpenShift Container Platform 集成并创建了 CRD 的产品。如果创建超过 1,024 CRD,则
oc命令请求可能会节流。
2.1.1. 示例情境
例如,500 个 worker 节点(m5.2xl)经过测试,并被支持,使用 OpenShift Container Platform 4.15、OVN-Kubernetes 网络插件和以下工作负载对象:
- 除默认值外,200 个命名空间
- 每个节点 60 个 pod;30 个服务器和 30 个客户端 pod (总计 30k)
- 57 镜像流/ns (11.4k 总计)
- 15 services/ns 被服务器 pod 支持 (共 3k)
- 15 routes/ns 被以前的服务支持 (共 3k)
- 20 secrets/ns (共 4k)
- 10 config maps/ns (共 2k)
- 6 个网络策略/ns,包括 deny-all、allow-from ingress 和 in-namespace 规则
- 57 builds/ns
以下因素已知会对集群工作负载扩展有影响(正面的影响或负面的影响),在规划部署时应进行考虑。如需其他信息和指导,请联络您的销售代表或 红帽支持。
- 每个节点的 pod 数量
- 每个 pod 的容器数量
- 使用的探测类型(如 liveness/readiness、exec/http)
- 网络策略数量
- 项目或命名空间数量
- 每个项目的镜像流数
- 项目的构建数
- 服务/日期和类型数
- 路由数
- 分片数量
- secret 的数量
- 配置映射数量
API 调用率或集群 "churn",这是集群配置中快速变化的估算。
-
Prometheus 查询每秒 5 分钟窗口的 pod 创建请求:
sum(irate(apiserver_request_count{resource="pods",verb="POST"}[5m])) -
在 5 分钟的时间内 Prometheus 每秒查询所有 API 请求:
sum(irate(apiserver_request_count{}[5m]))
-
Prometheus 查询每秒 5 分钟窗口的 pod 创建请求:
- CPU 的集群节点资源消耗
- 集群节点资源消耗
2.2. 测试集群最大值的 OpenShift Container Platform 环境和配置
2.2.1. AWS 云平台
| 节点 | Flavor | vCPU | RAM(GiB) | 磁盘类型 | 磁盘大小(GiB)/IOS | 数量 | 区域 |
|---|---|---|---|---|---|---|---|
| control plane/etcd [1] | r5.4xlarge | 16 | 128 | gp3 | 220 | 3 | us-west-2 |
| Infra [2] | m5.12xlarge | 48 | 192 | gp3 | 100 | 3 | us-west-2 |
| Workload [3] | m5.4xlarge | 16 | 64 | gp3 | 500 [4] | 1 | us-west-2 |
| Compute | m5.2xlarge | 8 | 32 | gp3 | 100 | 3/25/250/500 [5] | us-west-2 |
- 带有基准性能为 3000 IOPS 和 125 MiB 每秒的 gp3 磁盘用于 control plane/etcd 节点,因为 etcd 对延迟敏感。gp3 卷不使用突发性能。
- Infra 节点用于托管 Monitoring、Ingress 和 Registry 组件,以确保它们有足够资源可大规模运行。
- 工作负载节点专用于运行性能和可扩展工作负载生成器。
- 使用更大的磁盘,以便有足够的空间存储在运行性能和可扩展性测试期间收集的大量数据。
- 在迭代中扩展了集群,且性能和可扩展性测试是在指定节点数中执行的。
2.2.2. IBM Power 平台
| 节点 | vCPU | RAM(GiB) | 磁盘类型 | 磁盘大小(GiB)/IOS | 数量 |
|---|---|---|---|---|---|
| control plane/etcd [1] | 16 | 32 | io1 | 每个 GiB 120 / 10 IOPS | 3 |
| Infra [2] | 16 | 64 | gp2 | 120 | 2 |
| Workload [3] | 16 | 256 | gp2 | 120 [4] | 1 |
| Compute | 16 | 64 | gp2 | 120 | 2 到 100 [5] |
- 带有 120 / 10 IOPS 的 io1 磁盘用于 control plane/etcd 节点,因为 etcd 非常大,且敏感延迟。
- Infra 节点用于托管 Monitoring、Ingress 和 Registry 组件,以确保它们有足够资源可大规模运行。
- 工作负载节点专用于运行性能和可扩展工作负载生成器。
- 使用更大的磁盘,以便有足够的空间存储在运行性能和可扩展性测试期间收集的大量数据。
- 在迭代中扩展了集群。
2.2.3. IBM Z 平台
| 节点 | vCPU [4] | RAM(GiB)[5] | 磁盘类型 | 磁盘大小(GiB)/IOS | 数量 |
|---|---|---|---|---|---|
| Control plane/etcd [1,2] | 8 | 32 | ds8k | 300 / LCU 1 | 3 |
| Compute [1,3] | 8 | 32 | ds8k | 150 / LCU 2 | 4 节点(每个节点扩展到 100/250/500 pod) |
- 节点在两个逻辑控制单元 (LCU) 之间分发,以优化 control plane/etcd 节点的磁盘 I/O 负载,因为 etcd 非常大,且对延迟敏感。etcd I/O 需求不应干扰其他工作负载。
- 四个计算节点用于运行同时具有 100/250/500 pod 的多个迭代的测试。首先,使用闲置 pod 来评估 pod 是否可以实例。接下来,使用网络和 CPU 要求客户端/服务器工作负载来评估系统在压力下的稳定性。客户端和服务器 pod 是部署范围,每个对分布在两个计算节点上。
- 没有单独的工作负载节点。工作负载在两个计算节点之间模拟微服务工作负载。
- 使用的物理处理器数量是 6 个用于 Linux (IFL)的集成设施。
- 使用的总物理内存为 512 GiB。
2.3. 如何根据经过测试的集群限制规划您的环境
在节点中过度订阅物理资源会影响在 pod 放置过程中对 Kubernetes 调度程序的资源保证。了解可以采取什么措施避免内存交换。
某些限制只在单一维度中扩展。当很多对象在集群中运行时,它们会有所不同。
本文档中给出的数字基于红帽的测试方法、设置、配置和调整。这些数字会根据您自己的设置和环境而有所不同。
在规划您的环境时,请确定每个节点会运行多少 个 pod :
required pods per cluster / pods per node = total number of nodes needed
每个节点的默认最多 pod 数为 250。而在某个节点中运行的 pod 的具体数量取决于应用程序本身。请参阅“如何根据应用程序要求规划您的环境”中的内容来计划应用程序的内存、CPU 和存储要求。
示例情境
如果您计划把集群的规模限制在有 2200 个 pod,则需要至少有五个节点,假设每个节点最多有 500 个 pod:
2200 / 500 = 4.4
如果将节点数量增加到 20,那么 pod 的分布情况将变为每个节点有 110 个 pod:
2200 / 20 = 110
其中:
required pods per cluster / total number of nodes = expected pods per node
OpenShift Container Platform 附带几个系统 pod,如 SDN、DNS、Operator 等,这些 pod 默认在每个 worker 节点上运行。因此,以上公式的结果可能会有所不同。
2.4. 如何根据应用程序要求规划您的环境
考虑应用程序环境示例:
| pod 类型 | pod 数量 | 最大内存 | CPU 内核 | 持久性存储 |
|---|---|---|---|---|
| Apache | 100 | 500 MB | 0.5 | 1 GB |
| node.js | 200 | 1 GB | 1 | 1 GB |
| postgresql | 100 | 1 GB | 2 | 10 GB |
| JBoss EAP | 100 | 1 GB | 1 | 1 GB |
推断的要求: 550 个 CPU 内核、450GB RAM 和 1.4TB 存储。
根据您的具体情况,节点的实例大小可以被增大或降低。在节点上通常会使用资源过度分配。在这个部署场景中,您可以选择运行多个额外的较小节点,或数量更少的较大节点来提供同样数量的资源。在做出决定前应考虑一些因素,如操作的灵活性以及每个实例的成本。
| 节点类型 | 数量 | CPU | RAM (GB) |
|---|---|---|---|
| 节点(选择 1) | 100 | 4 | 16 |
| 节点(选择 2) | 50 | 8 | 32 |
| 节点(选择 3) | 25 | 16 | 64 |
有些应用程序很适合于过度分配的环境,有些则不适合。大多数 Java 应用程序以及使用巨页的应用程序都不允许使用过度分配功能。它们的内存不能用于其他应用程序。在上面的例子中,环境大约会出现 30% 过度分配的情况,这是一个常见的比例。
应用程序 pod 可以使用环境变量或 DNS 访问服务。如果使用环境变量,当 pod 在节点上运行时,对于每个活跃服务,则 kubelet 的变量都会注入。集群感知 DNS 服务器监视 Kubernetes API 提供了新服务,并为每个服务创建一组 DNS 记录。如果整个集群中启用了 DNS,则所有 pod 都应自动根据其 DNS 名称解析服务。如果您必须超过 5000 服务,可以使用 DNS 进行服务发现。当使用环境变量进行服务发现时,参数列表超过了命名空间中 5000 服务后允许的长度,则 pod 和部署将失败。要解决这个问题,请禁用部署的服务规格文件中的服务链接:
---
apiVersion: template.openshift.io/v1
kind: Template
metadata:
  name: deployment-config-template
  creationTimestamp:
  annotations:
    description: This template will create a deploymentConfig with 1 replica, 4 env vars and a service.
    tags: ''
objects:
- apiVersion: apps.openshift.io/v1
  kind: DeploymentConfig
  metadata:
    name: deploymentconfig${IDENTIFIER}
  spec:
    template:
      metadata:
        labels:
          name: replicationcontroller${IDENTIFIER}
      spec:
        enableServiceLinks: false
        containers:
        - name: pause${IDENTIFIER}
          image: "${IMAGE}"
          ports:
          - containerPort: 8080
            protocol: TCP
          env:
          - name: ENVVAR1_${IDENTIFIER}
            value: "${ENV_VALUE}"
          - name: ENVVAR2_${IDENTIFIER}
            value: "${ENV_VALUE}"
          - name: ENVVAR3_${IDENTIFIER}
            value: "${ENV_VALUE}"
          - name: ENVVAR4_${IDENTIFIER}
            value: "${ENV_VALUE}"
          resources: {}
          imagePullPolicy: IfNotPresent
          capabilities: {}
          securityContext:
            capabilities: {}
            privileged: false
        restartPolicy: Always
        serviceAccount: ''
    replicas: 1
    selector:
      name: replicationcontroller${IDENTIFIER}
    triggers:
    - type: ConfigChange
    strategy:
      type: Rolling
- apiVersion: v1
  kind: Service
  metadata:
    name: service${IDENTIFIER}
  spec:
    selector:
      name: replicationcontroller${IDENTIFIER}
    ports:
    - name: serviceport${IDENTIFIER}
      protocol: TCP
      port: 80
      targetPort: 8080
    clusterIP: ''
    type: ClusterIP
    sessionAffinity: None
  status:
    loadBalancer: {}
parameters:
- name: IDENTIFIER
  description: Number to append to the name of resources
  value: '1'
  required: true
- name: IMAGE
  description: Image to use for deploymentConfig
  value: gcr.io/google-containers/pause-amd64:3.0
  required: false
- name: ENV_VALUE
  description: Value to use for environment variables
  generate: expression
  from: "[A-Za-z0-9]{255}"
  required: false
labels:
  template: deployment-config-template
可在命名空间中运行的应用程序 pod 数量取决于服务数量以及环境变量用于服务发现时的服务名称长度。系统上的 ARG_MAX 定义新进程的最大参数长度,默认设置为 2097152 字节 (2 MiB)。Kubelet 将环境变量注入到要在命名空间中运行的每个 pod 中,包括:
-
<SERVICE_NAME>_SERVICE_HOST=<IP> -
<SERVICE_NAME>_SERVICE_PORT=<PORT> -
<SERVICE_NAME>_PORT=tcp://<IP>:<PORT> -
<SERVICE_NAME>_PORT_<PORT>_TCP=tcp://<IP>:<PORT> -
<SERVICE_NAME>_PORT_<PORT>_TCP_PROTO=tcp -
<SERVICE_NAME>_PORT_<PORT>_TCP_PORT=<PORT> -
<SERVICE_NAME>_PORT_<PORT>_TCP_ADDR=<ADDR>
如果参数长度超过允许的值,服务名称中的字符数会受到影响,命名空间中的 pod 将开始失败。例如,在一个带有 5000 服务的命名空间中,服务名称的限制为 33 个字符,它可让您在命名空间中运行 5000 个 Pod。
第 3 章 IBM Z 和 IBM LinuxONE 环境的推荐主机实践
本主题为 IBM Z® 和 IBM® LinuxONE 上的 OpenShift Container Platform 提供推荐的主机实践。
s390x 架构在很多方面都是唯一的。因此,此处提出的一些建议可能不适用于其他平台。
除非另有说明,否则这些实践适用于 IBM Z® 和 IBM® LinuxONE 上的 z/VM 和 Red Hat Enterprise Linux (RHEL) KVM 安装。
3.1. 管理 CPU 过量使用
在高度虚拟化的 IBM Z® 环境中,您必须仔细规划基础架构的设置和大小。虚拟化最重要的功能之一是能够进行资源过量使用,从而将更多资源分配给虚拟机,而不是在管理程序级别实际可用。这主要依赖于具体的工作负载,并没有适用于所有环境的“黄金法则”。
根据您的设置,在设计 CPU 过量使用 时请考虑这些最佳实践:
- 在 LPAR 级别 (PR/SM hypervisor),避免将所有可用物理内核 (IFL) 分配给每个 LPAR。例如,当有四个物理 IFL 可用时,您不应该定义三个 LPAR,每个都带有四个逻辑 IFL。
- 检查并了解 LPAR 共享和权重.
- 过多的虚拟 CPU 会对性能造成负面影响。不要将比逻辑处理器定义为 LPAR 更多的虚拟处理器。
- 为峰值工作负载配置每个客户机的虚拟处理器数量,而不是配置更多.
- 从一个小的数量开始,并监控工作负载。如有必要,逐步增加 vCPU 数量。
- 并非所有工作负载都适合适用高过量使用比率。如果工作负载是 CPU 密集型的,那么您可能无法在不对性能造成影响的情况下使用高的比率。对于高 I/O 密集型工作负载,即便具有较高的过量使用比率,也能保持一致的性能。
3.2. 禁用透明巨页
Transparent Huge Pages (THP) 会试图自动执行创建、管理和使用巨页的大部分方面。由于 THP 自动管理巨页,因此并不始终对所有类型的工作负载进行最佳处理。THP 可能会导致性能下降,因为许多应用程序都自行处理巨页。因此,请考虑禁用 THP。
3.3. 使用 Receive Flow Steering(RFS)提高网络性能
通过进一步减少网络延迟,Receive Flow Steering (RFS) 进一步扩展了 Receive Packet Steering (RPS)。RFS 在技术上基于 RPS,通过增加 CPU 缓存命中率来提高数据包处理的效率。RFS 通过确定计算最方便的 CPU,以便缓存命中更有可能在 CPU 中发生,增加了对队列长度的考虑。因此,会减少 CPU 缓存无效的频率,从而只需要较少的循环来重建缓存。这有助于缩短数据包处理运行时间。
3.3.1. 使用 Machine Config Operator (MCO) 激活 RFS
流程
将以下 MCO 示例配置集复制到 YAML 文件中。例如,
enable-rfs.yaml:apiVersion: machineconfiguration.openshift.io/v1 kind: MachineConfig metadata: labels: machineconfiguration.openshift.io/role: worker name: 50-enable-rfs spec: config: ignition: version: 2.2.0 storage: files: - contents: source: data:text/plain;charset=US-ASCII,%23%20turn%20on%20Receive%20Flow%20Steering%20%28RFS%29%20for%20all%20network%20interfaces%0ASUBSYSTEM%3D%3D%22net%22%2C%20ACTION%3D%3D%22add%22%2C%20RUN%7Bprogram%7D%2B%3D%22/bin/bash%20-c%20%27for%20x%20in%20/sys/%24DEVPATH/queues/rx-%2A%3B%20do%20echo%208192%20%3E%20%24x/rps_flow_cnt%3B%20%20done%27%22%0A filesystem: root mode: 0644 path: /etc/udev/rules.d/70-persistent-net.rules - contents: source: data:text/plain;charset=US-ASCII,%23%20define%20sock%20flow%20enbtried%20for%20%20Receive%20Flow%20Steering%20%28RFS%29%0Anet.core.rps_sock_flow_entries%3D8192%0A filesystem: root mode: 0644 path: /etc/sysctl.d/95-enable-rps.conf创建 MCO 配置集:
$ oc create -f enable-rfs.yaml
验证是否列出了名为
50-enable-rfs的条目:$ oc get mc
要取消激活,请输入:
$ oc delete mc 50-enable-rfs
3.4. 选择您的网络设置
网络堆栈是 OpenShift Container Platform 等基于 Kubernetes 的产品最重要的组件之一。对于 IBM Z® 设置,网络设置取决于您选择的虚拟机监控程序。取决于具体的工作负载和应用,最佳实践通常需要根据用例和流量模式进行更改。
根据您的设置,考虑以下最佳实践:
- 考虑有关网络设备的所有选项,以优化您的流量模式。探索 OSA-Express、RoCE Express、HiperSockets、z/VM VSwitch、Linux 网桥 (KVM) 的优势,以确定哪个选项为您的设置带来最大好处。
- 始终使用最新可用的 NIC 版本。例如,OSA Express 7S 10 GbE 与带有事务工作负载类型的 OSA Express 6S 10 GbE 相比有显著改进,尽管两者都是 10 GbE 适配器。
- 每个虚拟交换机都添加了额外的延迟层。
- 负载平衡器在集群外的网络通信中扮演重要角色。如果这对应用程序至关重要,请考虑使用生产环境级的硬件负载平衡器。
- OpenShift Container Platform SDN 引入了影响网络性能的流程和规则。确保对 pod 关联性和放置进行考虑,以便至关重要的服务会受益于本地通信的优势。
- 平衡性能和功能之间的权衡.
3.5. 确保 z/VM 上使用 HyperPAV 的高磁盘性能
DASD 和 ECKD 设备通常在 IBM Z® 环境中使用的磁盘类型。在 z/VM 环境中的典型 OpenShift Container Platform 设置中,DASD 磁盘通常用于支持节点的本地存储。您可以设置 HyperPAV 别名设备,以便为支持 z/VM 客户机的 DASD 磁盘提供更多吞吐量和总体更好的 I/O 性能。
将 HyperPAV 用于本地存储设备可带来显著的性能优势。但是,您必须考虑吞吐量和 CPU 成本之间有一个权衡。
3.5.1. 使用 Machine Config Operator (MCO) 在使用 z/VM full-pack minidisks 的节点中激活 HyperPAV 别名
对于使用 full-pack minidisk 的基于 z/VM 的 OpenShift Container Platform 设置,您可以通过在所有节点中激活 HyperPAV 别名来利用 MCO 配置集的优势。您必须为 control plane 和计算节点添加 YAML 配置。
流程
将以下 MCO 示例配置集复制到 control plane 节点的 YAML 文件中。例如,
05-master-kernelarg-hpav.yaml:$ cat 05-master-kernelarg-hpav.yaml apiVersion: machineconfiguration.openshift.io/v1 kind: MachineConfig metadata: labels: machineconfiguration.openshift.io/role: master name: 05-master-kernelarg-hpav spec: config: ignition: version: 3.1.0 kernelArguments: - rd.dasd=800-805将以下 MCO 示例配置集复制到计算节点的 YAML 文件中。例如,
05-worker-kernelarg-hpav.yaml:$ cat 05-worker-kernelarg-hpav.yaml apiVersion: machineconfiguration.openshift.io/v1 kind: MachineConfig metadata: labels: machineconfiguration.openshift.io/role: worker name: 05-worker-kernelarg-hpav spec: config: ignition: version: 3.1.0 kernelArguments: - rd.dasd=800-805注意您必须修改
rd.dasd参数以适合设备 ID。创建 MCO 配置集:
$ oc create -f 05-master-kernelarg-hpav.yaml
$ oc create -f 05-worker-kernelarg-hpav.yaml
要取消激活,请输入:
$ oc delete -f 05-master-kernelarg-hpav.yaml
$ oc delete -f 05-worker-kernelarg-hpav.yaml
3.6. IBM Z 主机上的 RHEL KVM 建议
优化 KVM 虚拟服务器环境很大程度上取决于虚拟服务器的工作负载和可用资源。增强一个环境中性能的相同操作可能会对另一种环境产生负面影响。为特定设置找到最佳平衡可能是一项挑战,通常需要进行各种试验。
下面的部分介绍了在 IBM Z® 和 IBM® LinuxONE 环境中将 OpenShift Container Platform 与 RHEL KVM 搭配使用时的一些最佳实践。
3.6.1. 对虚拟块设备使用 I/O 线程
要使虚拟块设备使用 I/O 线程,您必须为虚拟服务器和每个虚拟块设备配置一个或多个 I/O 线程,以使用其中一个 I/O 线程。
以下示例指定了 <iothreads>3</iothreads> 来配置三个 I/O 线程,带有连续十进制线程 ID 1、2 和 3。iothread="2" 参数指定要使用 ID 为 2 的 I/O 线程的磁盘设备的驱动程序元素。
I/O 线程规格示例
...
<domain>
 	<iothreads>3</iothreads>1
  	 ...
    	<devices>
       ...
          <disk type="block" device="disk">2
<driver ... iothread="2"/>
    </disk>
       ...
    	</devices>
   ...
</domain>
线程可以提高磁盘设备的 I/O 操作性能,但也可使用内存和 CPU 资源。您可以将多个设备配置为使用同一线程。线程到设备的最佳映射取决于可用资源和工作负载。
从少量 I/O 线程开始。通常,为所有磁盘设备使用单个 I/O 线程就足够了。不要配置超过虚拟 CPU 数量的线程,也不要配置空闲线程。
您可以使用 virsh iothreadadd 命令将具有特定线程 ID 的 I/O 线程添加到正在运行的虚拟服务器。
3.6.2. 避免虚拟 SCSI 设备
仅在需要通过 SCSI 特定的接口解决设备时配置虚拟 SCSI 设备。将磁盘空间配置为虚拟块设备,而非虚拟 SCSI 设备,无论主机上的支持是什么。
但是,您可能需要以下特定于 SCSI 的接口:
- 主机上 SCSI 附加磁带驱动器的 LUN。
- 在主机文件系统中挂载在虚拟 DVD 驱动器中的 DVD ISO 文件。
3.6.3. 为磁盘配置客户机缓存
将磁盘设备配置为由客户机而不是主机执行缓存。
确保磁盘设备的 driver 元素包含 cache="none" 和 io="native" 参数。
<disk type="block" device="disk">
    <driver name="qemu" type="raw" cache="none" io="native" iothread="1"/>
...
</disk>
3.6.4. 排除内存气球(Balloon)设备
除非您需要动态内存大小,否则请不要定义内存气球设备,并确保 libvirt 不会为您创建。将 memballoon 参数作为设备元素的子项包含在您的域配置 XML 文件中。
检查活跃配置集列表:
<memballoon model="none"/>
3.6.5. 调整主机调度程序的 CPU 迁移算法
除非您非常了解相关的影响,请不要更改调度程序设置。在进行完整的测试并确定相关的影响前,不要对生产系统应用更改。
kernel.sched_migration_cost_ns 参数指定以纳秒为单位的时间间隔。任务最后一次执行后,CPU 缓存被视为具有有用内容,直到此间隔过期为止。增加这个间隔会导致任务迁移减少。默认值为 500000 ns。
如果存在可运行的进程时 CPU 空闲时间高于预期的间隔,请尝试缩短这个间隔。如果任务非常频繁地在 CPU 或节点之间进行转换,请尝试增加它。
要动态将间隔设置为 60000 ns,请输入以下命令:
# sysctl kernel.sched_migration_cost_ns=60000
要将值永久更改为 60000 ns,在 /etc/sysctl.conf 中添加以下条目:
kernel.sched_migration_cost_ns=60000
3.6.6. 禁用 cpuset cgroup 控制器
此设置仅适用于使用 cgroups 版本 1 的 KVM 主机。要在主机上启用 CPU 热插拔,请禁用 cgroup 控制器。
流程
-
使用您选择的编辑器打开
/etc/libvirt/qemu.conf。 -
转至
cgroup_controllers行。 - 复制整行并从副本中删除前导编号符号(#)。
删除
cpuset条目,如下所示:cgroup_controllers = [ "cpu", "devices", "memory", "blkio", "cpuacct" ]
要使新设置生效,您必须重启 libvirtd 守护进程:
- 停止所有虚拟机。
运行以下命令:
# systemctl restart libvirtd
- 重新启动虚拟机。
此设置在主机重新引导后保留。
3.6.7. 为空闲的虚拟 CPU 调整轮询周期
当虚拟 CPU 空闲时,KVM 会轮询虚拟 CPU 的唤醒条件,然后再分配主机资源。您可以指定时间间隔,在间隔期间在 /sys/module/kvm/parameters/halt_poll_ns 的 sysfs 中进行轮询。在指定时间内,轮询可减少虚拟 CPU 的唤醒延迟,但会牺牲资源使用量。根据工作负载,更长或更短的轮询时间可能很有用。时间间隔以纳秒为单位指定。默认值为 50000 ns。
要针对低 CPU 消耗进行优化,请输入一个小的值或写入 0 来禁用轮询:
# echo 0 > /sys/module/kvm/parameters/halt_poll_ns
要针对低延迟进行优化(例如,用于事务的工作负载),请输入一个大的值:
# echo 80000 > /sys/module/kvm/parameters/halt_poll_ns
第 4 章 使用 Node Tuning Operator
了解 Node Tuning Operator,以及如何使用它通过编排 tuned 守护进程以管理节点级别的性能优化。
4.1. 关于 Node Tuning Operator
Node Tuning Operator 可以帮助您通过编排 TuneD 守护进程来管理节点级别的性能优化,并使用 Performance Profile 控制器获得低延迟性能。大多数高性能应用程序都需要一定程度的内核级性能优化。Node Tuning Operator 为用户提供了一个统一的、节点一级的 sysctl 管理接口,并可以根据具体用户的需要灵活地添加自定义性能优化设置。
Operator 将为 OpenShift Container Platform 容器化 TuneD 守护进程作为一个 Kubernetes 守护进程集进行管理。它保证了自定义性能优化设置以可被守护进程支持的格式传递到在集群中运行的所有容器化的 TuneD 守护进程中。相应的守护进程会在集群的所有节点上运行,每个节点上运行一个。
在发生触发配置集更改的事件时,或通过接收和处理终止信号安全终止容器化 TuneD 守护进程时,容器化 TuneD 守护进程所应用的节点级设置将被回滚。
Node Tuning Operator 使用 Performance Profile 控制器来实现自动性能优化,从而实现 OpenShift Container Platform 应用程序的低延迟性能。
集群管理员配置了性能配置集以定义节点级别的设置,例如:
- 将内核更新至 kernel-rt。
- 为内务选择 CPU。
- 为运行工作负载选择 CPU。
目前,cgroup v2 不支持禁用 CPU 负载均衡。因此,如果您启用了 cgroup v2,则可能无法从性能配置集中获取所需的行为。如果您使用 executeace 配置集,则不建议启用 cgroup v2。
在版本 4.1 及更高版本中,OpenShift Container Platform 标准安装中包含了 Node Tuning Operator。
在早期版本的 OpenShift Container Platform 中,Performance Addon Operator 用来实现自动性能优化,以便为 OpenShift 应用程序实现低延迟性能。在 OpenShift Container Platform 4.11 及更新的版本中,这个功能是 Node Tuning Operator 的一部分。
4.2. 访问 Node Tuning Operator 示例规格
使用此流程来访问 Node Tuning Operator 的示例规格。
流程
运行以下命令以访问 Node Tuning Operator 示例规格:
oc get tuned.tuned.openshift.io/default -o yaml -n openshift-cluster-node-tuning-operator
默认 CR 旨在为 OpenShift Container Platform 平台提供标准的节点级性能优化,它只能被修改来设置 Operator Management 状态。Operator 将覆盖对默认 CR 的任何其他自定义更改。若进行自定义性能优化,请创建自己的 Tuned CR。新创建的 CR 将与默认的 CR 合并,并基于节点或 pod 标识和配置文件优先级对节点应用自定义调整。
虽然在某些情况下,对 pod 标识的支持可以作为自动交付所需调整的一个便捷方式,但我们不鼓励使用这种方法,特别是在大型集群中。默认 Tuned CR 并不带有 pod 标识匹配。如果创建了带有 pod 标识匹配的自定义配置集,则该功能将在此时启用。在以后的 Node Tuning Operator 版本中将弃用 pod 标识功能。
4.3. 在集群中设置默认配置集
以下是在集群中设置的默认配置集。
apiVersion: tuned.openshift.io/v1
kind: Tuned
metadata:
  name: default
  namespace: openshift-cluster-node-tuning-operator
spec:
  profile:
  - data: |
      [main]
      summary=Optimize systems running OpenShift (provider specific parent profile)
      include=-provider-${f:exec:cat:/var/lib/tuned/provider},openshift
    name: openshift
  recommend:
  - profile: openshift-control-plane
    priority: 30
    match:
    - label: node-role.kubernetes.io/master
    - label: node-role.kubernetes.io/infra
  - profile: openshift-node
    priority: 40
从 OpenShift Container Platform 4.9 开始,所有 OpenShift TuneD 配置集都随 TuneD 软件包一起提供。您可以使用 oc exec 命令查看这些配置集的内容:
$ oc exec $tuned_pod -n openshift-cluster-node-tuning-operator -- find /usr/lib/tuned/openshift{,-control-plane,-node} -name tuned.conf -exec grep -H ^ {} \;4.4. 验证是否应用了 TuneD 配置集
验证应用到集群节点的 TuneD 配置集。
$ oc get profile.tuned.openshift.io -n openshift-cluster-node-tuning-operator
输出示例
NAME             TUNED                     APPLIED   DEGRADED   AGE
master-0         openshift-control-plane   True      False      6h33m
master-1         openshift-control-plane   True      False      6h33m
master-2         openshift-control-plane   True      False      6h33m
worker-a         openshift-node            True      False      6h28m
worker-b         openshift-node            True      False      6h28m
-
NAME:配置集(Profile)对象的名称。每个节点有一个 Profile 对象,其名称相互匹配。 -
TUNED:要应用的 TuneD 配置集的名称。 -
APPLIED:如果 TuneD 守护进程应用了所需的配置集,则为True。(True/False/Unknown)。 -
DEGRADED:如果在应用 TuneD 配置集时报告了任何错误则为True(True/False/Unknown)。 -
AGE:创建 Profile 对象后经过的时间。
ClusterOperator/node-tuning 对象还包含有关 Operator 及其节点代理健康状况的有用信息。例如,ClusterOperator /node-tuning 状态消息报告 Operator 错误配置。
要获取 ClusterOperator/node-tuning 对象的状态信息,请运行以下命令:
$ oc get co/node-tuning -n openshift-cluster-node-tuning-operator
输出示例
NAME          VERSION   AVAILABLE   PROGRESSING   DEGRADED   SINCE   MESSAGE
node-tuning   4.15.1    True        False         True       60m     1/5 Profiles with bootcmdline conflict
如果 ClusterOperator/node-tuning 或配置集对象的状态是 DEGRADED,则 Operator 或操作对象日志中会提供额外的信息。
4.5. 自定义调整规格
Operator 的自定义资源 (CR) 包含两个主要部分。第一部分是 profile:,这是 TuneD 配置集及其名称的列表。第二部分是 recommend:,用来定义配置集选择逻辑。
多个自定义调优规格可以共存,作为 Operator 命名空间中的多个 CR。Operator 会检测到是否存在新 CR 或删除了旧 CR。所有现有的自定义性能优化设置都会合并,同时更新容器化 TuneD 守护进程的适当对象。
管理状态
通过调整默认的 Tuned CR 来设置 Operator Management 状态。默认情况下,Operator 处于 Managed 状态,默认的 Tuned CR 中没有 spec.managementState 字段。Operator Management 状态的有效值如下:
- Managed: Operator 会在配置资源更新时更新其操作对象
- Unmanaged: Operator 将忽略配置资源的更改
- Removed: Operator 将移除 Operator 置备的操作对象和资源
配置集数据
profile: 部分列出了 TuneD 配置集及其名称。
profile:
- name: tuned_profile_1
  data: |
    # TuneD profile specification
    [main]
    summary=Description of tuned_profile_1 profile

    [sysctl]
    net.ipv4.ip_forward=1
    # ... other sysctl's or other TuneD daemon plugins supported by the containerized TuneD

# ...

- name: tuned_profile_n
  data: |
    # TuneD profile specification
    [main]
    summary=Description of tuned_profile_n profile

    # tuned_profile_n profile settings
建议的配置集
profile: 选择逻辑通过 CR 的 recommend: 部分来定义。recommend: 部分是根据选择标准推荐配置集的项目列表。
recommend:
<recommend-item-1>
# ...
<recommend-item-n>
列表中的独立项:
- machineConfigLabels: 1
    <mcLabels> 2
  match: 3
    <match> 4
  priority: <priority> 5
  profile: <tuned_profile_name> 6
  operand: 7
    debug: <bool> 8
    tunedConfig:
      reapply_sysctl: <bool> 9
- 1
- 可选。
- 2
MachineConfig标签的键/值字典。键必须是唯一的。- 3
- 如果省略,则会假设配置集匹配,除非设置了优先级更高的配置集,或设置了
machineConfigLabels。 - 4
- 可选列表。
- 5
- 配置集排序优先级。较低数字表示优先级更高(
0是最高优先级)。 - 6
- 在匹配项中应用的 TuneD 配置集。例如
tuned_profile_1。 - 7
- 可选操作对象配置。
- 8
- 为 TuneD 守护进程打开或关闭调试。
true为打开,false为关闭。默认值为false。 - 9
- 为 TuneD 守护进程打开或关闭
reapply_sysctl功能。选择true代表开启,false代表关闭。
<match> 是一个递归定义的可选数组,如下所示:
- label: <label_name> 1
  value: <label_value> 2
  type: <label_type> 3
    <match> 4
如果不省略 <match>,则所有嵌套的 <match> 部分也必须评估为 true。否则会假定 false,并且不会应用或建议具有对应 <match> 部分的配置集。因此,嵌套(子级 <match> 部分)会以逻辑 AND 运算来运作。反之,如果匹配 <match> 列表中任何一项,整个 <match> 列表评估为 true。因此,该列表以逻辑 OR 运算来运作。
如果定义 了 machineConfigLabels,基于机器配置池的匹配会对给定的 recommend: 列表项打开。<mcLabels> 指定机器配置标签。机器配置会自动创建,以在配置集 <tuned_profile_name> 中应用主机设置,如内核引导参数。这包括使用与 <mcLabels> 匹配的机器配置选择器查找所有机器配置池,并在分配了找到的机器配置池的所有节点上设置配置集 <tuned_profile_name>。要针对同时具有 master 和 worker 角色的节点,您必须使用 master 角色。
列表项 match 和 machineConfigLabels 由逻辑 OR 操作符连接。match 项首先以短电路方式评估。因此,如果它被评估为 true,则不考虑 MachineConfigLabels 项。
当使用基于机器配置池的匹配时,建议将具有相同硬件配置的节点分组到同一机器配置池中。不遵循这个原则可能会导致在共享同一机器配置池的两个或者多个节点中 TuneD 操作对象导致内核参数冲突。
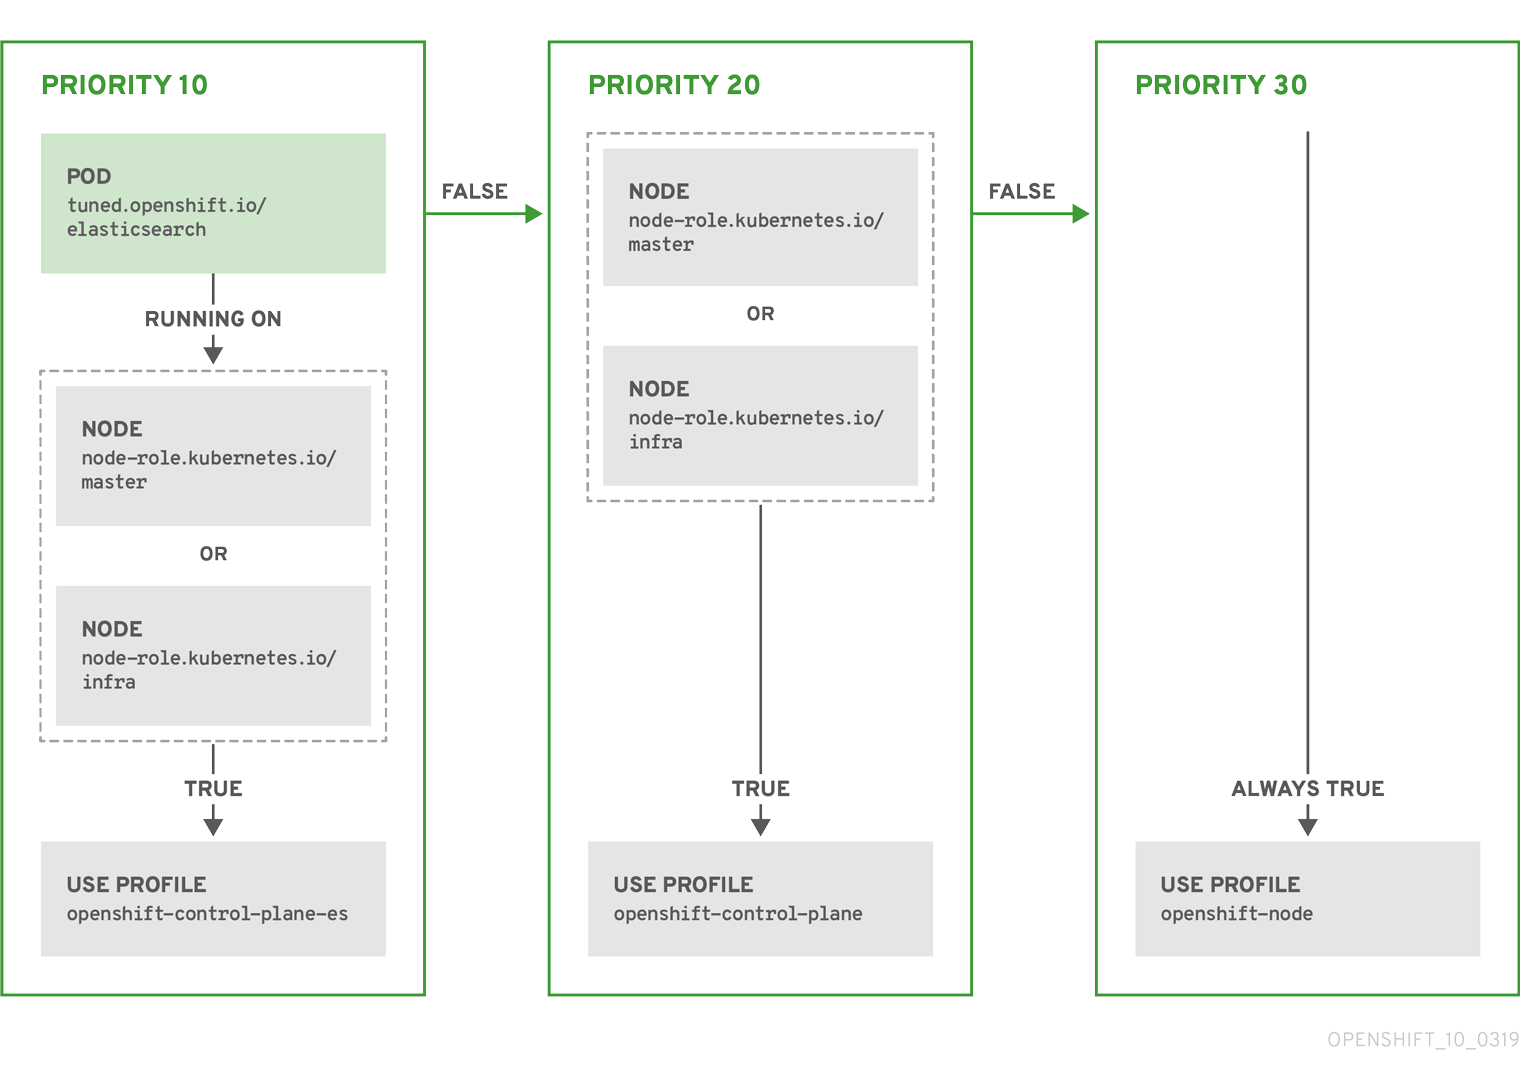
示例:基于节点或 pod 标签的匹配
- match:
  - label: tuned.openshift.io/elasticsearch
    match:
    - label: node-role.kubernetes.io/master
    - label: node-role.kubernetes.io/infra
    type: pod
  priority: 10
  profile: openshift-control-plane-es
- match:
  - label: node-role.kubernetes.io/master
  - label: node-role.kubernetes.io/infra
  priority: 20
  profile: openshift-control-plane
- priority: 30
  profile: openshift-node
根据配置集优先级,以上 CR 针对容器化 TuneD 守护进程转换为 recommend.conf 文件。优先级最高 (10) 的配置集是 openshift-control-plane-es,因此会首先考虑它。在给定节点上运行的容器化 TuneD 守护进程会查看同一节点上是否在运行设有 tuned.openshift.io/elasticsearch 标签的 pod。如果没有,则整个 <match> 部分评估为 false。如果存在具有该标签的 pod,为了让 <match> 部分评估为 true,节点标签也需要是 node-role.kubernetes.io/master 或 node-role.kubernetes.io/infra。
如果这些标签对优先级为 10 的配置集而言匹配,则应用 openshift-control-plane-es 配置集,并且不考虑其他配置集。如果节点/pod 标签组合不匹配,则考虑优先级第二高的配置集 (openshift-control-plane)。如果容器化 TuneD Pod 在具有标签 node-role.kubernetes.io/master 或 node-role.kubernetes.io/infra 的节点上运行,则应用此配置集。
最后,配置集 openshift-node 的优先级最低 (30)。它没有 <match> 部分,因此始终匹配。如果给定节点上不匹配任何优先级更高的配置集,它会作为一个适用于所有节点的配置集来设置 openshift-node 配置集。
示例:基于机器配置池的匹配
apiVersion: tuned.openshift.io/v1
kind: Tuned
metadata:
  name: openshift-node-custom
  namespace: openshift-cluster-node-tuning-operator
spec:
  profile:
  - data: |
      [main]
      summary=Custom OpenShift node profile with an additional kernel parameter
      include=openshift-node
      [bootloader]
      cmdline_openshift_node_custom=+skew_tick=1
    name: openshift-node-custom

  recommend:
  - machineConfigLabels:
      machineconfiguration.openshift.io/role: "worker-custom"
    priority: 20
    profile: openshift-node-custom
为尽量减少节点的重新引导情况,为目标节点添加机器配置池将匹配的节点选择器标签,然后创建上述 Tuned CR,最后创建自定义机器配置池。
特定于云供应商的 TuneD 配置集
使用此功能,所有针对于 OpenShift Container Platform 集群上的云供应商都可以方便地分配 TuneD 配置集。这可实现,而无需添加额外的节点标签或将节点分组到机器配置池中。
这个功能会利用 spec.providerID 节点对象值(格式为 <cloud-provider>://<cloud-provider-specific-id>),并在 NTO operand 容器中写带有 <cloud-provider> 值的文件 /var/lib/tuned/provider。然后,TuneD 会使用这个文件的内容来加载 provider-<cloud-provider> 配置集(如果这个配置集存在)。
openshift 配置集(openshift-control-plane 和 openshift-node 配置集都从其中继承设置)现在被更新来使用这个功能(通过使用条件配置集加载)。NTO 或 TuneD 目前不包含任何特定于云供应商的配置集。但是,您可以创建一个自定义配置集 provider-<cloud-provider>,它将适用于所有针对于所有云供应商的集群节点。
GCE 云供应商配置集示例
apiVersion: tuned.openshift.io/v1
kind: Tuned
metadata:
  name: provider-gce
  namespace: openshift-cluster-node-tuning-operator
spec:
  profile:
  - data: |
      [main]
      summary=GCE Cloud provider-specific profile
      # Your tuning for GCE Cloud provider goes here.
    name: provider-gce
由于配置集的继承,provider-<cloud-provider> 配置集中指定的任何设置都会被 openshift 配置集及其子配置集覆盖。
4.6. 自定义调整示例
从默认 CR 中使用 TuneD 配置集
以下 CR 对带有标签 tuned.openshift.io/ingress-node-label 的 OpenShift Container Platform 节点应用节点一级的自定义调整。
示例:使用 openshift-control-plane TuneD 配置集进行自定义性能优化
apiVersion: tuned.openshift.io/v1
kind: Tuned
metadata:
  name: ingress
  namespace: openshift-cluster-node-tuning-operator
spec:
  profile:
  - data: |
      [main]
      summary=A custom OpenShift ingress profile
      include=openshift-control-plane
      [sysctl]
      net.ipv4.ip_local_port_range="1024 65535"
      net.ipv4.tcp_tw_reuse=1
    name: openshift-ingress
  recommend:
  - match:
    - label: tuned.openshift.io/ingress-node-label
    priority: 10
    profile: openshift-ingress
对于开发自定义配置集的人员。我们强烈建议包括在默认 Tuned CR 中提供的默认 TuneD 守护进程配置集。上面的示例使用默认 openshift-control-plane 配置集。
使用内置 TuneD 配置集
由于 NTO 管理的守护进程集已被成功推出,TuneD 操作对象会管理 TuneD 守护进程的同一版本。要列出守护进程支持的内置 TuneD 配置集,请以以下方式查询任何 TuneD pod:
$ oc exec $tuned_pod -n openshift-cluster-node-tuning-operator -- find /usr/lib/tuned/ -name tuned.conf -printf '%h\n' | sed 's|^.*/||'
您可以使用自定义调优规格中检索的配置集名称。
示例:使用内置 hpc-compute TuneD 配置集
apiVersion: tuned.openshift.io/v1
kind: Tuned
metadata:
  name: openshift-node-hpc-compute
  namespace: openshift-cluster-node-tuning-operator
spec:
  profile:
  - data: |
      [main]
      summary=Custom OpenShift node profile for HPC compute workloads
      include=openshift-node,hpc-compute
    name: openshift-node-hpc-compute

  recommend:
  - match:
    - label: tuned.openshift.io/openshift-node-hpc-compute
    priority: 20
    profile: openshift-node-hpc-compute
除了内置的 hpc-compute 配置集外,上面的示例还包括默认 Tuned CR 中提供的 openshift-node TuneD 守护进程配置集,以对计算节点使用特定于 OpenShift 的调优。
覆盖主机级别 sysctl
可以使用 /run/sysctl.d/、/etc/sysctl.d/ 和 / etc/sysctl.conf 主机配置文件在运行时更改各种内核参数。OpenShift Container Platform 添加几个主机配置文件,在运行时设置内核参数;例如 net.ipv[4-6].、fs.inotify., 和 vm.max_map_count。这些运行时参数在 kubelet 和 Operator 启动前为系统提供基本功能调整。
除非 reapply_sysctl 选项设置为 false,否则 Operator 不会覆盖这些设置。将这个选项设置为 false 会导致 TuneD 在应用其自定义配置集后不会应用主机配置文件中的设置。
示例:覆盖主机级别 sysctl
apiVersion: tuned.openshift.io/v1
kind: Tuned
metadata:
  name: openshift-no-reapply-sysctl
  namespace: openshift-cluster-node-tuning-operator
spec:
  profile:
  - data: |
      [main]
      summary=Custom OpenShift profile
      include=openshift-node
      [sysctl]
      vm.max_map_count=>524288
    name: openshift-no-reapply-sysctl
  recommend:
  - match:
    - label: tuned.openshift.io/openshift-no-reapply-sysctl
    priority: 15
    profile: openshift-no-reapply-sysctl
    operand:
      tunedConfig:
        reapply_sysctl: false
4.7. 支持的 TuneD 守护进程插件
在使用 Tuned CR 的 profile: 部分中定义的自定义配置集时,以下 TuneD 插件都受到支持,但 [main] 部分除外:
- audio
- cpu
- disk
- eeepc_she
- modules
- mounts
- net
- scheduler
- scsi_host
- selinux
- sysctl
- sysfs
- usb
- video
- vm
- bootloader
其中一些插件提供了不受支持的动态性能优化功能。目前不支持以下 TuneD 插件:
- script
- systemd
TuneD bootloader 插件只支持 Red Hat Enterprise Linux CoreOS (RHCOS) worker 节点。
其他资源
4.8. 在托管集群中配置节点性能优化
要在托管集群中的节点上设置节点级别性能优化,您可以使用 Node Tuning Operator。在托管的 control plane 中,您可以通过创建包含 Tuned 对象并在节点池中引用这些配置映射的配置映射来配置节点调整。
流程
创建包含有效 tuned 清单的配置映射,并引用节点池中的清单。在以下示例中,
Tuned清单定义了一个配置文件,在包含tuned-1-node-label节点标签的节点上将vm.dirty_ratio设为 55。将以下ConfigMap清单保存到名为tuned-1.yaml的文件中:apiVersion: v1 kind: ConfigMap metadata: name: tuned-1 namespace: clusters data: tuning: | apiVersion: tuned.openshift.io/v1 kind: Tuned metadata: name: tuned-1 namespace: openshift-cluster-node-tuning-operator spec: profile: - data: | [main] summary=Custom OpenShift profile include=openshift-node [sysctl] vm.dirty_ratio="55" name: tuned-1-profile recommend: - priority: 20 profile: tuned-1-profile注意如果您没有将任何标签添加到 Tuned spec 的
spec.recommend部分中的条目中,则假定基于 node-pool 的匹配,因此spec.recommend部分中的最高优先级配置集应用于池中的节点。虽然您可以通过在 Tuned.spec.recommend.match部分中设置标签值来实现更精细的节点标记匹配,除非您将节点池的.spec.management.upgradeType值设置为InPlace。在管理集群中创建
ConfigMap对象:$ oc --kubeconfig="$MGMT_KUBECONFIG" create -f tuned-1.yaml
通过编辑节点池或创建节点池的
spec.tuningConfig字段中引用ConfigMap对象。在本例中,假设您只有一个NodePool,名为nodepool-1,它含有 2 个节点。apiVersion: hypershift.openshift.io/v1alpha1 kind: NodePool metadata: ... name: nodepool-1 namespace: clusters ... spec: ... tuningConfig: - name: tuned-1 status: ...注意您可以在多个节点池中引用同一配置映射。在托管的 control plane 中,Node Tuning Operator 会将节点池名称和命名空间的哈希值附加到 Tuned CR 的名称中,以区分它们。在这种情况下,请不要为同一托管集群在不同的 Tuned CR 中创建多个名称相同的 TuneD 配置集。
验证
现在,您已创建包含 Tuned 清单的 ConfigMap 对象并在 NodePool 中引用它,Node Tuning Operator 会将 Tuned 对象同步到托管集群中。您可以验证定义了 Tuned 对象,以及将 TuneD 配置集应用到每个节点。
列出托管的集群中的
Tuned对象:$ oc --kubeconfig="$HC_KUBECONFIG" get tuned.tuned.openshift.io -n openshift-cluster-node-tuning-operator
输出示例
NAME       AGE
default    7m36s
rendered   7m36s
tuned-1    65s
列出托管的集群中的
Profile对象:$ oc --kubeconfig="$HC_KUBECONFIG" get profile.tuned.openshift.io -n openshift-cluster-node-tuning-operator
输出示例
NAME                           TUNED            APPLIED   DEGRADED   AGE
nodepool-1-worker-1            tuned-1-profile  True      False      7m43s
nodepool-1-worker-2            tuned-1-profile  True      False      7m14s
注意如果没有创建自定义配置集,则默认应用
openshift-node配置集。要确认正确应用了调整,请在节点上启动一个 debug shell,并检查 sysctl 值:
$ oc --kubeconfig="$HC_KUBECONFIG" debug node/nodepool-1-worker-1 -- chroot /host sysctl vm.dirty_ratio
输出示例
vm.dirty_ratio = 55
4.9. 通过设置内核引导参数来对托管集群进行高级节点调整
对于托管 control plane 中的高级性能优化(需要设置内核引导参数),您还可以使用 Node Tuning Operator。以下示例演示了如何创建保留巨页的节点池。
流程
创建一个
ConfigMap对象,其中包含一个Tuned对象清单,用于创建大小为 2 MB 的 10 个巨页。将此ConfigMap清单保存到名为tuned-hugepages.yaml的文件中:apiVersion: v1 kind: ConfigMap metadata: name: tuned-hugepages namespace: clusters data: tuning: | apiVersion: tuned.openshift.io/v1 kind: Tuned metadata: name: hugepages namespace: openshift-cluster-node-tuning-operator spec: profile: - data: | [main] summary=Boot time configuration for hugepages include=openshift-node [bootloader] cmdline_openshift_node_hugepages=hugepagesz=2M hugepages=50 name: openshift-node-hugepages recommend: - priority: 20 profile: openshift-node-hugepages注意.spec.recommend.match字段被有意留空。在本例中,这个Tuned对象应用到引用此ConfigMap对象的节点池中的所有节点。将具有相同硬件配置的节点分组到同一节点池中。否则,TuneD 操作对象可以为共享同一节点池的两个或多个节点计算冲突的内核参数。在管理集群中创建
ConfigMap对象:$ oc --kubeconfig="$MGMT_KUBECONFIG" create -f tuned-hugepages.yaml
创建
NodePool清单 YAML 文件,自定义NodePool的升级类型,并引用您在spec.tuningConfig部分中创建的ConfigMap对象。创建NodePool清单,并使用hcpCLI 将其保存到名为hugepages-nodepool.yaml的文件中:NODEPOOL_NAME=hugepages-example INSTANCE_TYPE=m5.2xlarge NODEPOOL_REPLICAS=2 hcp create nodepool aws \ --cluster-name $CLUSTER_NAME \ --name $NODEPOOL_NAME \ --node-count $NODEPOOL_REPLICAS \ --instance-type $INSTANCE_TYPE \ --render > hugepages-nodepool.yaml在
hugepages-nodepool.yaml文件中,将.spec.management.upgradeType设置为InPlace,并将.spec.tuningConfig设置为引用您创建的tuned-hugepagesConfigMap对象。apiVersion: hypershift.openshift.io/v1alpha1 kind: NodePool metadata: name: hugepages-nodepool namespace: clusters ... spec: management: ... upgradeType: InPlace ... tuningConfig: - name: tuned-hugepages注意要避免应用新的
MachineConfig对象时不必要的重新创建节点,请将.spec.management.upgradeType设置为InPlace。如果使用Replace升级类型,则节点会被完全删除,当应用 TuneD 操作对象计算的新内核引导参数时,新节点可以替换它们。在管理集群中创建
NodePool:$ oc --kubeconfig="$MGMT_KUBECONFIG" create -f hugepages-nodepool.yaml
验证
节点可用后,容器化 TuneD 守护进程会根据应用的 TuneD 配置集计算所需的内核引导参数。在节点就绪并重新引导以应用生成的 MachineConfig 对象后,您可以验证是否已应用 TuneD 配置集,并且设置了内核引导参数。
列出托管的集群中的
Tuned对象:$ oc --kubeconfig="$HC_KUBECONFIG" get tuned.tuned.openshift.io -n openshift-cluster-node-tuning-operator
输出示例
NAME                 AGE
default              123m
hugepages-8dfb1fed   1m23s
rendered             123m
列出托管的集群中的
Profile对象:$ oc --kubeconfig="$HC_KUBECONFIG" get profile.tuned.openshift.io -n openshift-cluster-node-tuning-operator
输出示例
NAME                           TUNED                      APPLIED   DEGRADED   AGE
nodepool-1-worker-1            openshift-node             True      False      132m
nodepool-1-worker-2            openshift-node             True      False      131m
hugepages-nodepool-worker-1    openshift-node-hugepages   True      False      4m8s
hugepages-nodepool-worker-2    openshift-node-hugepages   True      False      3m57s
新
NodePool中的两个 worker 节点都应用了openshift-node-hugepages配置集。要确认正确应用了调整,请在节点上启动一个 debug shell 并检查
/proc/cmdline。$ oc --kubeconfig="$HC_KUBECONFIG" debug node/nodepool-1-worker-1 -- chroot /host cat /proc/cmdline
输出示例
BOOT_IMAGE=(hd0,gpt3)/ostree/rhcos-... hugepagesz=2M hugepages=50
其他资源
有关托管 control plane 的更多信息,请参阅托管 control plane。
第 5 章 使用 CPU Manager 和拓扑管理器
CPU Manager 管理 CPU 组并限制特定 CPU 的负载。
CPU Manager 对于有以下属性的负载有用:
- 需要尽可能多的 CPU 时间。
- 对处理器缓存丢失非常敏感。
- 低延迟网络应用程序。
- 需要与其他进程协调,并从共享一个处理器缓存中受益。
拓扑管理器(Topology Manager)从 CPU Manager、设备管理器和其他 Hint 提供者收集提示信息,以匹配相同非统一 内存访问(NUMA)节点上的所有 QoS 类的 pod 资源(如 CPU、SR-IOV VF 和其他设备资源)。
拓扑管理器使用收集来的提示信息中获得的拓扑信息,根据配置的 Topology Manager 策略以及请求的 Pod 资源,决定节点是否被节点接受或拒绝。
拓扑管理器对希望使用硬件加速器来支持对工作延迟有极高要求的操作及高吞吐并发计算的负载很有用。
要使用拓扑管理器,您必须使用 静态 策略配置 CPU Manager。
5.1. 设置 CPU Manager
流程
可选:标记节点:
# oc label node perf-node.example.com cpumanager=true
编辑启用 CPU Manager 的节点的
MachineConfigPool。在这个示例中,所有 worker 都启用了 CPU Manager:# oc edit machineconfigpool worker
为 worker 机器配置池添加标签:
metadata:
  creationTimestamp: 2020-xx-xxx
  generation: 3
  labels:
    custom-kubelet: cpumanager-enabled
创建
KubeletConfig,cpumanager-kubeletconfig.yaml,自定义资源 (CR) 。请参阅上一步中创建的标签,以便使用新的 kubelet 配置更新正确的节点。请参见MachineConfigPoolSelector部分:apiVersion: machineconfiguration.openshift.io/v1 kind: KubeletConfig metadata: name: cpumanager-enabled spec: machineConfigPoolSelector: matchLabels: custom-kubelet: cpumanager-enabled kubeletConfig: cpuManagerPolicy: static 1 cpuManagerReconcilePeriod: 5s 2创建动态 kubelet 配置:
# oc create -f cpumanager-kubeletconfig.yaml
这会在 kubelet 配置中添加 CPU Manager 功能,如果需要,Machine Config Operator(MCO)将重启节点。要启用 CPU Manager,则不需要重启。
检查合并的 kubelet 配置:
# oc get machineconfig 99-worker-XXXXXX-XXXXX-XXXX-XXXXX-kubelet -o json | grep ownerReference -A7
输出示例
       "ownerReferences": [
            {
                "apiVersion": "machineconfiguration.openshift.io/v1",
                "kind": "KubeletConfig",
                "name": "cpumanager-enabled",
                "uid": "7ed5616d-6b72-11e9-aae1-021e1ce18878"
            }
        ]
检查 worker 是否有更新的
kubelet.conf:# oc debug node/perf-node.example.com sh-4.2# cat /host/etc/kubernetes/kubelet.conf | grep cpuManager
输出示例
cpuManagerPolicy: static        1
cpuManagerReconcilePeriod: 5s   2
创建请求一个或多个内核的 pod。限制和请求都必须将其 CPU 值设置为一个整数。这是专用于此 pod 的内核数:
# cat cpumanager-pod.yaml
输出示例
apiVersion: v1
kind: Pod
metadata:
  generateName: cpumanager-
spec:
  securityContext:
    runAsNonRoot: true
    seccompProfile:
      type: RuntimeDefault
  containers:
  - name: cpumanager
    image: gcr.io/google_containers/pause:3.2
    resources:
      requests:
        cpu: 1
        memory: "1G"
      limits:
        cpu: 1
        memory: "1G"
    securityContext:
      allowPrivilegeEscalation: false
      capabilities:
        drop: [ALL]
  nodeSelector:
    cpumanager: "true"
创建 pod:
# oc create -f cpumanager-pod.yaml
确定为您标记的节点调度了 pod:
# oc describe pod cpumanager
输出示例
Name:               cpumanager-6cqz7
Namespace:          default
Priority:           0
PriorityClassName:  <none>
Node:  perf-node.example.com/xxx.xx.xx.xxx
...
 Limits:
      cpu:     1
      memory:  1G
    Requests:
      cpu:        1
      memory:     1G
...
QoS Class:       Guaranteed
Node-Selectors:  cpumanager=true
确认正确配置了
cgroups。获取pause进程的进程 ID(PID):# ├─init.scope │ └─1 /usr/lib/systemd/systemd --switched-root --system --deserialize 17 └─kubepods.slice ├─kubepods-pod69c01f8e_6b74_11e9_ac0f_0a2b62178a22.slice │ ├─crio-b5437308f1a574c542bdf08563b865c0345c8f8c0b0a655612c.scope │ └─32706 /pause
服务质量(QoS)等级为
Guaranteed的 pod 被放置到kubepods.slice中。其它 QoS 等级的 pod 会位于kubepods的子cgroups中:# cd /sys/fs/cgroup/cpuset/kubepods.slice/kubepods-pod69c01f8e_6b74_11e9_ac0f_0a2b62178a22.slice/crio-b5437308f1ad1a7db0574c542bdf08563b865c0345c86e9585f8c0b0a655612c.scope # for i in `ls cpuset.cpus tasks` ; do echo -n "$i "; cat $i ; done
输出示例
cpuset.cpus 1
tasks 32706
检查任务允许的 CPU 列表:
# grep ^Cpus_allowed_list /proc/32706/status
输出示例
Cpus_allowed_list: 1
确认系统中的另一个 pod(在这个示例中,QoS 等级为
burstable的 pod)不能在为等级为Guaranteed的 pod 分配的内核中运行:# cat /sys/fs/cgroup/cpuset/kubepods.slice/kubepods-besteffort.slice/kubepods-besteffort-podc494a073_6b77_11e9_98c0_06bba5c387ea.slice/crio-c56982f57b75a2420947f0afc6cafe7534c5734efc34157525fa9abbf99e3849.scope/cpuset.cpus 0 # oc describe node perf-node.example.com
输出示例
...
Capacity:
 attachable-volumes-aws-ebs:  39
 cpu:                         2
 ephemeral-storage:           124768236Ki
 hugepages-1Gi:               0
 hugepages-2Mi:               0
 memory:                      8162900Ki
 pods:                        250
Allocatable:
 attachable-volumes-aws-ebs:  39
 cpu:                         1500m
 ephemeral-storage:           124768236Ki
 hugepages-1Gi:               0
 hugepages-2Mi:               0
 memory:                      7548500Ki
 pods:                        250
-------                               ----                           ------------  ----------  ---------------  -------------  ---
  default                                 cpumanager-6cqz7               1 (66%)       1 (66%)     1G (12%)         1G (12%)       29m

Allocated resources:
  (Total limits may be over 100 percent, i.e., overcommitted.)
  Resource                    Requests          Limits
  --------                    --------          ------
  cpu                         1440m (96%)       1 (66%)
这个 VM 有两个 CPU 内核。
system-reserved设置保留 500 millicores,这代表一个内核中的一半被从节点的总容量中减小,以达到Node Allocatable的数量。您可以看到Allocatable CPU是 1500 毫秒。这意味着您可以运行一个 CPU Manager pod,因为每个 pod 需要一个完整的内核。一个完整的内核等于 1000 毫秒。如果您尝试调度第二个 pod,系统将接受该 pod,但不会调度它:NAME READY STATUS RESTARTS AGE cpumanager-6cqz7 1/1 Running 0 33m cpumanager-7qc2t 0/1 Pending 0 11s
5.2. 拓扑管理器策略
拓扑管理器通过从 Hint 提供者(如 CPU Manager 和设备管理器)收集拓扑提示来调整所有级别服务质量(QoS)的 Pod 资源,并使用收集的提示来匹配 Pod 资源。
拓扑管理器支持四个分配策略,这些策略在名为 cpumanager-enabled 的 KubeletConfig 自定义资源 (CR) 中分配:
none策略- 这是默认策略,不执行任何拓扑对齐调整。
best-effort策略-
对于带有
best-effort拓扑管理策略的 pod 中的每个容器,kubelet 会调用每个 Hint 提供者来发现其资源的可用性。使用这些信息,拓扑管理器会保存那个容器的首选 NUMA 节点关联性设置。如果关联性没有被首选设置,则拓扑管理器会保存这个设置,并把 pod 分配给节点。 restricted策略-
对于带有
restricted拓扑管理策略的 pod 中的每个容器,kubelet 会调用每个 Hint 提供者来发现其资源的可用性。使用这些信息,拓扑管理器会保存那个容器的首选 NUMA 节点关联性设置。如果关联性没有被首选,则拓扑管理器会从节点拒绝这个 pod,从而导致 pod 处于Terminated状态,且 pod 准入失败。 single-numa-node策略-
对于带有
single-numa-node拓扑管理策略的 pod 中的每个容器,kubelet 会调用每个 Hint 提供者来发现其资源的可用性。使用这个信息,拓扑管理器会决定单个 NUMA 节点关联性是否可能。如果是,pod 将会分配给该节点。如果无法使用单一 NUMA 节点关联性,则拓扑管理器会拒绝来自节点的 pod。这会导致 pod 处于 Terminated 状态,且 pod 准入失败。
5.3. 设置拓扑管理器
要使用拓扑管理器,您必须在名为 cpumanager-enabled 的 KubeletConfig 自定义资源 (CR) 中配置分配策略。如果您设置了 CPU Manager,则该文件可能会存在。如果这个文件不存在,您可以创建该文件。
先决条件
-
将 CPU Manager 策略配置为
static。
流程
激活拓扑管理器:
在自定义资源中配置拓扑管理器分配策略。
$ oc edit KubeletConfig cpumanager-enabled
apiVersion: machineconfiguration.openshift.io/v1
kind: KubeletConfig
metadata:
  name: cpumanager-enabled
spec:
  machineConfigPoolSelector:
    matchLabels:
      custom-kubelet: cpumanager-enabled
  kubeletConfig:
     cpuManagerPolicy: static 1
     cpuManagerReconcilePeriod: 5s
     topologyManagerPolicy: single-numa-node 2
5.4. Pod 与拓扑管理器策略的交互
以下的 Pod specs 示例演示了 Pod 与 Topology Manager 的交互。
因为没有指定资源请求或限制,以下 pod 以 BestEffort QoS 类运行。
spec:
  containers:
  - name: nginx
    image: nginx
因为请求小于限制,下一个 pod 以 Burstable QoS 类运行。
spec:
  containers:
  - name: nginx
    image: nginx
    resources:
      limits:
        memory: "200Mi"
      requests:
        memory: "100Mi"
如果所选策略不是 none,则拓扑管理器将不考虑其中任何一个 Pod 规格。
因为请求等于限制,最后一个 pod 以 Guaranteed QoS 类运行。
spec:
  containers:
  - name: nginx
    image: nginx
    resources:
      limits:
        memory: "200Mi"
        cpu: "2"
        example.com/device: "1"
      requests:
        memory: "200Mi"
        cpu: "2"
        example.com/device: "1"
拓扑管理器将考虑这个 pod。拓扑管理器会参考 CPU Manager 和设备管理器的 hint 供应商,以获取 pod 的拓扑提示。
拓扑管理器将使用此信息存储该容器的最佳拓扑。在本 pod 中,CPU Manager 和设备管理器将在资源分配阶段使用此存储的信息。
第 6 章 调度 NUMA 感知工作负载
了解 NUMA 感知调度以及如何使用它来在 OpenShift Container Platform 集群中部署高性能工作负载。
NUMA Resources Operator 允许您在相同的 NUMA 区域中调度高性能工作负载。它部署一个节点资源导出代理,该代理在可用的集群节点 NUMA 资源以及管理工作负载的辅助调度程序上报告。
6.1. 关于 NUMA 感知调度
非统一内存访问 (NUMA) 是一个计算平台架构,允许不同的 CPU 以不同速度访问不同区域。NUMA 资源拓扑引用与计算节点上相互相对的 CPU、内存和 PCI 设备的位置。在一起的资源表示在同一 NUMA 区域中。对于高性能应用程序,集群需要处理单个 NUMA 区域中的 pod 工作负载。
NUMA 架构允许有多个内存控制器的 CPU 在 CPU 复杂间使用任何可用内存,无论内存所处的位置。这可以以牺牲性能为代价来增加灵活性。使用位于 NUMA 区域以外的内存的 CPU 处理工作负载的速度比单个 NUMA 区域处理的工作负载要慢。另外,对于对 I/O 有限制的工作负载,在远程的 NUMA 区域中的网络接口会减慢访问应用程序的速度。高性能工作负载(如电信工作负载)无法在这些条件下达到操作要求。NUMA 感知调度会调整同一 NUMA 区域中请求的集群计算资源(CPU、内存、设备),以有效地处理对延迟敏感的工作负责或高性能工作负载。NUMA 感知调度还提高了每个计算节点的 pod 密度,以提高资源效率。
通过将 Node Tuning Operator 的性能配置集与 NUMA 感知调度集成,您可以进一步配置 CPU 关联性来优化对延迟敏感的工作负载的性能。
默认的 OpenShift Container Platform pod 调度程序调度逻辑考虑整个计算节点的可用资源,而不是单个 NUMA 区域。如果在 kubelet 拓扑管理器中请求最严格的资源协调,则会在将 pod 传递给节点时出现错误条件。相反,如果没有请求限制性最严格的资源协调,则 pod 可以在没有正确的资源协调的情况下被节点接受,从而导致性能更差或无法达到预期。例如,当 pod 调度程序通过不知道 pod 请求的资源可用而导致做出非最佳的调度决定时,pod 创建可能会出现 Topology Affinity Error 状态。调度不匹配决策可能会导致 pod 启动延迟。另外,根据集群状态和资源分配,pod 调度决策可能会因为启动失败而对集群造成额外的负载。
NUMA Resources Operator 部署了一个自定义 NUMA 资源辅助调度程序和其他资源,以缓解默认 OpenShift Container Platform pod 调度程序的缩写。下图显示了 NUMA 感知 pod 调度的高级概述。
图 6.1. NUMA 感知调度概述
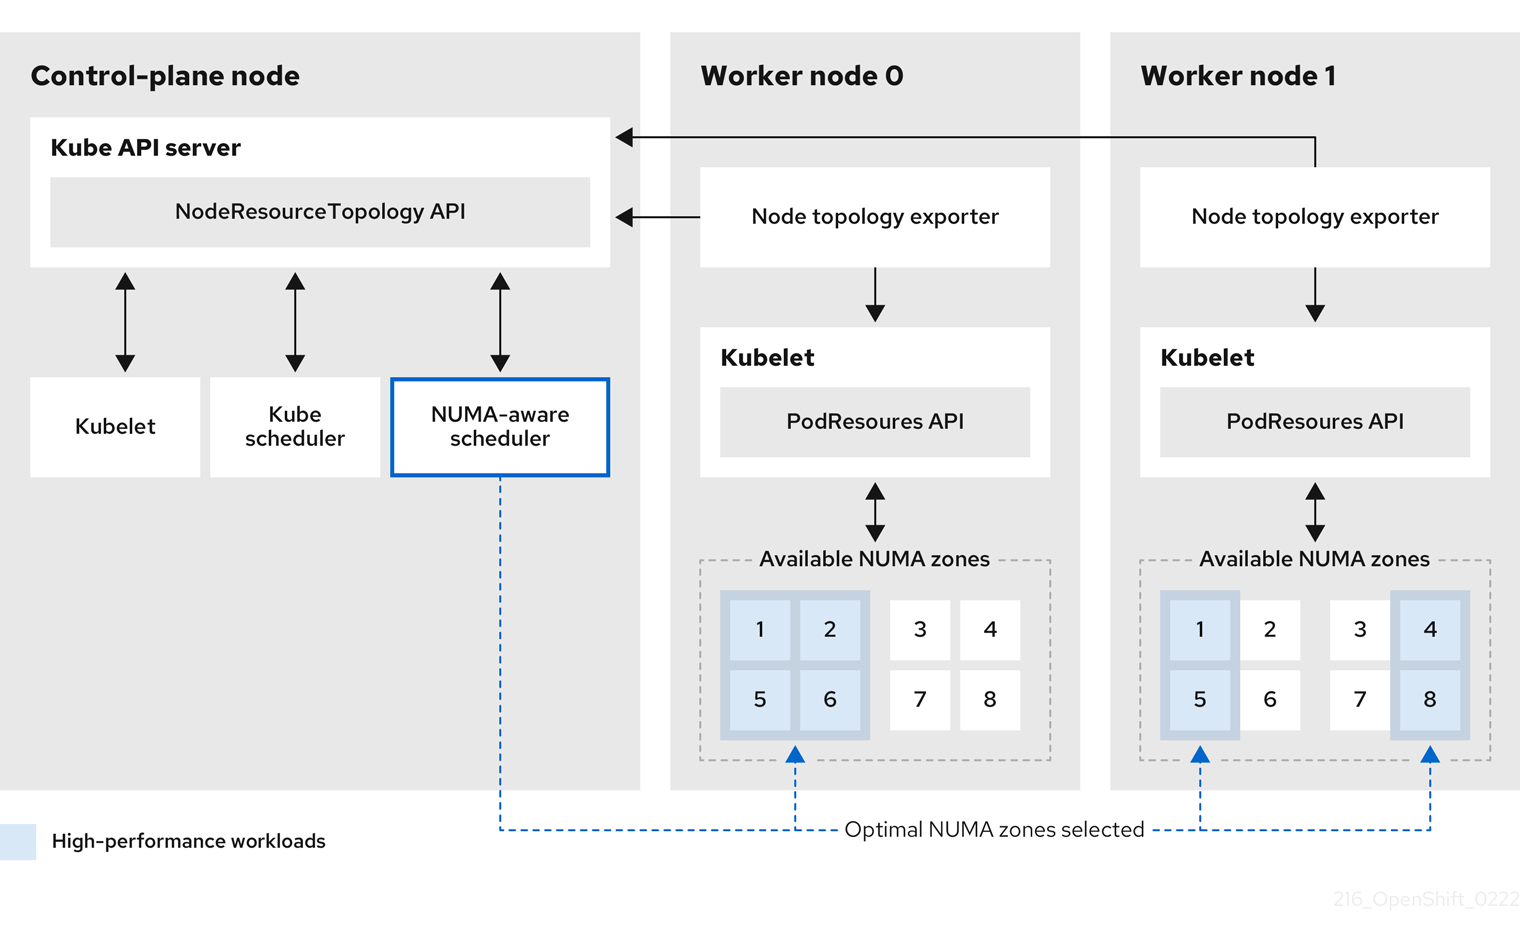
- NodeResourceTopology API
-
NodeResourceTopologyAPI 描述了每个计算节点上可用的 NUMA 区资源。 - NUMA 感知调度程序
-
NUMA 感知辅助调度程序从
NodeResourceTopologyAPI 接收有关可用 NUMA 区域的信息,并在可以最佳处理的节点上调度高性能工作负载。 - 节点拓扑 exporter
-
节点拓扑 exporter 会公开每个计算节点的可用 NUMA 区资源到
NodeResourceTopologyAPI。节点拓扑 exporter 守护进程使用PodResourcesAPI 跟踪来自 kubelet 的资源分配。 - PodResources API
对于每个节点,
PodResourcesAPI 是本地的,并向 kubelet 公开资源拓扑和可用资源。注意PodResourcesAPI 的List端点公开分配给特定容器的专用 CPU。API 不会公开属于共享池的 CPU。GetAllocatableResources端点公开节点上可用的可分配资源。
其他资源
- 有关在集群中运行二级 pod 调度程序以及如何使用二级 pod 调度程序部署 pod 的更多信息,请参阅使用二级调度程序调度 pod。
6.2. 安装 NUMA Resources Operator
NUMA Resources Operator 部署资源,供您调度 NUMA 感知工作负载和部署。您可以使用 OpenShift Container Platform CLI 或 Web 控制台安装 NUMA Resources Operator。
6.2.1. 使用 CLI 安装 NUMA Resources Operator
作为集群管理员,您可以使用 CLI 安装 Operator。
先决条件
-
安装 OpenShift CLI(
oc)。 -
以具有
cluster-admin特权的用户身份登录。
流程
为 NUMA Resources Operator 创建命名空间:
将以下 YAML 保存到
nro-namespace.yaml文件中:apiVersion: v1 kind: Namespace metadata: name: openshift-numaresources
运行以下命令来创建
NamespaceCR:$ oc create -f nro-namespace.yaml
为 NUMA Resources Operator 创建 operator 组:
在
nro-operatorgroup.yaml文件中保存以下 YAML:apiVersion: operators.coreos.com/v1 kind: OperatorGroup metadata: name: numaresources-operator namespace: openshift-numaresources spec: targetNamespaces: - openshift-numaresources
运行以下命令来创建
OperatorGroupCR:$ oc create -f nro-operatorgroup.yaml
为 NUMA Resources Operator 创建订阅:
将以下 YAML 保存到
nro-sub.yaml文件中:apiVersion: operators.coreos.com/v1alpha1 kind: Subscription metadata: name: numaresources-operator namespace: openshift-numaresources spec: channel: "4.15" name: numaresources-operator source: redhat-operators sourceNamespace: openshift-marketplace
运行以下命令来创建
SubscriptionCR:$ oc create -f nro-sub.yaml
验证
通过检查
openshift-numaresources命名空间中的 CSV 资源来验证安装是否成功。运行以下命令:$ oc get csv -n openshift-numaresources
输出示例
NAME                             DISPLAY                  VERSION   REPLACES   PHASE
numaresources-operator.v4.15.2   numaresources-operator   4.15.2               Succeeded
6.2.2. 使用 Web 控制台安装 NUMA Resources Operator
作为集群管理员,您可以使用 Web 控制台安装 NUMA Resources Operator。
流程
为 NUMA Resources Operator 创建命名空间:
- 在 OpenShift Container Platform web 控制台中,点 Administration → Namespaces。
-
点 Create Namespace,在 Name 字段中输入
openshift-numaresources,然后点 Create。
安装 NUMA Resources Operator:
- 在 OpenShift Container Platform Web 控制台中,点击 Operators → OperatorHub。
- 从可用的 Operator 列表中选择 NUMA Resources Operator,然后点 Install。
-
在 Installed Namespaces 字段中,选择
openshift-numaresources命名空间,然后点 Install。
可选:验证 NUMA Resources Operator 是否已成功安装:
- 切换到 Operators → Installed Operators 页面。
确保
openshift-numaresources命名空间中列出 NUMA Resources Operator,Status 为 InstallSucceeded。注意在安装过程中,Operator 可能会显示 Failed 状态。如果安装过程结束后有 InstallSucceeded 信息,您可以忽略这个 Failed 信息。
如果 Operator 没有被成功安装,请按照以下步骤进行故障排除:
- 进入 Operators → Installed Operators 页面,检查 Operator Subscriptions 和 Install Plans 选项卡中的 Status 项中是否有任何错误。
-
进入 Workloads → Pods 页面,检查
default项目中的 pod 的日志。
6.3. 调度 NUMA 感知工作负载
运行对延迟敏感工作负载的集群通常具有性能配置集,以帮助最小化工作负载延迟并优化性能。NUMA 感知调度程序根据可用的节点 NUMA 资源部署工作负载,并遵循应用到节点的任何性能配置集设置。NUMA 感知部署和工作负载的性能配置集相结合,确保以最大化性能的方式调度工作负载。
6.3.1. 创建 NUMAResourcesOperator 自定义资源
安装 NUMA Resources Operator 后,创建 NUMAResourcesOperator 自定义资源 (CR) 来指示 NUMA Resources Operator 安装支持 NUMA 感知调度程序所需的所有集群基础架构,包括守护进程集和 API。
先决条件
-
安装 OpenShift CLI(
oc)。 -
以具有
cluster-admin特权的用户身份登录。 - 安装 NUMA Resources Operator。
流程
创建
NUMAResourcesOperator自定义资源:将以下 YAML 保存到
nrop.yaml文件中:apiVersion: nodetopology.openshift.io/v1 kind: NUMAResourcesOperator metadata: name: numaresourcesoperator spec: nodeGroups: - machineConfigPoolSelector: matchLabels: pools.operator.machineconfiguration.openshift.io/worker: ""运行以下命令来创建
NUMAResourcesOperatorCR:$ oc create -f nrop.yaml
验证
运行以下命令,验证 NUMA Resources Operator 是否已成功部署:
$ oc get numaresourcesoperators.nodetopology.openshift.io
输出示例
NAME                    AGE
numaresourcesoperator   10m
6.3.2. 部署 NUMA 感知辅助 pod 调度程序
安装 NUMA Resources Operator 后,执行以下操作来部署 NUMA 感知辅助 pod 调度程序:
- 配置性能配置集。
- 部署 NUMA 感知辅助调度程序。
先决条件
-
安装 OpenShift CLI(
oc)。 -
以具有
cluster-admin特权的用户身份登录。 - 创建所需的机器配置池。
- 安装 NUMA Resources Operator。
流程
创建
PerformanceProfile自定义资源(CR):将以下 YAML 保存到
nro-perfprof.yaml文件中:apiVersion: performance.openshift.io/v2 kind: PerformanceProfile metadata: name: perfprof-nrop spec: cpu: 1 isolated: "4-51,56-103" reserved: "0,1,2,3,52,53,54,55" nodeSelector: node-role.kubernetes.io/worker: "" numa: topologyPolicy: single-numa-node- 1
cpu.isolated和cpu.reserved规格定义了隔离和保留 CPU 的范围。输入 CPU 配置的有效值。有关配置性能配置集的更多信息,请参阅附加资源部分。
运行以下命令来创建
PerformanceProfileCR:$ oc create -f nro-perfprof.yaml
输出示例
performanceprofile.performance.openshift.io/perfprof-nrop created
创建
NUMAResourcesScheduler自定义资源来部署 NUMA 感知自定义 pod 调度程序:将以下 YAML 保存到
nro-scheduler.yaml文件中:apiVersion: nodetopology.openshift.io/v1 kind: NUMAResourcesScheduler metadata: name: numaresourcesscheduler spec: imageSpec: "registry.redhat.io/openshift4/noderesourcetopology-scheduler-rhel9:v4.15" cacheResyncPeriod: "5s" 1- 1
- 为调度程序缓存同步输入间隔值(以秒为单位)。值
5s通常用于大多数实现。
注意-
启用
cacheResyncPeriod规格,以帮助 NUMA Resource Operator 通过监控节点上的待处理资源,并在调度程序缓存中同步此信息,以帮助 NUMA Resource Operator 报告更准确的资源可用性。这也有助于减少Topology Affinity Error错误,因为未优化调度决策。网络负载越低的时间间隔。cacheResyncPeriod规格默认禁用。 -
为
NUMAResourcesOperatorCR 中的podsFingerprinting规格设置Enabled值是cacheResyncPeriod规格的实施要求。
运行以下命令来创建
NUMAResourcesSchedulerCR:$ oc create -f nro-scheduler.yaml
验证
运行以下命令验证性能配置集是否已应用:
$ oc describe performanceprofile <performance-profile-name>
运行以下命令验证所需资源是否已成功部署:
$ oc get all -n openshift-numaresources
输出示例
NAME                                                    READY   STATUS    RESTARTS   AGE
pod/numaresources-controller-manager-7575848485-bns4s   1/1     Running   0          13m
pod/numaresourcesoperator-worker-dvj4n                  2/2     Running   0          16m
pod/numaresourcesoperator-worker-lcg4t                  2/2     Running   0          16m
pod/secondary-scheduler-56994cf6cf-7qf4q                1/1     Running   0          16m
NAME                                          DESIRED   CURRENT   READY   UP-TO-DATE   AVAILABLE   NODE SELECTOR                     AGE
daemonset.apps/numaresourcesoperator-worker   2         2         2       2            2           node-role.kubernetes.io/worker=   16m
NAME                                               READY   UP-TO-DATE   AVAILABLE   AGE
deployment.apps/numaresources-controller-manager   1/1     1            1           13m
deployment.apps/secondary-scheduler                1/1     1            1           16m
NAME                                                          DESIRED   CURRENT   READY   AGE
replicaset.apps/numaresources-controller-manager-7575848485   1         1         1       13m
replicaset.apps/secondary-scheduler-56994cf6cf                1         1         1       16m
其他资源
6.3.3. 使用 NUMA 感知调度程序调度工作负载
您可以使用 Deployment CR 将工作负载调度到 NUMA 感知调度程序,该 CR 指定处理工作负载的最低所需资源。
以下示例部署使用 NUMA 感知调度示例工作负载。
先决条件
-
安装 OpenShift CLI(
oc)。 -
以具有
cluster-admin特权的用户身份登录。 - 安装 NUMA Resources Operator 并部署 NUMA 感知辅助调度程序。
流程
运行以下命令,获取集群中部署的 NUMA 感知调度程序名称:
$ oc get numaresourcesschedulers.nodetopology.openshift.io numaresourcesscheduler -o json | jq '.status.schedulerName'
输出示例
topo-aware-scheduler
创建一个
DeploymentCR,它使用名为topo-aware-scheduler的调度程序,例如:将以下 YAML 保存到
nro-deployment.yaml文件中:apiVersion: apps/v1 kind: Deployment metadata: name: numa-deployment-1 namespace: openshift-numaresources spec: replicas: 1 selector: matchLabels: app: test template: metadata: labels: app: test spec: schedulerName: topo-aware-scheduler 1 containers: - name: ctnr image: quay.io/openshifttest/hello-openshift:openshift imagePullPolicy: IfNotPresent resources: limits: memory: "100Mi" cpu: "10" requests: memory: "100Mi" cpu: "10" - name: ctnr2 image: registry.access.redhat.com/rhel:latest imagePullPolicy: IfNotPresent command: ["/bin/sh", "-c"] args: [ "while true; do sleep 1h; done;" ] resources: limits: memory: "100Mi" cpu: "8" requests: memory: "100Mi" cpu: "8"- 1
schedulerName必须与集群中部署的 NUMA 感知调度程序的名称匹配,如topo-aware-scheduler。
运行以下命令来创建
DeploymentCR:$ oc create -f nro-deployment.yaml
验证
验证部署是否成功:
$ oc get pods -n openshift-numaresources
输出示例
NAME                                                READY   STATUS    RESTARTS   AGE
numa-deployment-1-56954b7b46-pfgw8                  2/2     Running   0          129m
numaresources-controller-manager-7575848485-bns4s   1/1     Running   0          15h
numaresourcesoperator-worker-dvj4n                  2/2     Running   0          18h
numaresourcesoperator-worker-lcg4t                  2/2     Running   0          16h
secondary-scheduler-56994cf6cf-7qf4q                1/1     Running   0          18h
运行以下命令,验证
topo-aware-scheduler是否在调度部署的 pod:$ oc describe pod numa-deployment-1-56954b7b46-pfgw8 -n openshift-numaresources
输出示例
Events:
  Type    Reason          Age   From                  Message
  ----    ------          ----  ----                  -------
  Normal  Scheduled       130m  topo-aware-scheduler  Successfully assigned openshift-numaresources/numa-deployment-1-56954b7b46-pfgw8 to compute-0.example.com
注意请求的资源超过可用于调度的部署将失败,并显示
MinimumReplicasUnavailable错误。当所需资源可用时,部署会成功。Pod 会一直处于Pending状态,直到所需资源可用。验证是否为节点列出了预期的分配资源。
运行以下命令识别运行部署 pod 的节点,将 <namespace> 替换为您在
DeploymentCR 中指定的命名空间:$ oc get pods -n <namespace> -o wide
输出示例
NAME                                 READY   STATUS    RESTARTS   AGE   IP            NODE     NOMINATED NODE   READINESS GATES
numa-deployment-1-65684f8fcc-bw4bw   0/2     Running   0          82m   10.128.2.50   worker-0   <none>  <none>
运行以下命令,将 <node_name> 替换为运行部署 pod 的该节点的名称。
$ oc describe noderesourcetopologies.topology.node.k8s.io <node_name>
输出示例
... Zones: Costs: Name: node-0 Value: 10 Name: node-1 Value: 21 Name: node-0 Resources: Allocatable: 39 Available: 21 1 Capacity: 40 Name: cpu Allocatable: 6442450944 Available: 6442450944 Capacity: 6442450944 Name: hugepages-1Gi Allocatable: 134217728 Available: 134217728 Capacity: 134217728 Name: hugepages-2Mi Allocatable: 262415904768 Available: 262206189568 Capacity: 270146007040 Name: memory Type: Node- 1
- 由于已分配给有保证 pod 的资源,
可用的容量会减少。
通过保证 pod 使用的资源从
noderesourcetopologies.topology.node.k8s.io中列出的可用节点资源中减去。
对具有
Best-effort或Burstable服务质量 (qosClass) 的pod 的资源分配不会反映在noderesourcetopologies.topology.node.k8s.io下的 NUMA 节点资源中。如果 pod 消耗的资源没有反映在节点资源计算中,请验证 pod 的Guaranteed具有qosClass,且 CPU 请求是一个整数值,而不是十进制值。您可以运行以下命令来验证 pod 是否具有Guaranteed的qosClass:$ oc get pod <pod_name> -n <pod_namespace> -o jsonpath="{ .status.qosClass }"输出示例
Guaranteed
6.4. 使用手动性能设置调度 NUMA 感知工作负载
运行对延迟敏感工作负载的集群通常具有性能配置集,以帮助最小化工作负载延迟并优化性能。但是,您可以在不功能性能配置集的 pristine 集群中调度 NUMA 感知工作负载。以下工作流带有一个 pristine 集群,您可以使用 KubeletConfig 资源手动配置性能。这不是调度 NUMA 感知工作负载的典型环境。
6.4.1. 使用手动性能设置创建 NUMAResourcesOperator 自定义资源
安装 NUMA Resources Operator 后,创建 NUMAResourcesOperator 自定义资源 (CR) 来指示 NUMA Resources Operator 安装支持 NUMA 感知调度程序所需的所有集群基础架构,包括守护进程集和 API。
先决条件
-
安装 OpenShift CLI(
oc)。 -
以具有
cluster-admin特权的用户身份登录。 - 安装 NUMA Resources Operator。
流程
可选:创建
MachineConfigPool自定义资源,为 worker 节点启用自定义 kubelet 配置:注意默认情况下,OpenShift Container Platform 为集群中的 worker 节点创建一个
MachineConfigPool资源。如果需要,您可以创建自定义MachineConfigPool资源。将以下 YAML 保存到
nro-machineconfig.yaml文件中:apiVersion: machineconfiguration.openshift.io/v1 kind: MachineConfigPool metadata: labels: cnf-worker-tuning: enabled machineconfiguration.openshift.io/mco-built-in: "" pools.operator.machineconfiguration.openshift.io/worker: "" name: worker spec: machineConfigSelector: matchLabels: machineconfiguration.openshift.io/role: worker nodeSelector: matchLabels: node-role.kubernetes.io/worker: ""运行以下命令来创建
MachineConfigPoolCR:$ oc create -f nro-machineconfig.yaml
创建
NUMAResourcesOperator自定义资源:将以下 YAML 保存到
nrop.yaml文件中:apiVersion: nodetopology.openshift.io/v1 kind: NUMAResourcesOperator metadata: name: numaresourcesoperator spec: nodeGroups: - machineConfigPoolSelector: matchLabels: pools.operator.machineconfiguration.openshift.io/worker: "" 1- 1
- 应该与相关
MachineConfigPoolCR 中的 worker 节点匹配。
运行以下命令来创建
NUMAResourcesOperatorCR:$ oc create -f nrop.yaml
验证
运行以下命令,验证 NUMA Resources Operator 是否已成功部署:
$ oc get numaresourcesoperators.nodetopology.openshift.io
输出示例
NAME                    AGE
numaresourcesoperator   10m
6.4.2. 使用手动性能设置部署 NUMA 感知辅助 pod 调度程序
安装 NUMA Resources Operator 后,执行以下操作来部署 NUMA 感知辅助 pod 调度程序:
- 为所需机器配置集配置 pod admittance 策略
- 创建所需的机器配置池
- 部署 NUMA 感知二级调度程序
先决条件
-
安装 OpenShift CLI(
oc)。 -
以具有
cluster-admin特权的用户身份登录。 - 安装 NUMA Resources Operator。
流程
创建
KubeletConfig自定义资源,为机器配置集配置 pod admittance 策略:将以下 YAML 保存到
nro-kubeletconfig.yaml文件中:apiVersion: machineconfiguration.openshift.io/v1 kind: KubeletConfig metadata: name: cnf-worker-tuning spec: machineConfigPoolSelector: matchLabels: cnf-worker-tuning: enabled kubeletConfig: cpuManagerPolicy: "static" 1 cpuManagerReconcilePeriod: "5s" reservedSystemCPUs: "0,1" memoryManagerPolicy: "Static" 2 evictionHard: memory.available: "100Mi" reservedMemory: - numaNode: 0 limits: memory: "1124Mi" systemReserved: memory: "512Mi" topologyManagerPolicy: "single-numa-node" 3 topologyManagerScope: "pod"运行以下命令来创建
KubeletConfig自定义资源 (CR):$ oc create -f nro-kubeletconfig.yaml
创建
NUMAResourcesScheduler自定义资源来部署 NUMA 感知自定义 pod 调度程序:将以下 YAML 保存到
nro-scheduler.yaml文件中:apiVersion: nodetopology.openshift.io/v1 kind: NUMAResourcesScheduler metadata: name: numaresourcesscheduler spec: imageSpec: "registry.redhat.io/openshift4/noderesourcetopology-scheduler-container-rhel8:v4.15" cacheResyncPeriod: "5s" 1- 1
- 为调度程序缓存同步输入间隔值(以秒为单位)。值
5s通常用于大多数实现。
注意-
启用
cacheResyncPeriod规格,以帮助 NUMA Resource Operator 通过监控节点上的待处理资源,并在调度程序缓存中同步此信息,以帮助 NUMA Resource Operator 报告更准确的资源可用性。这也有助于减少Topology Affinity Error错误,因为未优化调度决策。网络负载越低的时间间隔。cacheResyncPeriod规格默认禁用。 -
为
NUMAResourcesOperatorCR 中的podsFingerprinting规格设置Enabled值是cacheResyncPeriod规格的实施要求。
运行以下命令来创建
NUMAResourcesSchedulerCR:$ oc create -f nro-scheduler.yaml
验证
运行以下命令验证所需资源是否已成功部署:
$ oc get all -n openshift-numaresources
输出示例
NAME                                                    READY   STATUS    RESTARTS   AGE
pod/numaresources-controller-manager-7575848485-bns4s   1/1     Running   0          13m
pod/numaresourcesoperator-worker-dvj4n                  2/2     Running   0          16m
pod/numaresourcesoperator-worker-lcg4t                  2/2     Running   0          16m
pod/secondary-scheduler-56994cf6cf-7qf4q                1/1     Running   0          16m
NAME                                          DESIRED   CURRENT   READY   UP-TO-DATE   AVAILABLE   NODE SELECTOR                     AGE
daemonset.apps/numaresourcesoperator-worker   2         2         2       2            2           node-role.kubernetes.io/worker=   16m
NAME                                               READY   UP-TO-DATE   AVAILABLE   AGE
deployment.apps/numaresources-controller-manager   1/1     1            1           13m
deployment.apps/secondary-scheduler                1/1     1            1           16m
NAME                                                          DESIRED   CURRENT   READY   AGE
replicaset.apps/numaresources-controller-manager-7575848485   1         1         1       13m
replicaset.apps/secondary-scheduler-56994cf6cf                1         1         1       16m
6.4.3. 使用手动性能设置使用 NUMA 感知调度程序调度工作负载
您可以使用 Deployment CR 将工作负载调度到 NUMA 感知调度程序,该 CR 指定处理工作负载的最低所需资源。
以下示例部署使用 NUMA 感知调度示例工作负载。
先决条件
-
安装 OpenShift CLI(
oc)。 -
以具有
cluster-admin特权的用户身份登录。 - 安装 NUMA Resources Operator 并部署 NUMA 感知辅助调度程序。
流程
运行以下命令,获取集群中部署的 NUMA 感知调度程序名称:
$ oc get numaresourcesschedulers.nodetopology.openshift.io numaresourcesscheduler -o json | jq '.status.schedulerName'
输出示例
topo-aware-scheduler
创建一个
DeploymentCR,它使用名为topo-aware-scheduler的调度程序,例如:将以下 YAML 保存到
nro-deployment.yaml文件中:apiVersion: apps/v1 kind: Deployment metadata: name: numa-deployment-1 namespace: openshift-numaresources spec: replicas: 1 selector: matchLabels: app: test template: metadata: labels: app: test spec: schedulerName: topo-aware-scheduler 1 containers: - name: ctnr image: quay.io/openshifttest/hello-openshift:openshift imagePullPolicy: IfNotPresent resources: limits: memory: "100Mi" cpu: "10" requests: memory: "100Mi" cpu: "10" - name: ctnr2 image: registry.access.redhat.com/rhel:latest imagePullPolicy: IfNotPresent command: ["/bin/sh", "-c"] args: [ "while true; do sleep 1h; done;" ] resources: limits: memory: "100Mi" cpu: "8" requests: memory: "100Mi" cpu: "8"- 1
schedulerName必须与集群中部署的 NUMA 感知调度程序的名称匹配,如topo-aware-scheduler。
运行以下命令来创建
DeploymentCR:$ oc create -f nro-deployment.yaml
验证
验证部署是否成功:
$ oc get pods -n openshift-numaresources
输出示例
NAME                                                READY   STATUS    RESTARTS   AGE
numa-deployment-1-56954b7b46-pfgw8                  2/2     Running   0          129m
numaresources-controller-manager-7575848485-bns4s   1/1     Running   0          15h
numaresourcesoperator-worker-dvj4n                  2/2     Running   0          18h
numaresourcesoperator-worker-lcg4t                  2/2     Running   0          16h
secondary-scheduler-56994cf6cf-7qf4q                1/1     Running   0          18h
运行以下命令,验证
topo-aware-scheduler是否在调度部署的 pod:$ oc describe pod numa-deployment-1-56954b7b46-pfgw8 -n openshift-numaresources
输出示例
Events:
  Type    Reason          Age   From                  Message
  ----    ------          ----  ----                  -------
  Normal  Scheduled       130m  topo-aware-scheduler  Successfully assigned openshift-numaresources/numa-deployment-1-56954b7b46-pfgw8 to compute-0.example.com
注意请求的资源超过可用于调度的部署将失败,并显示
MinimumReplicasUnavailable错误。当所需资源可用时,部署会成功。Pod 会一直处于Pending状态,直到所需资源可用。验证是否为节点列出了预期的分配资源。
运行以下命令识别运行部署 pod 的节点,将 <namespace> 替换为您在
DeploymentCR 中指定的命名空间:$ oc get pods -n <namespace> -o wide
输出示例
NAME                                 READY   STATUS    RESTARTS   AGE   IP            NODE     NOMINATED NODE   READINESS GATES
numa-deployment-1-65684f8fcc-bw4bw   0/2     Running   0          82m   10.128.2.50   worker-0   <none>  <none>
运行以下命令,将 <node_name> 替换为运行部署 pod 的该节点的名称:
$ oc describe noderesourcetopologies.topology.node.k8s.io <node_name>
输出示例
... Zones: Costs: Name: node-0 Value: 10 Name: node-1 Value: 21 Name: node-0 Resources: Allocatable: 39 Available: 21 1 Capacity: 40 Name: cpu Allocatable: 6442450944 Available: 6442450944 Capacity: 6442450944 Name: hugepages-1Gi Allocatable: 134217728 Available: 134217728 Capacity: 134217728 Name: hugepages-2Mi Allocatable: 262415904768 Available: 262206189568 Capacity: 270146007040 Name: memory Type: Node- 1
- 由于已分配给有保证 pod 的资源,
可用的容量会减少。
通过保证 pod 使用的资源从
noderesourcetopologies.topology.node.k8s.io中列出的可用节点资源中减去。
对具有
Best-effort或Burstable服务质量 (qosClass) 的pod 的资源分配不会反映在noderesourcetopologies.topology.node.k8s.io下的 NUMA 节点资源中。如果 pod 消耗的资源没有反映在节点资源计算中,请验证 pod 的Guaranteed具有qosClass,且 CPU 请求是一个整数值,而不是十进制值。您可以运行以下命令来验证 pod 是否具有Guaranteed的qosClass:$ oc get pod <pod_name> -n <pod_namespace> -o jsonpath="{ .status.qosClass }"输出示例
Guaranteed
6.5. 可选:为 NUMA 资源更新配置轮询操作
由 NUMA Resources Operator 控制的守护进程在其 nodeGroup 轮询资源以检索有关可用 NUMA 资源的更新。您可以通过在 NUMAResourcesOperator 自定义资源 (CR) 中配置 spec.nodeGroups 规格来微调这些守护进程的轮询操作。这提供了对轮询操作的高级控制。配置这些规格,以改进调度行为,并对子优化调度决策进行故障排除。
配置选项如下:
-
infoRefreshMode:确定轮询 kubelet 的触发器条件。NUMA Resources Operator 向 API 服务器报告生成的信息。 -
infoRefreshPeriod:确定轮询更新之间的持续时间。 podsFingerprinting: 确定节点上当前运行的当前 pod 集合的时间点信息是否公开,以轮询更新。注意podsFingerprinting默认启用。podsFingerprinting是NUMAResourcesSchedulerCR 中的cacheResyncPeriod规格的要求。cacheResyncPeriod规格有助于通过监控节点上的待处理资源来报告更准确的资源可用性。
先决条件
-
安装 OpenShift CLI(
oc)。 -
以具有
cluster-admin特权的用户身份登录。 - 安装 NUMA Resources Operator。
流程
在
NUMAResourcesOperatorCR 中配置spec.nodeGroups规格:apiVersion: nodetopology.openshift.io/v1 kind: NUMAResourcesOperator metadata: name: numaresourcesoperator spec: nodeGroups: - config: infoRefreshMode: Periodic 1 infoRefreshPeriod: 10s 2 podsFingerprinting: Enabled 3 name: worker- 1
- 有效值为
Periodic、Event、PeriodicAndEvents。使用Periodic根据您在infoRefreshPeriod中定义的间隔轮询 kubelet。使用Events在每个 pod 生命周期事件时轮询 kubelet。使用PeriodicAndEvents启用这两种方法。 - 2
- 为
Periodic或PeriodicAndEvents刷新模式定义轮询间隔。如果刷新模式是Events,则忽略该字段。 - 3
- 有效值为
Enabled或Disabled。设置为Enabled是NUMAResourcesScheduler中cacheResyncPeriod规格的要求。
验证
部署 NUMA Resources Operator 后,运行以下命令来验证节点组配置是否已应用:
$ oc get numaresop numaresourcesoperator -o json | jq '.status'
输出示例
      ...

        "config": {
        "infoRefreshMode": "Periodic",
        "infoRefreshPeriod": "10s",
        "podsFingerprinting": "Enabled"
      },
      "name": "worker"

      ...
6.6. 对 NUMA 感知调度进行故障排除
要排除 NUMA 感知 pod 调度的常见问题,请执行以下步骤。
先决条件
-
安装 OpenShift Container Platform CLI(
oc)。 - 以具有 cluster-admin 权限的用户身份登录。
- 安装 NUMA Resources Operator 并部署 NUMA 感知辅助调度程序。
流程
运行以下命令,验证
noderesourcetopologiesCRD 是否已在集群中部署:$ oc get crd | grep noderesourcetopologies
输出示例
NAME                                                              CREATED AT
noderesourcetopologies.topology.node.k8s.io                       2022-01-18T08:28:06Z
运行以下命令,检查 NUMA-aware 调度程序名称是否与 NUMA 感知工作负载中指定的名称匹配:
$ oc get numaresourcesschedulers.nodetopology.openshift.io numaresourcesscheduler -o json | jq '.status.schedulerName'
输出示例
topo-aware-scheduler
验证 NUMA-aware scheduable 节点是否应用了
noderesourcetopologiesCR。运行以下命令:$ oc get noderesourcetopologies.topology.node.k8s.io
输出示例
NAME                    AGE
compute-0.example.com   17h
compute-1.example.com   17h
注意节点数应该等于机器配置池 (
mcp) worker 定义中配置的 worker 节点数量。运行以下命令,验证所有 scheduable 节点的 NUMA 区粒度:
$ oc get noderesourcetopologies.topology.node.k8s.io -o yaml
输出示例
apiVersion: v1
items:
- apiVersion: topology.node.k8s.io/v1
  kind: NodeResourceTopology
  metadata:
    annotations:
      k8stopoawareschedwg/rte-update: periodic
    creationTimestamp: "2022-06-16T08:55:38Z"
    generation: 63760
    name: worker-0
    resourceVersion: "8450223"
    uid: 8b77be46-08c0-4074-927b-d49361471590
  topologyPolicies:
  - SingleNUMANodeContainerLevel
  zones:
  - costs:
    - name: node-0
      value: 10
    - name: node-1
      value: 21
    name: node-0
    resources:
    - allocatable: "38"
      available: "38"
      capacity: "40"
      name: cpu
    - allocatable: "134217728"
      available: "134217728"
      capacity: "134217728"
      name: hugepages-2Mi
    - allocatable: "262352048128"
      available: "262352048128"
      capacity: "270107316224"
      name: memory
    - allocatable: "6442450944"
      available: "6442450944"
      capacity: "6442450944"
      name: hugepages-1Gi
    type: Node
  - costs:
    - name: node-0
      value: 21
    - name: node-1
      value: 10
    name: node-1
    resources:
    - allocatable: "268435456"
      available: "268435456"
      capacity: "268435456"
      name: hugepages-2Mi
    - allocatable: "269231067136"
      available: "269231067136"
      capacity: "270573244416"
      name: memory
    - allocatable: "40"
      available: "40"
      capacity: "40"
      name: cpu
    - allocatable: "1073741824"
      available: "1073741824"
      capacity: "1073741824"
      name: hugepages-1Gi
    type: Node
- apiVersion: topology.node.k8s.io/v1
  kind: NodeResourceTopology
  metadata:
    annotations:
      k8stopoawareschedwg/rte-update: periodic
    creationTimestamp: "2022-06-16T08:55:37Z"
    generation: 62061
    name: worker-1
    resourceVersion: "8450129"
    uid: e8659390-6f8d-4e67-9a51-1ea34bba1cc3
  topologyPolicies:
  - SingleNUMANodeContainerLevel
  zones: 1
  - costs:
    - name: node-0
      value: 10
    - name: node-1
      value: 21
    name: node-0
    resources: 2
    - allocatable: "38"
      available: "38"
      capacity: "40"
      name: cpu
    - allocatable: "6442450944"
      available: "6442450944"
      capacity: "6442450944"
      name: hugepages-1Gi
    - allocatable: "134217728"
      available: "134217728"
      capacity: "134217728"
      name: hugepages-2Mi
    - allocatable: "262391033856"
      available: "262391033856"
      capacity: "270146301952"
      name: memory
    type: Node
  - costs:
    - name: node-0
      value: 21
    - name: node-1
      value: 10
    name: node-1
    resources:
    - allocatable: "40"
      available: "40"
      capacity: "40"
      name: cpu
    - allocatable: "1073741824"
      available: "1073741824"
      capacity: "1073741824"
      name: hugepages-1Gi
    - allocatable: "268435456"
      available: "268435456"
      capacity: "268435456"
      name: hugepages-2Mi
    - allocatable: "269192085504"
      available: "269192085504"
      capacity: "270534262784"
      name: memory
    type: Node
kind: List
metadata:
  resourceVersion: ""
  selfLink: ""
6.6.1. 检查 NUMA 感知调度程序日志
通过查看日志来排除 NUMA 感知调度程序的问题。如果需要,可以通过修改 NUMAResourcesScheduler 资源的 spec.logLevel 字段来增加调度程序日志级别。可接受值为 Normal、Debug 和 Trace,其中 Trace 是最详细的选项。
要更改辅助调度程序的日志级别,请删除正在运行的调度程序资源,并使用更改后的日志级别重新部署它。在此停机期间,调度程序无法调度新的工作负载。
先决条件
-
安装 OpenShift CLI(
oc)。 -
以具有
cluster-admin特权的用户身份登录。
流程
删除当前运行的
NUMAResourcesScheduler资源:运行以下命令来获取活跃的
NUMAResourcesScheduler:$ oc get NUMAResourcesScheduler
输出示例
NAME                     AGE
numaresourcesscheduler   90m
运行以下命令来删除二级调度程序资源:
$ oc delete NUMAResourcesScheduler numaresourcesscheduler
输出示例
numaresourcesscheduler.nodetopology.openshift.io "numaresourcesscheduler" deleted
将以下 YAML 保存到文件
nro-scheduler-debug.yaml中。本例将日志级别更改为Debug:apiVersion: nodetopology.openshift.io/v1 kind: NUMAResourcesScheduler metadata: name: numaresourcesscheduler spec: imageSpec: "registry.redhat.io/openshift4/noderesourcetopology-scheduler-container-rhel8:v4.15" logLevel: Debug
运行以下命令,创建更新的
DebugloggingNUMAResourcesScheduler资源:$ oc create -f nro-scheduler-debug.yaml
输出示例
numaresourcesscheduler.nodetopology.openshift.io/numaresourcesscheduler created
验证步骤
检查 NUMA-aware 调度程序是否已成功部署:
运行以下命令检查 CRD 是否已创建成功:
$ oc get crd | grep numaresourcesschedulers
输出示例
NAME                                                              CREATED AT
numaresourcesschedulers.nodetopology.openshift.io                 2022-02-25T11:57:03Z
运行以下命令,检查新的自定义调度程序是否可用:
$ oc get numaresourcesschedulers.nodetopology.openshift.io
输出示例
NAME                     AGE
numaresourcesscheduler   3h26m
检查调度程序的日志是否显示增加的日志级别:
运行以下命令,获取在
openshift-numaresources命名空间中运行的 pod 列表:$ oc get pods -n openshift-numaresources
输出示例
NAME                                               READY   STATUS    RESTARTS   AGE
numaresources-controller-manager-d87d79587-76mrm   1/1     Running   0          46h
numaresourcesoperator-worker-5wm2k                 2/2     Running   0          45h
numaresourcesoperator-worker-pb75c                 2/2     Running   0          45h
secondary-scheduler-7976c4d466-qm4sc               1/1     Running   0          21m
运行以下命令,获取二级调度程序 pod 的日志:
$ oc logs secondary-scheduler-7976c4d466-qm4sc -n openshift-numaresources
输出示例
...
I0223 11:04:55.614788       1 reflector.go:535] k8s.io/client-go/informers/factory.go:134: Watch close - *v1.Namespace total 11 items received
I0223 11:04:56.609114       1 reflector.go:535] k8s.io/client-go/informers/factory.go:134: Watch close - *v1.ReplicationController total 10 items received
I0223 11:05:22.626818       1 reflector.go:535] k8s.io/client-go/informers/factory.go:134: Watch close - *v1.StorageClass total 7 items received
I0223 11:05:31.610356       1 reflector.go:535] k8s.io/client-go/informers/factory.go:134: Watch close - *v1.PodDisruptionBudget total 7 items received
I0223 11:05:31.713032       1 eventhandlers.go:186] "Add event for scheduled pod" pod="openshift-marketplace/certified-operators-thtvq"
I0223 11:05:53.461016       1 eventhandlers.go:244] "Delete event for scheduled pod" pod="openshift-marketplace/certified-operators-thtvq"
6.6.2. 对资源拓扑 exporter 进行故障排除
通过检查对应的 resource-topology-exporter 日志,对发生意外结果的 noderesourcetopologlogies 对象进行故障排除。
建议为它们引用的节点命名 NUMA 资源拓扑导出器实例。例如,名为 worker 的 worker 节点应具有对应的 noderesourcetopologies 对象,称为 worker。
先决条件
-
安装 OpenShift CLI(
oc)。 -
以具有
cluster-admin特权的用户身份登录。
流程
获取由 NUMA Resources Operator 管理的守护进程集(daemonset)。每个守护进程在
NUMAResourcesOperatorCR 中有一个对应的nodeGroup。运行以下命令:$ oc get numaresourcesoperators.nodetopology.openshift.io numaresourcesoperator -o jsonpath="{.status.daemonsets[0]}"输出示例
{"name":"numaresourcesoperator-worker","namespace":"openshift-numaresources"}使用上一步中的
name值获取所需的守护进程集的标签:$ oc get ds -n openshift-numaresources numaresourcesoperator-worker -o jsonpath="{.spec.selector.matchLabels}"输出示例
{"name":"resource-topology"}运行以下命令,使用
resource-topology标签获取 pod:$ oc get pods -n openshift-numaresources -l name=resource-topology -o wide
输出示例
NAME                                 READY   STATUS    RESTARTS   AGE    IP            NODE
numaresourcesoperator-worker-5wm2k   2/2     Running   0          2d1h   10.135.0.64   compute-0.example.com
numaresourcesoperator-worker-pb75c   2/2     Running   0          2d1h   10.132.2.33   compute-1.example.com
检查与您要故障排除的节点对应的 worker pod 上运行的
resource-topology-exporter容器的日志。运行以下命令:$ oc logs -n openshift-numaresources -c resource-topology-exporter numaresourcesoperator-worker-pb75c
输出示例
I0221 13:38:18.334140       1 main.go:206] using sysinfo:
reservedCpus: 0,1
reservedMemory:
  "0": 1178599424
I0221 13:38:18.334370       1 main.go:67] === System information ===
I0221 13:38:18.334381       1 sysinfo.go:231] cpus: reserved "0-1"
I0221 13:38:18.334493       1 sysinfo.go:237] cpus: online "0-103"
I0221 13:38:18.546750       1 main.go:72]
cpus: allocatable "2-103"
hugepages-1Gi:
  numa cell 0 -> 6
  numa cell 1 -> 1
hugepages-2Mi:
  numa cell 0 -> 64
  numa cell 1 -> 128
memory:
  numa cell 0 -> 45758Mi
  numa cell 1 -> 48372Mi
6.6.3. 更正缺少的资源拓扑 exporter 配置映射
如果您在配置了集群设置的集群中安装 NUMA Resources Operator,在有些情况下,Operator 会显示为 active,但资源拓扑 exporter (RTE) 守护进程集 pod 的日志显示 RTE 的配置缺失,例如:
Info: couldn't find configuration in "/etc/resource-topology-exporter/config.yaml"
此日志消息显示集群中未正确应用带有所需配置的 kubeletconfig,从而导致缺少 RTE configmap。例如,以下集群缺少 numaresourcesoperator-worker configmap 自定义资源 (CR):
$ oc get configmap
输出示例
NAME                           DATA   AGE
0e2a6bd3.openshift-kni.io      0      6d21h
kube-root-ca.crt               1      6d21h
openshift-service-ca.crt       1      6d21h
topo-aware-scheduler-config    1      6d18h
在正确配置的集群中,oc get configmap 也会返回一个 numaresourcesoperator-worker configmap CR。
先决条件
-
安装 OpenShift Container Platform CLI(
oc)。 - 以具有 cluster-admin 权限的用户身份登录。
- 安装 NUMA Resources Operator 并部署 NUMA 感知辅助调度程序。
流程
使用以下命令,比较
kubeletconfig中的spec.machineConfigPoolSelector.matchLabels值和MachineConfigPool(mcp) worker CR 中的metadata.labels的值:运行以下命令来检查
kubeletconfig标签:$ oc get kubeletconfig -o yaml
输出示例
machineConfigPoolSelector:
  matchLabels:
    cnf-worker-tuning: enabled
运行以下命令来检查
mcp标签:$ oc get mcp worker -o yaml
输出示例
labels:
  machineconfiguration.openshift.io/mco-built-in: ""
  pools.operator.machineconfiguration.openshift.io/worker: ""
cnf-worker-tuning: enabled标签没有存在于MachineConfigPool对象中。
编辑
MachineConfigPoolCR 使其包含缺少的标签,例如:$ oc edit mcp worker -o yaml
输出示例
labels:
  machineconfiguration.openshift.io/mco-built-in: ""
  pools.operator.machineconfiguration.openshift.io/worker: ""
  cnf-worker-tuning: enabled
- 应用标签更改并等待集群应用更新的配置。运行以下命令:
验证
检查是否应用了缺少的
numaresourcesoperator-workerconfigmapCR:$ oc get configmap
输出示例
NAME                           DATA   AGE
0e2a6bd3.openshift-kni.io      0      6d21h
kube-root-ca.crt               1      6d21h
numaresourcesoperator-worker   1      5m
openshift-service-ca.crt       1      6d21h
topo-aware-scheduler-config    1      6d18h
6.6.4. 收集 NUMA Resources Operator 数据
您可以使用 oc adm must-gather CLI 命令来收集有关集群的信息,包括与 NUMA Resources Operator 关联的功能和对象。
先决条件
-
您可以使用具有
cluster-admin角色的用户访问集群。 -
已安装 OpenShift CLI(
oc)。
流程
要使用
must-gather来收集 NUMA Resources Operator 数据,您必须指定 NUMA Resources Operatormust-gather镜像。$ oc adm must-gather --image=registry.redhat.io/numaresources-must-gather/numaresources-must-gather-rhel9:4.15
第 7 章 可扩展性和性能优化
7.1. 优化存储
优化存储有助于最小化所有资源中的存储使用。通过优化存储,管理员可帮助确保现有存储资源以高效的方式工作。
7.1.1. 可用的持久性存储选项
了解持久性存储选项,以便可以优化 OpenShift Container Platform 环境。
表 7.1. 可用存储选项
| 存储类型 | 描述 | 例子 |
|---|---|---|
| Block |
| AWS EBS 和 VMware vSphere 支持在 OpenShift Container Platform 中的原生动态持久性卷 (PV)置备 。 |
| File |
| RHEL NFS、NetApp NFS [1] 和供应商 NFS |
| 对象 |
| AWS S3 |
- NetApp NFS 在使用 Trident 插件时支持动态 PV 置备。
7.1.2. 推荐的可配置存储技术
下表总结了为给定的 OpenShift Container Platform 集群应用程序推荐的可配置存储技术。
表 7.2. 推荐的、可配置的存储技术
| 存储类型 | Block | File | 对象 |
|---|---|---|---|
|
1
2 3 Prometheus 是用于指标数据的底层技术。 4 这不适用于物理磁盘、虚拟机物理磁盘、VMDK 、NFS 回送、AWS EBS 和 Azure 磁盘。
5 对于指标数据,使用 6 用于日志记录,请参阅为日志存储配置持久性存储中的推荐存储解决方案。使用 NFS 存储作为持久性卷或通过 NAS (如 Gluster)可能会破坏数据。因此,OpenShift Container Platform Logging 中的 Elasticsearch 存储和 LokiStack 日志存储不支持 NFS。您必须为每个日志存储使用一个持久性卷类型。 7 对象存储不会通过 OpenShift Container Platform 的 PV 或 PVC 使用。应用程序必须与对象存储 REST API 集成。 | |||
| ROX1 | Yes4 | Yes4 | 是 |
| RWX2 | 否 | 是 | 是 |
| Registry | 可配置 | 可配置 | 推荐的 |
| 扩展的 registry | 无法配置 | 可配置 | 推荐的 |
| Metrics3 | 推荐的 | Configurable5 | 无法配置 |
| Elasticsearch Logging | 推荐的 | Configurable6 | 不支持6 |
| Loki Logging | 无法配置 | 无法配置 | 推荐的 |
| Apps | 推荐的 | 推荐的 | Not configurable7 |
扩展的容器镜像仓库(registry)是一个 OpenShift 镜像 registry,它有两个或更多个 pod 运行副本。
7.1.2.1. 特定应用程序存储建议
测试显示在 Red Hat Enterprise Linux(RHEL)中使用 NFS 服务器作为核心服务的存储后端的问题。这包括 OpenShift Container Registry 和 Quay,Prometheus 用于监控存储,以及 Elasticsearch 用于日志存储。因此,不建议使用 RHEL NFS 作为 PV 后端用于核心服务。
市场上的其他 NFS 实现可能没有这些问题。如需了解更多与此问题相关的信息,请联络相关的 NFS 厂商。
7.1.2.1.1. Registry
在非扩展的/高可用性 (HA) OpenShift 镜像 registry 集群部署中:
- 存储技术不需要支持 RWX 访问模式。
- 存储技术必须保证读写一致性。
- 首选存储技术是对象存储,然后是块存储。
- 对于应用于生产环境工作负载的 OpenShift 镜像 Registry 集群部署,我们不推荐使用文件存储。
7.1.2.1.2. 扩展的 registry
在扩展的/HA OpenShift 镜像 registry 集群部署中:
- 存储技术必须支持 RWX 访问模式。
- 存储技术必须保证读写一致性。
- 首选存储技术是对象存储。
- 支持 Red Hat OpenShift Data Foundation (ODF), Amazon Simple Storage Service (Amazon S3), Google Cloud Storage (GCS), Microsoft Azure Blob Storage, 和 OpenStack Swift。
- 对象存储应该兼容 S3 或 Swift。
- 对于非云平台,如 vSphere 和裸机安装,唯一可配置的技术是文件存储。
- 块存储是不可配置的。
7.1.2.1.3. 指标
在 OpenShift Container Platform 托管的 metrics 集群部署中:
- 首选存储技术是块存储。
- 对象存储是不可配置的。
在带有生产环境负载的托管 metrics 集群部署中不推荐使用文件存储。
7.1.2.1.4. 日志记录
在 OpenShift Container Platform 托管的日志集群部署中:
Loki Operator:
- 首选存储技术是 S3 兼容对象存储。
- 块存储是不可配置的。
OpenShift Elasticsearch Operator:
- 首选存储技术是块存储。
- 不支持对象存储。
自日志记录版本 5.4.3 起,OpenShift Elasticsearch Operator 已被弃用,计划在以后的发行版本中删除。红帽将在当前发行生命周期中提供对这个功能的程序漏洞修复和支持,但这个功能将不再获得改进,并将被删除。您可以使用 Loki Operator 作为 OpenShift Elasticsearch Operator 的替代方案来管理默认日志存储。
7.1.2.1.5. 应用程序
应用程序的用例会根据不同应用程序而不同,如下例所示:
- 支持动态 PV 部署的存储技术的挂载时间延迟较低,且不与节点绑定来支持一个健康的集群。
- 应用程序开发人员需要了解应用程序对存储的要求,以及如何与所需的存储一起工作以确保应用程序扩展或者与存储层交互时不会出现问题。
7.1.2.2. 其他特定的应用程序存储建议
不建议在 Write 密集型工作负载(如 etcd )中使用 RAID 配置。如果您使用 RAID 配置运行 etcd,您可能会遇到工作负载性能问题的风险。
- Red Hat OpenStack Platform(RHOSP)Cinder: RHOSP Cinder 倾向于在 ROX 访问模式用例中使用。
- 数据库:数据库(RDBMS 、nosql DBs 等等)倾向于使用专用块存储来获得最好的性能。
- etcd 数据库必须具有足够的存储和适当的性能容量才能启用大型集群。有关监控和基准测试工具的信息,以建立基本存储和高性能环境,请参阅 推荐 etcd 实践。
7.1.3. 数据存储管理
下表总结了 OpenShift Container Platform 组件写入数据的主要目录。
表 7.3. 用于存储 OpenShift Container Platform 数据的主目录
| 目录 | 备注 | 大小 | 预期增长 |
|---|---|---|---|
| /var/log | 所有组件的日志文件。 | 10 到 30 GB。 | 日志文件可能会快速增长 ; 大小可以通过增加磁盘或使用日志轮转来管理。 |
| /var/lib/etcd | 用于存储数据库的 etcd 存储。 | 小于 20 GB。 数据库可增大到 8 GB。 | 随着环境增长会缓慢增长。只存储元数据。 每多加 8 GB 内存需要额外 20-25 GB。 |
| /var/lib/containers | 这是 CRI-O 运行时的挂载点。用于活跃容器运行时的存储,包括 Pod 和本地镜像存储。不适用于 registry 存储。 | 有 16 GB 内存的节点需要 50 GB。请注意,这个大小不应该用于决定最小集群要求。 每多加 8 GB 内存需要额外 20-25 GB。 | 增长受运行容器容量的限制。 |
| /var/lib/kubelet | pod 的临时卷(Ephemeral volume)存储。这包括在运行时挂载到容器的任何外部存储。包括环境变量、kube secret 和不受持久性卷支持的数据卷。 | 可变 | 如果需要存储的 pod 使用持久性卷,则最小。如果使用临时存储,可能会快速增长。 |
7.1.4. 为 Microsoft Azure 优化存储性能
OpenShift Container Platform 和 Kubernetes 对磁盘性能敏感,建议使用更快的存储,特别是 control plane 节点上的 etcd。
对于生产环境 Azure 集群和带有密集型工作负载的集群,control plane 机器的虚拟机操作系统磁盘应该可以保持经过测试和推荐的最小吞吐量 5000 IOPS / 200MBps。此吞吐量可以通过至少 1 TiB Premium SSD (P30) 提供。在 Azure 和 Azure Stack Hub 中,磁盘性能直接依赖于 SSD 磁盘大小。要达到 Standard_D8s_v3 虚拟机或者其它类似机器类型,目标为 5000 IOPS,至少需要 P30 磁盘。
在读取数据时,主机缓存必须设置为 ReadOnly,以实现低延迟和高 IOPS 和吞吐量。从缓存中读取数据(在虚拟机内存或本地 SSD 磁盘上)比从磁盘读取速度要快得多,而这在 blob 存储中。
7.1.5. 其他资源
7.2. 优化路由
OpenShift Container Platform HAProxy 路由器可以扩展或配置以优化性能。
7.2.1. Ingress Controller(router)性能的基线
OpenShift Container Platform Ingress Controller 或路由器是使用路由和入口配置的应用程序和服务的入口流量的入站点。
当根据每秒处理的 HTTP 请求来评估单个 HAProxy 路由器性能时,其性能取决于多个因素。特别是:
- HTTP keep-alive/close 模式
- 路由类型
- 对 TLS 会话恢复客户端的支持
- 每个目标路由的并行连接数
- 目标路由数
- 后端服务器页面大小
- 底层基础结构(网络/SDN 解决方案、CPU 等)
具体环境中的性能会有所不同,红帽实验室在一个有 4 个 vCPU/16GB RAM 的公有云实例中进行测试。一个 HAProxy 路由器处理由后端终止的 100 个路由服务提供 1kB 静态页面,每秒处理以下传输数。
在 HTTP 的 keep-alive 模式下:
| Encryption | LoadBalancerService | HostNetwork |
|---|---|---|
| none | 21515 | 29622 |
| edge | 16743 | 22913 |
| passthrough | 36786 | 53295 |
| re-encrypt | 21583 | 25198 |
在 HTTP 关闭(无 keep-alive)情境中:
| Encryption | LoadBalancerService | HostNetwork |
|---|---|---|
| none | 5719 | 8273 |
| edge | 2729 | 4069 |
| passthrough | 4121 | 5344 |
| re-encrypt | 2320 | 2941 |
默认 Ingress Controller 配置用于将 spec.tuningOptions.threadCount 字段设置为 4。测试了两个不同的端点发布策略: Load Balancer Service 和 Host Network。TLS 会话恢复用于加密路由。使用 HTTP keep-alive 设置,单个 HAProxy 路由器可在页面大小小到 8 kB 时充满 1 Gbit NIC。
当在使用现代处理器的裸机中运行时,性能可以期望达到以上公有云实例测试性能的大约两倍。这个开销是由公有云的虚拟化层造成的,基于私有云虚拟化的环境也会有类似的开销。下表是有关在路由器后面的应用程序数量的指导信息:
| 应用程序数量 | 应用程序类型 |
|---|---|
| 5-10 | 静态文件/web 服务器或者缓存代理 |
| 100-1000 | 生成动态内容的应用程序 |
取决于所使用的技术,HAProxy 通常可支持最多 1000 个程序的路由。Ingress Controller 性能可能会受其后面的应用程序的能力和性能的限制,如使用的语言,静态内容或动态内容。
如果有多个服务于应用程序的 Ingress 或路由器,则应该使用路由器分片(router sharding)以帮助横向扩展路由层。
如需有关 Ingress 分片的更多信息,请参阅 使用路由标签和使用命名空间标签 配置 Ingress Controller 分片。
您可以修改 Ingress Controller 部署,根据 Setting Ingress Controller thread count(对于线程)和 Ingress Controller configuration parameters(对于超时)的内容,以及其他 Ingress Controller 规格中的其他调优配置。
7.2.2. 配置 Ingress Controller 存活度、就绪度和启动探测
集群管理员可为由 OpenShift Container Platform Ingress Controller(路由器)管理的路由器部署配置 kubelet 存活度、就绪度和启动探测的超时值。路由器的存活度和就绪度探测使用默认值 1 秒,这在网络或运行时性能严重降级时太短。探测超时可能会导致中断应用程序连接的路由器重启。设置较大的超时值可以降低不必要的和不需要的重启的风险。
您可以更新路由器容器的 livenessProbe、readinessProbe 和 startProbe 参数上的 timeoutSeconds 值。
| 参数 | 描述 |
|---|---|
|
|
|
|
|
|
|
|
|
timeout 配置选项是一个高级调优技术,可用于解决问题。但是,最终应该诊断这些问题,并可能为导致探测超时的所有问题打开支持问题单或 JIRA 问题。
以下示例演示了如何直接修补默认路由器部署来为存活度和就绪度探测设置 5 秒超时:
$ oc -n openshift-ingress patch deploy/router-default --type=strategic --patch='{"spec":{"template":{"spec":{"containers":[{"name":"router","livenessProbe":{"timeoutSeconds":5},"readinessProbe":{"timeoutSeconds":5}}]}}}}'验证
$ oc -n openshift-ingress describe deploy/router-default | grep -e Liveness: -e Readiness:
    Liveness:   http-get http://:1936/healthz delay=0s timeout=5s period=10s #success=1 #failure=3
    Readiness:  http-get http://:1936/healthz/ready delay=0s timeout=5s period=10s #success=1 #failure=3
7.2.3. 配置 HAProxy 重新加载间隔
当您更新路由或与路由关联的端点时,OpenShift Container Platform 路由器会更新 HAProxy 的配置。然后,HAProxy 重新加载更新后的配置以使这些更改生效。当 HAProxy 重新加载时,它会生成一个使用更新的配置来处理新连接的新进程。
HAProxy 保持旧进程正在运行,以处理现有连接,直到这些连接都关闭。当旧进程有长期连接时,这些进程可能会累积并消耗资源。
默认最小 HAProxy 重新加载间隔为 5 秒。您可以使用 spec.tuningOptions.reloadInterval 字段配置 Ingress Controller,以设置较长的重新载入间隔。
为最低 HAProxy 重新加载间隔设置较大的值可能会导致观察路由及其端点更新产生延迟。要降低风险,请避免设置值超过更新可容忍的延迟。
流程
运行以下命令,将默认 Ingress Controller 的最小 HAProxy 重新加载间隔改为 15 秒:
$ oc -n openshift-ingress-operator patch ingresscontrollers/default --type=merge --patch='{"spec":{"tuningOptions":{"reloadInterval":"15s"}}}'
7.3. 优化网络
OpenShift SDN 使用 OpenvSwitch、虚拟可扩展 LAN(VXLAN)隧道、OpenFlow 规则和 iptables。可以使用巨型帧、多队列和 ethtool 设置调优此网络。
OVN-Kubernetes 使用通用网络虚拟化封装(Geneve)而不是 VXLAN 作为隧道协议。可以使用网络接口控制器 (NIC) 卸载来调优此网络。
VXLAN 提供通过 VLAN 的好处,比如网络从 4096 增加到一千六百万,以及跨物理网络的第 2 层连接。这允许服务后的所有 pod 相互通信,即使它们在不同系统中运行也是如此。
VXLAN 在用户数据报协议(UDP)数据包中封装所有隧道流量。但是,这会导致 CPU 使用率增加。这些外部数据包和内部数据包集都遵循常规的校验规则,以保证在传输过程中不会损坏数据。根据 CPU 性能,这种额外的处理开销可能会降低吞吐量,与传统的非覆盖网络相比会增加延迟。
云、虚拟机和裸机 CPU 性能可以处理很多 Gbps 网络吞吐量。当使用高带宽链接(如 10 或 40 Gbps)时,性能可能会降低。基于 VXLAN 的环境里存在一个已知问题,它并不适用于容器或 OpenShift Container Platform。由于 VXLAN 的实现,任何依赖于 VXLAN 隧道的网络都会有相似的性能。
如果您希望超过 Gbps,可以:
- 试用采用不同路由技术的网络插件,比如边框网关协议(BGP)。
- 使用 VXLAN-offload 功能的网络适配器。VXLAN-offload 将数据包校验和相关的 CPU 开销从系统 CPU 移动到网络适配器的专用硬件中。这会释放 Pod 和应用程序使用的 CPU 周期,并允许用户利用其网络基础架构的全部带宽。
VXLAN-offload 不会降低延迟。但是,即使延迟测试也会降低 CPU 使用率。
7.3.1. 为您的网络优化 MTU
有两个重要的最大传输单元 (MTU):网络接口控制器 (NIC) MTU 和集群网络 MTU。
NIC MTU 仅在 OpenShift Container Platform 安装时进行配置。MTU 必须小于或等于您网络 NIC 的最大支持值。如果您要优化吞吐量,请选择最大可能的值。如果您要优化最小延迟,请选择一个较低值。
OpenShift SDN 网络插件覆盖 MTU 必须至少小于 NIC MTU 50 字节。此帐户用于 SDN overlay 标头。因此,在普通以太网网络中,应该将其设置为 1450。在巨型帧以太网网络中,这应设置为 8950。这些值应该由 Cluster Network Operator 根据 NIC 配置的 MTU 自动设置。因此,集群管理员通常不会更新这些值。Amazon Web Services (AWS) 和裸机环境支持巨型帧以太网网络。此设置可以帮助吞吐量,特别是传输控制协议 (TCP)。
从 OpenShift Container Platform 4.14 开始,OpenShift SDN CNI 已被弃用。自 OpenShift Container Platform 4.15 起,网络插件不是新安装的选项。在以后的发行版本中,计划删除 OpenShift SDN 网络插件,并不再被支持。红帽将在删除前对这个功能提供程序错误修正和支持,但不会再改进这个功能。作为 OpenShift SDN CNI 的替代选择,您可以使用 OVN Kubernetes CNI。
对于 OVN 和 Geneve,MTU 必须至少小于 NIC MTU 100 字节。
这个 50 字节覆盖标头与 OpenShift SDN 网络插件相关。其他 SDN 解决方案可能需要该值更大或更少。
7.3.2. 安装大型集群的实践建议
在安装大型集群或将现有的集群扩展到较大规模时,请在安装集群在 install-config.yaml 文件中相应地设置集群网络 cidr :
networking:
  clusterNetwork:
  - cidr: 10.128.0.0/14
    hostPrefix: 23
  machineNetwork:
  - cidr: 10.0.0.0/16
  networkType: OVNKubernetes
  serviceNetwork:
  - 172.30.0.0/16
如果集群的节点数超过 500 个,则无法使用默认的集群网络 cidr 10.128.0.0/14。在这种情况下,必须将其设置为 10.128.0.0/12 或 10.128.0.0/10,以支持超过 500 个节点的环境。
7.3.3. IPsec 的影响
因为加密和解密节点主机使用 CPU 电源,所以启用加密时,无论使用的 IP 安全系统是什么,性能都会影响节点上的吞吐量和 CPU 使用量。
IPsec 在到达 NIC 前,会在 IP 有效负载级别加密流量,以保护用于 NIC 卸载的字段。这意味着,在启用 IPSec 时,一些 NIC 加速功能可能无法使用,并可能导致吞吐量降低并增加 CPU 用量。
7.3.4. 其他资源
7.4. 使用挂载命名空间封装优化 CPU 使用量
您可以使用 mount 命名空间封装来优化 OpenShift Container Platform 集群中的 CPU 使用量,以便为 kubelet 和 CRI-O 进程提供私有命名空间。这可减少 systemd 使用的集群 CPU 资源,且功能没有差别。
挂载命名空间封装只是一个技术预览功能。技术预览功能不受红帽产品服务等级协议(SLA)支持,且功能可能并不完整。红帽不推荐在生产环境中使用它们。这些技术预览功能可以使用户提早试用新的功能,并有机会在开发阶段提供反馈意见。
有关红帽技术预览功能支持范围的更多信息,请参阅技术预览功能支持范围。
7.4.1. 封装挂载命名空间
挂载命名空间用于隔离挂载点,以便不同命名空间中的进程无法查看彼此的文件。封装是将 Kubernetes 挂载命名空间移到备选位置的过程,这些位置不会由主机操作系统不断扫描。
主机操作系统使用 systemd 持续扫描所有挂载命名空间:标准 Linux 挂载和 Kubernetes 用来操作的大量挂载。kubelet 和 CRI-O 的当前实现都使用所有容器运行时和 kubelet 挂载点的顶级命名空间。但是,在私有命名空间中封装这些特定于容器的挂载点可减少 systemd 开销,且功能没有差别。为 CRI-O 和 kubelet 使用单独的挂载命名空间可以封装来自任何 systemd 或其他主机操作系统交互的容器特定挂载。
现在,所有 OpenShift Container Platform 管理员都可以获得潜在的 CPU 优化功能。封装也可以通过将 Kubernetes 特定的挂载点存储在非特权用户安全检查的位置来提高安全性。
下图显示了封装之前和之后的 Kubernetes 安装。这两种场景演示了具有双向、主机到容器和 none 挂载传播设置的示例容器。
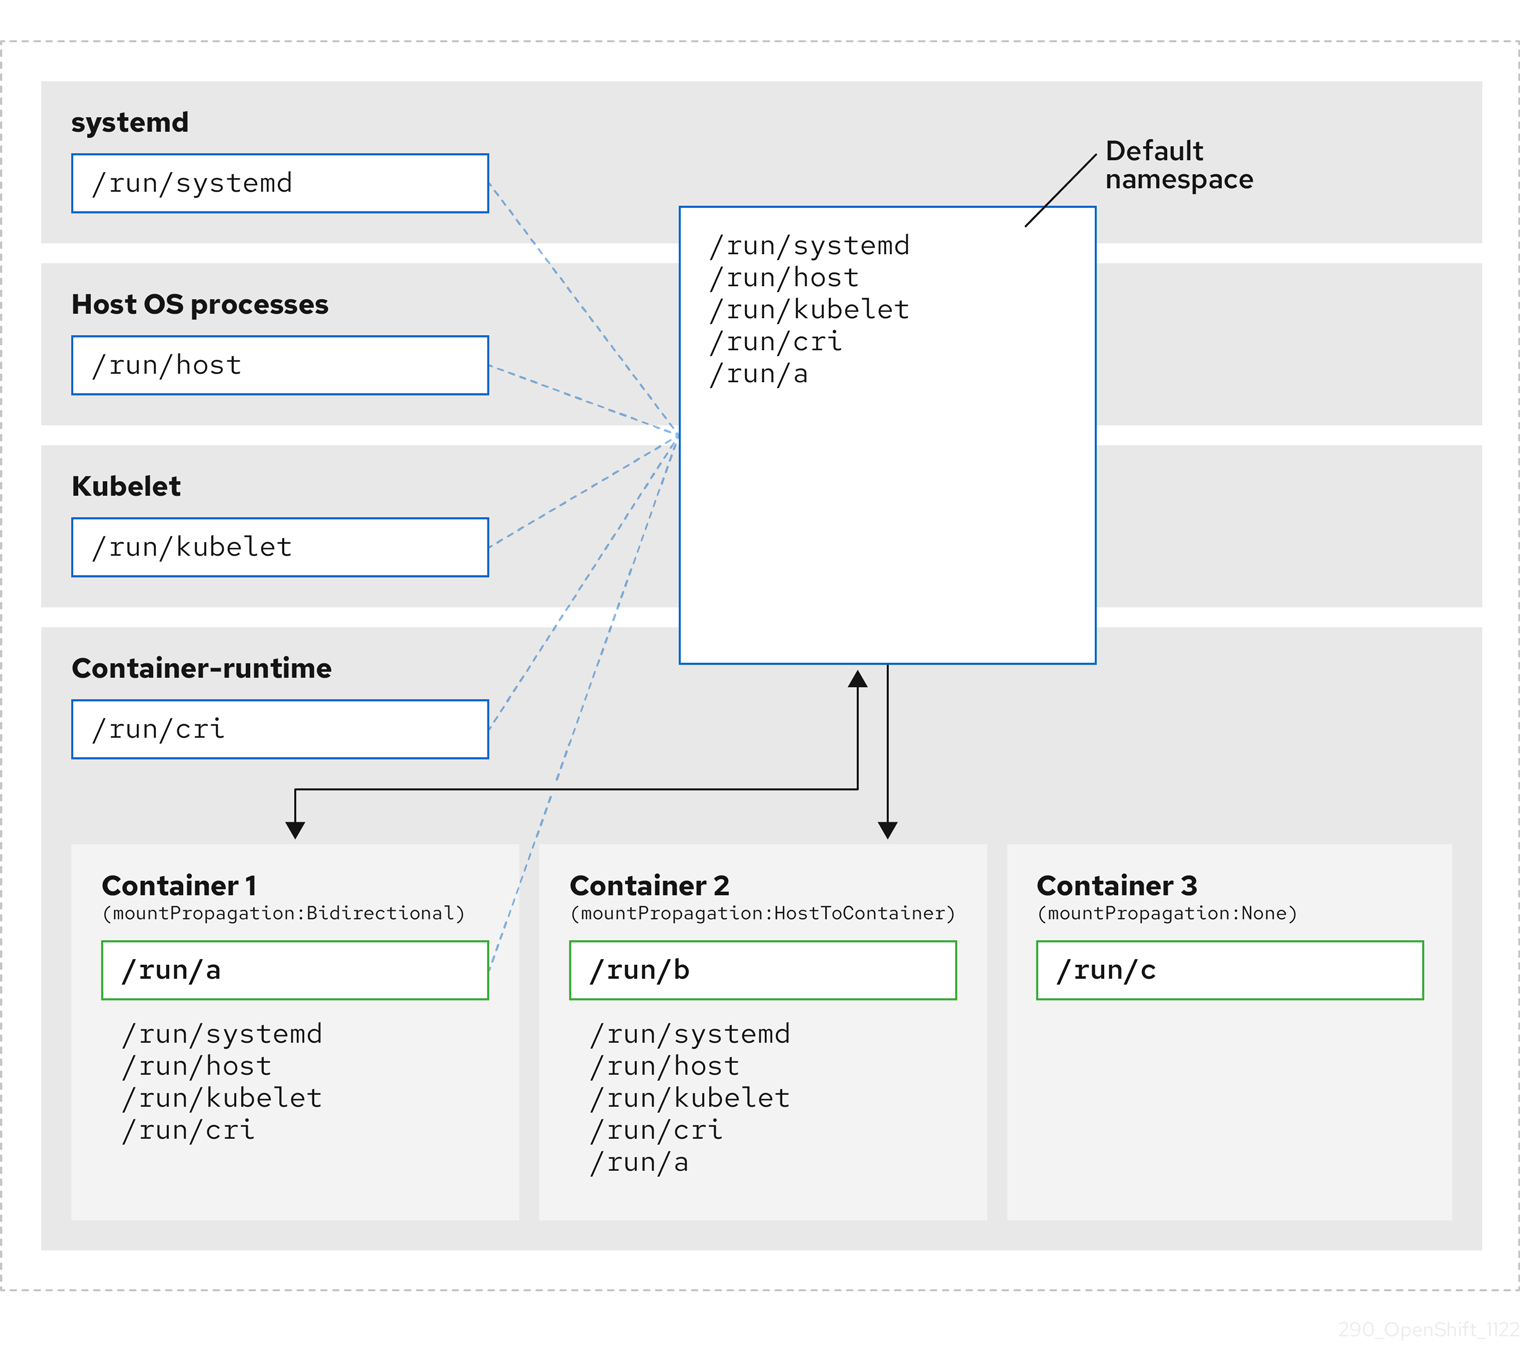
在这里,我们看到 systemd、主机操作系统进程、kubelet 和容器运行时共享单个挂载命名空间。
- systemd、主机操作系统进程、kubelet 和容器运行时都可以访问所有挂载点和可见性。
-
容器 1 (使用双向挂载传播配置)可以访问 systemd 和主机挂载、kubelet 和 CRI-O 挂载。源自容器 1 的挂载(如
/run/a)对于 systemd、主机操作系统进程、kubelet、容器运行时和其他配置了主机的容器或双向挂载传播(如在容器 2 中)可见。 -
容器 2 (使用 host-to-container 挂载传播配置)可以访问 systemd 和主机挂载、kubelet 和 CRI-O 挂载。源自容器 2 的挂载(如
/run/b)对任何其他上下文都不可见。 -
容器 3 没有配置挂载传播,对外部挂载点没有可见性。源自容器 3 的挂载(如
/run/c)对任何其他上下文都不可见。
下图演示了封装后的系统状态。
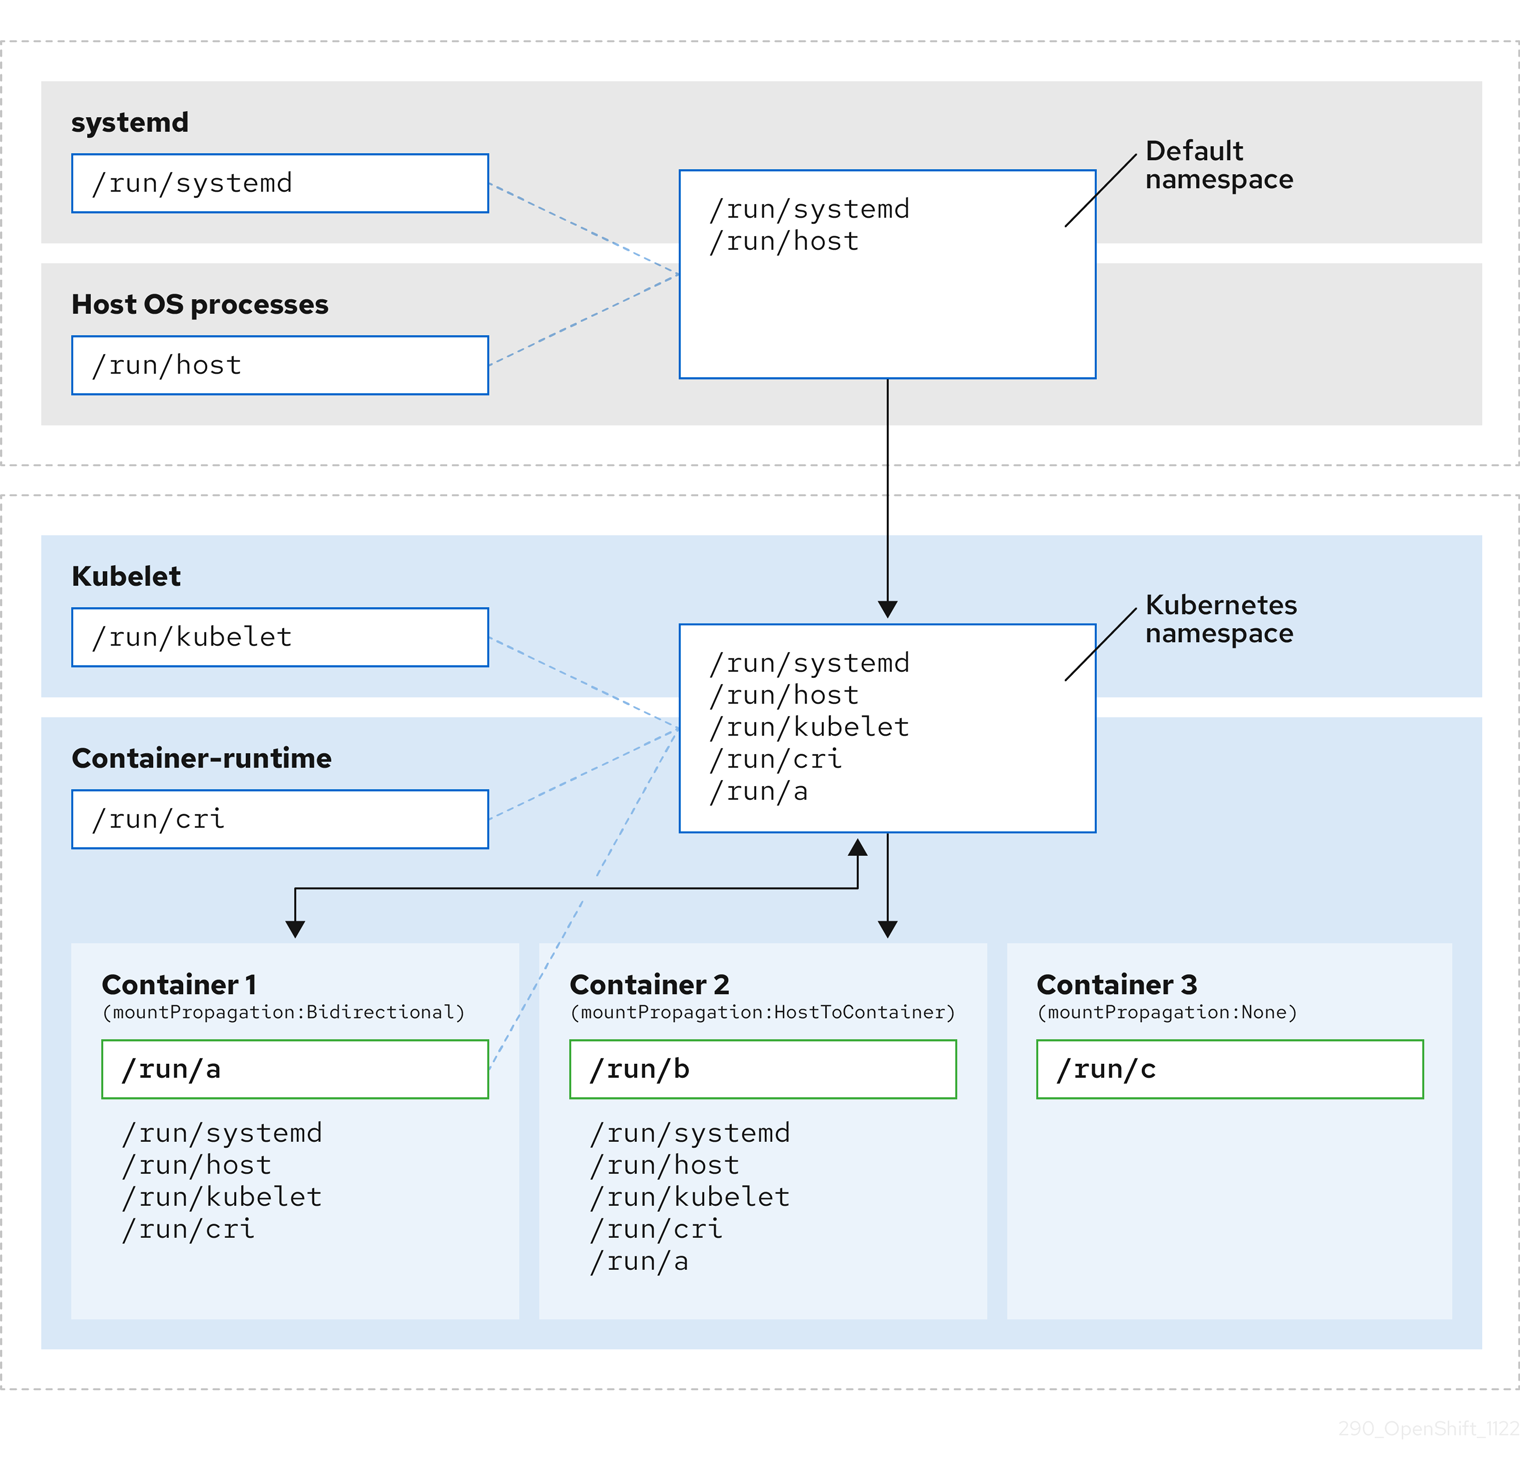
- 主 systemd 进程不再被禁止对特定于 Kubernetes 的挂载点进行不必要的扫描。它仅监控特定于 systemd 和主机挂载点。
- 主机操作系统进程只能访问 systemd 和主机挂载点。
- 为 CRI-O 和 kubelet 使用单独的挂载命名空间,可将所有特定于容器的挂载完全独立于任何 systemd 或其他主机操作系统交互。
-
容器 1 的行为保持不变,但它创建的挂载(如
/run/a)不再对 systemd 或主机操作系统进程可见。仍然对 kubelet、CRI-O 和其他配置了主机到容器或双向挂载传播的容器(如 Container 2)可见。 - 容器 2 和容器 3 的行为不会改变。
7.4.2. 配置挂载命名空间封装
您可以配置挂载命名空间封装,以便集群以较少的资源开销运行。
挂载命名空间封装是一个技术预览功能,它默认是禁用的。要使用它,您必须手动启用该功能。
先决条件
-
已安装 OpenShift CLI(
oc)。 -
您已以具有
cluster-admin权限的用户身份登录。
流程
使用以下 YAML 创建名为
mount_namespace_config.yaml的文件:apiVersion: machineconfiguration.openshift.io/v1 kind: MachineConfig metadata: labels: machineconfiguration.openshift.io/role: master name: 99-kubens-master spec: config: ignition: version: 3.2.0 systemd: units: - enabled: true name: kubens.service --- apiVersion: machineconfiguration.openshift.io/v1 kind: MachineConfig metadata: labels: machineconfiguration.openshift.io/role: worker name: 99-kubens-worker spec: config: ignition: version: 3.2.0 systemd: units: - enabled: true name: kubens.service运行以下命令来应用挂载命名空间
MachineConfigCR:$ oc apply -f mount_namespace_config.yaml
输出示例
machineconfig.machineconfiguration.openshift.io/99-kubens-master created
machineconfig.machineconfiguration.openshift.io/99-kubens-worker created
MachineConfigCR 最多可能需要 30 分钟才能完成在集群中应用。您可以运行以下命令来检查MachineConfigCR 的状态:$ oc get mcp
输出示例
NAME     CONFIG                                             UPDATED   UPDATING   DEGRADED   MACHINECOUNT   READYMACHINECOUNT   UPDATEDMACHINECOUNT   DEGRADEDMACHINECOUNT   AGE
master   rendered-master-03d4bc4befb0f4ed3566a2c8f7636751   False     True       False      3              0                   0                     0                      45m
worker   rendered-worker-10577f6ab0117ed1825f8af2ac687ddf   False     True       False      3              1                   1
运行以下命令,等待所有 control plane 和 worker 节点成功应用
MachineConfigCR:$ oc wait --for=condition=Updated mcp --all --timeout=30m
输出示例
machineconfigpool.machineconfiguration.openshift.io/master condition met
machineconfigpool.machineconfiguration.openshift.io/worker condition met
验证
要验证集群主机的封装,请运行以下命令:
打开集群主机的默认 shell:
$ oc debug node/<node_name>
打开
chroot会话:sh-4.4# chroot /host
检查 systemd 挂载命名空间:
sh-4.4# readlink /proc/1/ns/mnt
输出示例
mnt:[4026531953]
检查 kubelet 挂载命名空间:
sh-4.4# readlink /proc/$(pgrep kubelet)/ns/mnt
输出示例
mnt:[4026531840]
检查 CRI-O 挂载命名空间:
sh-4.4# readlink /proc/$(pgrep crio)/ns/mnt
输出示例
mnt:[4026531840]
这些命令返回与 systemd、kubelet 和容器运行时关联的挂载命名空间。在 OpenShift Container Platform 中,容器运行时是 CRI-O。
如果 systemd 位于 kubelet 和 CRI-O 的挂载命名空间中,则封装生效,如上例中所示。如果所有三个进程都位于同一挂载命名空间中,则封装无效。
7.4.3. 检查封装的命名空间
您可以使用 Red Hat Enterprise Linux CoreOS (RHCOS) 中的 kubensenter 脚本检查集群主机操作系统中特定于 Kubernetes 的挂载点以进行调试或审核目的。
到集群主机的 SSH shell 会话位于 default 命名空间中。要在 SSH shell 提示符中检查特定于 Kubernetes 的挂载点,您需要以 root 用户身份运行 kubensenter 脚本。kubensenter 脚本了解挂载封装的状态,即使未启用封装,也可以安全地运行。
默认情况下,oc debug 远程 shell 会话在 Kubernetes 命名空间内启动。使用 oc debug 时,您不需要运行 kubensenter 来检查挂载点。
如果没有启用封装功能,kubensenter findmnt 和 findmnt 命令会返回相同的输出,无论它们是否在 oc debug 会话或 SSH shell 提示符中运行。
先决条件
-
已安装 OpenShift CLI(
oc)。 -
您已以具有
cluster-admin权限的用户身份登录。 - 您已配置了到集群主机的 SSH 访问。
流程
打开到集群主机的远程 SSH shell。例如:
$ ssh core@<node_name>
以 root 用户身份使用提供的
kubensenter脚本运行命令。要在 Kubernetes 命名空间中运行单个命令,请为kubensenter脚本提供命令和任何参数。例如,要在 Kubernetes 命名空间中运行findmnt命令,请运行以下命令:[core@control-plane-1 ~]$ sudo kubensenter findmnt
输出示例
kubensenter: Autodetect: kubens.service namespace found at /run/kubens/mnt
TARGET                                SOURCE                 FSTYPE     OPTIONS
/                                     /dev/sda4[/ostree/deploy/rhcos/deploy/32074f0e8e5ec453e56f5a8a7bc9347eaa4172349ceab9c22b709d9d71a3f4b0.0]
|                                                            xfs        rw,relatime,seclabel,attr2,inode64,logbufs=8,logbsize=32k,prjquota
                                      shm                    tmpfs
...
要在 Kubernetes 命名空间中启动新的交互式 shell,请运行没有任何参数的
kubensenter脚本:[core@control-plane-1 ~]$ sudo kubensenter
输出示例
kubensenter: Autodetect: kubens.service namespace found at /run/kubens/mnt
7.4.4. 在封装的命名空间中运行额外的服务
任何依赖于可以在主机操作系统中运行的能力,以及由 kubelet、CRI-O 或容器本身创建的挂载点的监控工具,都必须输入容器挂载命名空间来查看这些挂载点。OpenShift Container Platform 提供的 kubensenter 脚本在 Kubernetes 挂载点中执行另一个命令,并可用于适配任何现有工具。
kubensenter 脚本了解挂载封装功能状态,即使未启用封装功能,也可以安全地运行。在这种情况下,脚本会在默认挂载命名空间中执行提供的命令。
例如,如果 systemd 服务需要在新的 Kubernetes 挂载命名空间中运行,请编辑服务文件,并使用带有 kubensenter 的 ExecStart= 命令行。
[Unit]
Description=Example service
[Service]
ExecStart=/usr/bin/kubensenter /path/to/original/command arg1 arg2
7.4.5. 其他资源
第 8 章 管理裸机主机
在裸机集群中安装 OpenShift Container Platform 时,您可以使用机器(machine)和机器集(machineset)自定义资源(CR)为集群中存在的裸机主机置备和管理裸机节点。
8.1. 关于裸机主机和节点
要将 Red Hat Enterprise Linux CoreOS(RHCOS)裸机主机置备为集群中的节点,首先创建一个与裸机主机硬件对应的 MachineSet 自定义资源(CR)对象。裸机主机计算机器集描述了特定于您的配置的基础架构组件。将特定的 Kubernetes 标签应用于这些计算机器集,然后将基础架构组件更新为仅在那些机器上运行。
当您扩展包含 metal3.io/autoscale-to-hosts 注解的相关 MachineSet 时,Machine CR 会被自动创建。OpenShift Container Platform 使用 Machine CR 来置备与 MachineSet CR 中指定的主机对应的裸机节点。
8.2. 维护裸机主机
您可从 OpenShift Container Platform Web 控制台维护集群中的裸机主机详情。导航到 Compute → Bare Metal Hosts,然后从 Actions 下拉菜单中选择一个任务。您可以在此处管理诸如 BMC 详情、主机的引导 MAC 地址、启用电源管理等项目。您还可以查看主机的网络接口和驱动器详情。
您可以将裸机主机移入维护模式。当您将主机移入维护模式时,调度程序会将所有受管工作负载从对应的裸机节点中移出。在处于维护模式时不会调度新的工作负载。
您可以在 web 控制台中取消置备裸机主机。取消置备主机执行以下操作:
-
使用
cluster.k8s.io/delete-machine: true注解裸机主机 CR - 缩减相关的计算机器集
在不先将守护进程集和未管理的静态 pod 移动到另一节点的情况下,关闭主机电源可能会导致服务中断和数据丢失。
其他资源
8.2.1. 使用 web 控制台在集群中添加裸机主机
您可以在 web 控制台中在集群中添加裸机主机。
先决条件
- 在裸机上安装 RHCOS 集群。
-
以具有
cluster-admin特权的用户身份登录。
流程
- 在 web 控制台中,导航到 Compute → Bare Metal Hosts。
- 选择 Add Host → New with Dialog。
- 为新的裸机主机指定唯一名称。
- 设置 引导 MAC 地址。
- 设置 基板管理控制台(BMC)地址.
- 输入主机的基板管理控制器(BMC)的用户凭据。
- 选择在创建后打开主机电源,然后选择 Create。
- 向上扩展副本数,以匹配可用的裸机主机数量。导航到 Compute → MachineSets,然后从 Actions 下拉菜单中选择 Edit Machine count 来增加集群中的机器副本数量。
您还可以使用 oc scale 命令和适当的裸机计算机器集来管理裸机节点的数量。
8.2.2. 在 web 控制台中使用 YAML 在集群中添加裸机主机
您可以使用描述裸机主机的 YAML 文件在 web 控制台中在集群中添加裸机主机。
先决条件
- 在裸机基础架构上安装 RHCOS 计算机器,以便在集群中使用。
-
以具有
cluster-admin特权的用户身份登录。 -
为裸机主机创建
SecretCR。
流程
- 在 web 控制台中,导航到 Compute → Bare Metal Hosts。
- 选择 Add Host → New from YAML。
复制并粘贴以下 YAML,使用您的主机详情修改相关字段:
apiVersion: metal3.io/v1alpha1 kind: BareMetalHost metadata: name: <bare_metal_host_name> spec: online: true bmc: address: <bmc_address> credentialsName: <secret_credentials_name> 1 disableCertificateVerification: True 2 bootMACAddress: <host_boot_mac_address>- 选择 Create 以保存 YAML 并创建新的裸机主机。
向上扩展副本数,以匹配可用的裸机主机数量。导航到 Compute → MachineSets,然后从 Actions 下拉菜单中选择 Edit Machine count 来增加集群中的机器数量。
注意您还可以使用
oc scale命令和适当的裸机计算机器集来管理裸机节点的数量。
8.2.3. 自动将机器扩展到可用的裸机主机数量
要自动创建与可用 BareMetalHost 对象数量匹配的 Machine 对象数量,请在 MachineSet 对象中添加 metal3.io/autoscale-to-hosts 注解。
先决条件
-
安装 RHCOS 裸机计算机器以在集群中使用,并创建对应的
BareMetalHost对象。 -
安装 OpenShift Container Platform CLI(
oc)。 -
以具有
cluster-admin特权的用户身份登录。
流程
通过添加
metal3.io/autoscale-to-hosts注解来注解您要配置的用于自动扩展的计算机器集。将<machineset>替换为计算机器设置的名称。$ oc annotate machineset <machineset> -n openshift-machine-api 'metal3.io/autoscale-to-hosts=<any_value>'
等待新的缩放计算机启动。
当您使用 BareMetalHost 对象在集群中创建机器时,BareMetalHost 上更改了标签或选择器,BareMetalHost 对象仍然会根据创建 Machine 对象的 MachineSet 进行计数。
8.2.4. 从 provisioner 节点中删除裸机主机
在某些情况下,您可能想要从 provisioner 节点临时删除裸机主机。例如,在使用 OpenShift Container Platform 管理控制台或机器配置池更新触发裸机主机重启时,OpenShift Container Platform 日志会登录到集成的 Dell Remote Access Controller (iDrac),并发出删除作业队列。
要防止管理与可用 BareMetalHost 对象数量匹配的 Machine 对象数量,请在 MachineSet 对象中添加 baremetalhost.metal3.io/detached 注解。
这个注解只适用于处于 Provisioned, ExternallyProvisioned 或 Ready/Available 状态的 BareMetalHost 对象。
先决条件
-
安装 RHCOS 裸机计算机器以在集群中使用,并创建对应的
BareMetalHost对象。 -
安装 OpenShift Container Platform CLI(
oc)。 -
以具有
cluster-admin特权的用户身份登录。
流程
通过添加
baremetalhost.metal3.io/detached注解来注解您要从 provisioner 节点中删除的计算机器集。$ oc annotate machineset <machineset> -n openshift-machine-api 'baremetalhost.metal3.io/detached'
等待新机器启动。
注意当您使用
BareMetalHost对象在集群中创建机器时,BareMetalHost上更改了标签或选择器,BareMetalHost对象仍然会根据创建Machine对象的MachineSet进行计数。在置备用例中,使用以下命令在重启完成后删除注解:
$ oc annotate machineset <machineset> -n openshift-machine-api 'baremetalhost.metal3.io/detached-'
第 9 章 使用 Bare Metal Event Relay 监控裸机事件
裸机事件中继只是一个技术预览功能。技术预览功能不受红帽产品服务等级协议(SLA)支持,且功能可能并不完整。红帽不推荐在生产环境中使用它们。这些技术预览功能可以使用户提早试用新的功能,并有机会在开发阶段提供反馈意见。
有关红帽技术预览功能支持范围的更多信息,请参阅技术预览功能支持范围。
9.1. 关于裸机事件
Bare Metal Event Relay Operator 已被弃用。以后的 OpenShift Container Platform 发行版本中会删除使用 Bare Metal Event Relay Operator 监控裸机主机的功能。
使用 Bare Metal Event Relay 将 OpenShift Container Platform 集群中运行的应用程序订阅到底层裸机主机上生成的事件。Redfish 服务在节点上发布事件,并将其传送到高级消息队列中。
裸机事件基于在分布式管理任务组(DMTF)的指导下开发的开源 Redfish 标准。Redfish 提供了一个带有 REST API 的安全行业标准协议。该协议用于管理分布式、融合或软件定义的资源和基础架构。
通过 Redfish 发布的硬件相关事件包括:
- 违反临时处理限制
- 服务器状态
- 风扇状态
通过部署 Bare Metal Event Relay Operator 并将您的应用程序订阅到服务来开始使用裸机事件。Bare Metal Event Relay Operator 安装和管理 Redfish 裸机事件服务的生命周期。
Bare Metal 事件 Relay 只适用于在裸机基础架构上置备的单节点集群中支持 Redfish 的设备。
9.2. 裸机事件的工作方式
Bare Metal Event Relay 启用在裸机集群中运行的应用程序可以快速响应 Redfish 硬件更改和故障,如违反温度阈值、故障故障、磁盘丢失、电源中断和内存故障。这些硬件事件使用 HTTP 传输或 AMQP 机制交付。消息传递服务的延迟时间为 10 到 20 毫秒。
裸机事件中继为硬件事件提供了一个发布订阅服务。应用程序可以使用 REST API 订阅事件。Bare Metal 事件 Relay 支持与 Redfish OpenAPI v1.8 或更高版本的硬件。
9.2.1. 裸机事件中继数据流
下图演示了裸机事件数据流示例:
图 9.1. 裸机事件中继数据流
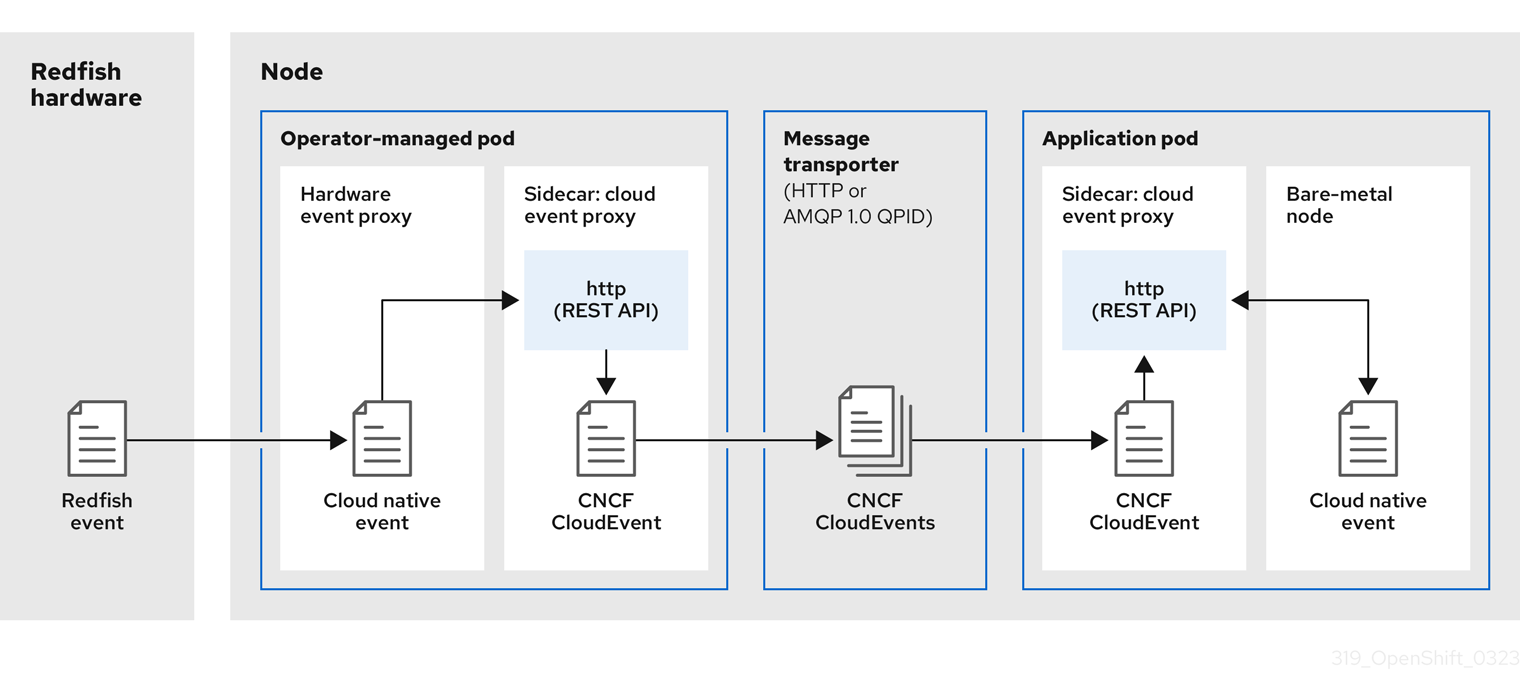
9.2.1.1. Operator 管理的 pod
Operator 使用自定义资源来管理包含 Bare Metal Event Relay 及其组件( hardware Event CR) 的 pod。
9.2.1.2. 裸机事件中继
启动时,Bare Metal 事件 Relay 查询 Redfish API 并下载所有消息 registry,包括自定义 registry。然后,Bare Metal 事件 Relay 开始从 Redfish 硬件接收订阅的事件。
Bare Metal Event Relay 启用在裸机集群中运行的应用程序可以快速响应 Redfish 硬件更改和故障,如违反温度阈值、故障故障、磁盘丢失、电源中断和内存故障。使用 HardwareEvent CR 报告事件。
9.2.1.3. 云原生事件
云原生事件(CNE)是用于定义事件数据格式的 REST API 规格。
9.2.1.4. CNCF CloudEvents
CloudEvents 是云原生计算基础(CNCF)开发的供应商中立规格,用于定义事件数据的格式。
9.2.1.5. HTTP 传输或 AMQP 分配路由器
HTTP 传输或 AMQP 分配路由器负责发布者和订阅者之间的消息交付服务。
HTTP 传输是 PTP 和裸机事件的默认传输。在可能的情况下,使用 HTTP 传输而不是 AMQP 用于 PTP 和裸机事件。AMQ Interconnect 于 2024 年 6 月 30 日结束生命周期(EOL)。AMQ Interconnect 的延长生命周期支持 (ELS) 于 2029 年 11 月 29 日结束。如需更多信息,请参阅 Red Hat AMQ Interconnect 支持状态。
9.2.1.6. 云事件代理 sidecar
云事件代理 sidecar 容器镜像基于 O-RAN API 规格,为硬件事件提供发布订阅事件框架。
9.2.2. Redfish 消息解析服务
除了处理 Redfish 事件外,Bare Metal Event Relay 为事件提供消息解析功能,而无需 Message 属性。代理会下载所有 Redfish 消息 registry,包括在启动时从硬件中的特定 registry。如果事件不包含 Message 属性,代理使用 Redfish 消息 registry 来构造 Message 和 Resolution 属性,并在将事件传递给云事件框架前将其添加到事件中。此服务允许 Redfish 事件具有较小的消息大小,并会降低传输延迟。
9.2.3. 使用 CLI 安装裸机事件中继
作为集群管理员,您可以使用 CLI 安装 Bare Metal Event Relay Operator。
先决条件
- 在裸机硬件上安装的集群,节点带有启用了 RedFish 的 Baseboard Management Controller(BMC)。
-
安装 OpenShift CLI(
oc)。 -
以具有
cluster-admin特权的用户身份登录。
流程
为 Bare Metal Event Relay 创建命名空间。
将以下 YAML 保存到
bare-metal-events-namespace.yaml文件中:apiVersion: v1 kind: Namespace metadata: name: openshift-bare-metal-events labels: name: openshift-bare-metal-events openshift.io/cluster-monitoring: "true"创建
NamespaceCR:$ oc create -f bare-metal-events-namespace.yaml
为 Bare Metal Event Relay Operator 创建 Operator 组。
将以下 YAML 保存到
bare-metal-events-operatorgroup.yaml文件中:apiVersion: operators.coreos.com/v1 kind: OperatorGroup metadata: name: bare-metal-event-relay-group namespace: openshift-bare-metal-events spec: targetNamespaces: - openshift-bare-metal-events
创建
OperatorGroupCR:$ oc create -f bare-metal-events-operatorgroup.yaml
订阅裸机恢复事件中继。
将以下 YAML 保存到
bare-metal-events-sub.yaml文件中:apiVersion: operators.coreos.com/v1alpha1 kind: Subscription metadata: name: bare-metal-event-relay-subscription namespace: openshift-bare-metal-events spec: channel: "stable" name: bare-metal-event-relay source: redhat-operators sourceNamespace: openshift-marketplace
创建
SubscriptionCR:$ oc create -f bare-metal-events-sub.yaml
验证
要验证是否已安装 Bare Metal Event Relay Operator,请运行以下命令:
$ oc get csv -n openshift-bare-metal-events -o custom-columns=Name:.metadata.name,Phase:.status.phase
9.2.4. 使用 Web 控制台安装 Bare Metal Event Relay
作为集群管理员,您可以使用 Web 控制台安装 Bare Metal Event Relay Operator。
先决条件
- 在裸机硬件上安装的集群,节点带有启用了 RedFish 的 Baseboard Management Controller(BMC)。
-
以具有
cluster-admin特权的用户身份登录。
流程
使用 OpenShift Container Platform Web 控制台安装 Bare Metal Event Relay:
- 在 OpenShift Container Platform Web 控制台中,点击 Operators → OperatorHub。
- 从可用的 Operator 列表中选择 Bare Metal Event Relay,然后点 Install。
- 在 Install Operator 页面中,选择或创建一个命名空间,选择 openshift-bare-metal-events,然后点 Install。
验证
可选: 您可以通过执行以下检查来验证 Operator 是否已成功安装:
- 切换到 Operators → Installed Operators 页面。
确保项目中列出了 Bare Metal Event Relay,Status 为 InstallSucceeded。
注意在安装过程中,Operator 可能会显示 Failed 状态。如果安装过程结束后有 InstallSucceeded 信息,您可以忽略这个 Failed 信息。
如果 Operator 没有被成功安装,请按照以下步骤进行故障排除:
- 进入 Operators → Installed Operators 页面,检查 Operator Subscriptions 和 Install Plans 选项卡中的 Status 项中是否有任何错误。
- 进入 Workloads → Pods 页面,检查项目命名空间中的 pod 日志。
9.3. 安装 AMQ 消息传递总线
要在节点上的 publisher 和 subscriber 间传递 Redfish 裸机事件通知,您必须安装并配置 AMQ 消息总线以便在节点上运行。您可以通过安装 AMQ Interconnect Operator 来在集群中使用。
HTTP 传输是 PTP 和裸机事件的默认传输。在可能的情况下,使用 HTTP 传输而不是 AMQP 用于 PTP 和裸机事件。AMQ Interconnect 于 2024 年 6 月 30 日结束生命周期(EOL)。AMQ Interconnect 的延长生命周期支持 (ELS) 于 2029 年 11 月 29 日结束。如需更多信息,请参阅 Red Hat AMQ Interconnect 支持状态。
先决条件
-
安装 OpenShift Container Platform CLI(
oc)。 -
以具有
cluster-admin特权的用户身份登录。
流程
-
将 AMQ Interconnect Operator 安装到其自己的
amq-interconnect命名空间。请参阅安装 AMQ Interconnect Operator。
验证
验证 AMQ Interconnect Operator 是否可用,并且所需的 pod 是否正在运行:
$ oc get pods -n amq-interconnect
输出示例
NAME                                    READY   STATUS    RESTARTS   AGE
amq-interconnect-645db76c76-k8ghs       1/1     Running   0          23h
interconnect-operator-5cb5fc7cc-4v7qm   1/1     Running   0          23h
验证所需的
bare-metal-event-relaybare-metal event producer pod 是否已在openshift-bare-metal-events命令空间中运行:$ oc get pods -n openshift-bare-metal-events
输出示例
NAME                                                            READY   STATUS    RESTARTS   AGE
hw-event-proxy-operator-controller-manager-74d5649b7c-dzgtl     2/2     Running   0          25s
9.4. 订阅集群节点的 Redfish BMC 裸机事件
您可以通过为节点创建一个 BMCEventSubscription 自定义资源(CR)、为事件创建一个 HardwareEvent CR 并为 BMC 创建一个 Secret CR,订阅在集群的节点上生成的 Redfish BMC 事件。
9.4.1. 订阅裸机事件
您可以配置基板管理控制器(BMC)将裸机事件发送到 OpenShift Container Platform 集群中运行的订阅应用程序。Redfish 裸机事件示例包括增加设备温度或删除设备。您可以使用 REST API 将应用程序订阅到裸机事件。
您只能为支持 Redfish 的物理硬件创建一个 BMCEventSubscription 自定义资源(CR),并将厂商接口设置为 redfish 或 idrac-redfish。
使用 BMCEventSubscription CR 订阅预定义的 Redfish 事件。Redfish 标准不提供创建特定警报和阈值的选项。例如,当机箱的温度超过 40Gb 摄氏度时收到警报事件,您必须根据供应商的建议手动配置事件。
执行以下步骤使用 BMCEventSubscription CR 为节点订阅裸机事件。
先决条件
-
安装 OpenShift CLI(
oc)。 -
以具有
cluster-admin特权的用户身份登录。 - 获取 BMC 的用户名和密码。
使用集群中启用了 Redfish 的 Baseboard Management Controller(BMC)部署裸机节点,并在 BMC 上启用 Redfish 事件。
注意在特定硬件上启用 Redfish 事件超出了此信息的范围。有关为特定硬件启用 Redfish 事件的更多信息,请参阅 BMC 厂商文档。
流程
通过运行以下
curl命令确认节点硬件启用了 RedfishEventService:$ curl https://<bmc_ip_address>/redfish/v1/EventService --insecure -H 'Content-Type: application/json' -u "<bmc_username>:<password>"
其中:
- bmc_ip_address
- 是生成 Redfish 事件的 BMC 的 IP 地址。
输出示例
{
   "@odata.context": "/redfish/v1/$metadata#EventService.EventService",
   "@odata.id": "/redfish/v1/EventService",
   "@odata.type": "#EventService.v1_0_2.EventService",
   "Actions": {
      "#EventService.SubmitTestEvent": {
         "EventType@Redfish.AllowableValues": ["StatusChange", "ResourceUpdated", "ResourceAdded", "ResourceRemoved", "Alert"],
         "target": "/redfish/v1/EventService/Actions/EventService.SubmitTestEvent"
      }
   },
   "DeliveryRetryAttempts": 3,
   "DeliveryRetryIntervalSeconds": 30,
   "Description": "Event Service represents the properties for the service",
   "EventTypesForSubscription": ["StatusChange", "ResourceUpdated", "ResourceAdded", "ResourceRemoved", "Alert"],
   "EventTypesForSubscription@odata.count": 5,
   "Id": "EventService",
   "Name": "Event Service",
   "ServiceEnabled": true,
   "Status": {
      "Health": "OK",
      "HealthRollup": "OK",
      "State": "Enabled"
   },
   "Subscriptions": {
      "@odata.id": "/redfish/v1/EventService/Subscriptions"
   }
}
运行以下命令,获取集群的 Bare Metal 事件中继服务路由:
$ oc get route -n openshift-bare-metal-events
输出示例
NAME            HOST/PORT   PATH                                                                    SERVICES                 PORT   TERMINATION   WILDCARD
hw-event-proxy              hw-event-proxy-openshift-bare-metal-events.apps.compute-1.example.com   hw-event-proxy-service   9087   edge          None
创建一个
BMCEventSubscription资源来订阅 Redfish 事件:将以下 YAML 保存到
bmc_sub.yaml文件中:apiVersion: metal3.io/v1alpha1 kind: BMCEventSubscription metadata: name: sub-01 namespace: openshift-machine-api spec: hostName: <hostname> 1 destination: <proxy_service_url> 2 context: ''
创建
BMCEventSubscriptionCR:$ oc create -f bmc_sub.yaml
可选: 要删除 BMC 事件订阅,请运行以下命令:
$ oc delete -f bmc_sub.yaml
可选: 要在不创建
BMCEventSubscriptionCR 的情况下手动创建 Redfish 事件订阅,请运行以下curl命令并指定 BMC 用户名和密码。$ curl -i -k -X POST -H "Content-Type: application/json" -d '{"Destination": "https://<proxy_service_url>", "Protocol" : "Redfish", "EventTypes": ["Alert"], "Context": "root"}' -u <bmc_username>:<password> 'https://<bmc_ip_address>/redfish/v1/EventService/Subscriptions' –v其中:
- proxy_service_url
-
裸机事件代理服务,例如
https://hw-event-proxy-openshift-bare-metal-events.apps.compute-1.example.com/webhook。
- bmc_ip_address
- 是生成 Redfish 事件的 BMC 的 IP 地址。
输出示例
HTTP/1.1 201 Created
Server: AMI MegaRAC Redfish Service
Location: /redfish/v1/EventService/Subscriptions/1
Allow: GET, POST
Access-Control-Allow-Origin: *
Access-Control-Expose-Headers: X-Auth-Token
Access-Control-Allow-Headers: X-Auth-Token
Access-Control-Allow-Credentials: true
Cache-Control: no-cache, must-revalidate
Link: <http://redfish.dmtf.org/schemas/v1/EventDestination.v1_6_0.json>; rel=describedby
Link: <http://redfish.dmtf.org/schemas/v1/EventDestination.v1_6_0.json>
Link: </redfish/v1/EventService/Subscriptions>; path=
ETag: "1651135676"
Content-Type: application/json; charset=UTF-8
OData-Version: 4.0
Content-Length: 614
Date: Thu, 28 Apr 2022 08:47:57 GMT
9.4.2. 使用 curl 查询 Redfish 裸机事件订阅
有些硬件供应商限制 Redfish 硬件事件订阅的数量。您可以使用 curl 查询 Redfish 事件订阅的数量。
先决条件
- 获取 BMC 的用户名和密码。
- 使用集群中启用了 Redfish 的 Baseboard Management Controller(BMC)部署裸机节点,并在 BMC 上启用 Redfish 硬件事件。
流程
运行以下
curl命令,检查 BMC 的当前订阅:$ curl --globoff -H "Content-Type: application/json" -k -X GET --user <bmc_username>:<password> https://<bmc_ip_address>/redfish/v1/EventService/Subscriptions
其中:
- bmc_ip_address
- 是生成 Redfish 事件的 BMC 的 IP 地址。
输出示例
% Total % Received % Xferd Average Speed Time Time Time Current
Dload Upload Total Spent Left Speed
100 435 100 435 0 0 399 0 0:00:01 0:00:01 --:--:-- 399
{
  "@odata.context": "/redfish/v1/$metadata#EventDestinationCollection.EventDestinationCollection",
  "@odata.etag": ""
  1651137375 "",
  "@odata.id": "/redfish/v1/EventService/Subscriptions",
  "@odata.type": "#EventDestinationCollection.EventDestinationCollection",
  "Description": "Collection for Event Subscriptions",
  "Members": [
  {
    "@odata.id": "/redfish/v1/EventService/Subscriptions/1"
  }],
  "Members@odata.count": 1,
  "Name": "Event Subscriptions Collection"
}
本例中配置了单个订阅:
/redfish/v1/EventService/Subscriptions/1。可选: 要使用
curl删除/redfish/v1/EventService/Subscriptions/1订阅,请运行以下命令并指定 BMC 用户名和密码:$ curl --globoff -L -w "%{http_code} %{url_effective}\n" -k -u <bmc_username>:<password >-H "Content-Type: application/json" -d '{}' -X DELETE https://<bmc_ip_address>/redfish/v1/EventService/Subscriptions/1其中:
- bmc_ip_address
- 是生成 Redfish 事件的 BMC 的 IP 地址。
9.4.3. 创建裸机事件和 Secret CR
要使用裸机事件,请为存在 Redfish 硬件的主机创建 HardwareEvent 自定义资源(CR)。在 hw-event-proxy 日志中报告硬件事件和错误。
先决条件
-
已安装 OpenShift Container Platform CLI (
oc)。 -
您已以具有
cluster-admin权限的用户身份登录。 - 已安装 Bare Metal Event Relay。
-
您已为 BMC Redfish 硬件创建了
BMCEventSubscriptionCR。
流程
创建
HardwareEvent自定义资源(CR):注意不允许多个
HardwareEvent资源。将以下 YAML 保存到
hw-event.yaml文件中:apiVersion: "event.redhat-cne.org/v1alpha1" kind: "HardwareEvent" metadata: name: "hardware-event" spec: nodeSelector: node-role.kubernetes.io/hw-event: "" 1 logLevel: "debug" 2 msgParserTimeout: "10" 3- 1
- 必需。使用
nodeSelector字段来带有指定标签的目标节点,如node-role.kubernetes.io/hw-event: ""。注意在 OpenShift Container Platform 4.13 或更高版本中,当对裸机事件使用 HTTP 传输时,您不需要在
HardwareEvent资源中设置spec.transportHost字段。仅在裸机事件使用 AMQP 传输时设置transportHost。 - 2
- 可选。默认值为
debug。在hw-event-proxy日志中设置日志级别。可用的日志级别如下:fatal、error、warning、info、debug、trace。 - 3
- 可选。为 Message Parser 设置超时值(毫秒)。如果在超时时间内没有响应消息解析请求,原始硬件事件信息会被传递给云原生事件框架。默认值为 10。
在集群中应用
HardwareEventCR:$ oc create -f hardware-event.yaml
创建一个 BMC 用户名和密码
SecretCR,使硬件事件代理能够访问裸机主机的 Redfish 消息 registry。将以下 YAML 保存到
hw-event-bmc-secret.yaml文件中:apiVersion: v1 kind: Secret metadata: name: redfish-basic-auth type: Opaque stringData: 1 username: <bmc_username> password: <bmc_password> # BMC host DNS or IP address hostaddr: <bmc_host_ip_address>- 1
- 为
stringData下的各种项目输入纯文本值。
创建
SecretCR:$ oc create -f hw-event-bmc-secret.yaml
其他资源
9.5. 将应用程序订阅到裸机事件 REST API 参考
使用裸机事件 REST API 订阅应用程序到父节点上生成的裸机事件。
使用资源地址 /cluster/node/<node_name>/redfish/event 将应用程序订阅到 Redfish 事件,其中 <node_name> 是运行应用程序的集群节点。
在单独的应用程序 pod 中部署 cloud-event-consumer 应用程序容器和 cloud-event-proxy sidecar 容器。cloud-event-consumer 应用订阅应用容器集中的 cloud-event-proxy 容器。
使用以下 API 端点,将 cloud-event-consumer 应用程序订阅到 Redfish 事件,这些事件由 cloud-event-proxy 容器发布,位于应用程序 pod 中的 http://localhost:8089/api/ocloudNotifications/v1/:
/api/ocloudNotifications/v1/subscriptions-
POST:创建新订阅 -
GET:删除订阅列表
-
/api/ocloudNotifications/v1/subscriptions/<subscription_id>-
PUT:为指定订阅 ID 创建新状态 ping 请求
-
/api/ocloudNotifications/v1/health-
GET:返回ocloudNotificationsAPI 的健康状况
-
9089 是在应用程序 Pod 中部署的 cloud-event-consumer 容器的默认端口。您可以根据需要为应用程序配置不同的端口。
api/ocloudNotifications/v1/subscriptions
HTTP 方法
GET api/ocloudNotifications/v1/subscriptions
描述
返回订阅列表。如果订阅存在,则返回 200 OK 状态代码以及订阅列表。
API 响应示例
[
 {
  "id": "ca11ab76-86f9-428c-8d3a-666c24e34d32",
  "endpointUri": "http://localhost:9089/api/ocloudNotifications/v1/dummy",
  "uriLocation": "http://localhost:8089/api/ocloudNotifications/v1/subscriptions/ca11ab76-86f9-428c-8d3a-666c24e34d32",
  "resource": "/cluster/node/openshift-worker-0.openshift.example.com/redfish/event"
 }
]
HTTP 方法
POST api/ocloudNotifications/v1/subscriptions
描述
创建新订阅。如果订阅成功创建,或者已存在,则返回 201 Created 状态代码。
表 9.1. 查询参数
| 参数 | 类型 |
|---|---|
| subscription | data |
有效负载示例
{
  "uriLocation": "http://localhost:8089/api/ocloudNotifications/v1/subscriptions",
  "resource": "/cluster/node/openshift-worker-0.openshift.example.com/redfish/event"
}
api/ocloudNotifications/v1/subscriptions/<subscription_id>
HTTP 方法
GET api/ocloudNotifications/v1/subscriptions/<subscription_id>
描述
返回 ID 为 <subscription_id> 的订阅详情
表 9.2. 查询参数
| 参数 | 类型 |
|---|---|
|
| string |
API 响应示例
{
  "id":"ca11ab76-86f9-428c-8d3a-666c24e34d32",
  "endpointUri":"http://localhost:9089/api/ocloudNotifications/v1/dummy",
  "uriLocation":"http://localhost:8089/api/ocloudNotifications/v1/subscriptions/ca11ab76-86f9-428c-8d3a-666c24e34d32",
  "resource":"/cluster/node/openshift-worker-0.openshift.example.com/redfish/event"
}
api/ocloudNotifications/v1/health/
HTTP 方法
GET api/ocloudNotifications/v1/health/
描述
返回 ocloudNotifications REST API 的健康状况。
API 响应示例
OK
9.6. 迁移消费者应用程序,以使用 PTP 或裸机事件的 HTTP 传输
如果您之前部署了 PTP 或裸机事件消费者应用程序,您需要更新应用程序以使用 HTTP 消息传输。
先决条件
-
已安装 OpenShift CLI(
oc)。 -
您已以具有
cluster-admin权限的用户身份登录。 - 您已将 PTP Operator 或 Bare Metal Event Relay 更新至使用 HTTP 传输的版本 4.13+。
流程
更新您的事件消费者应用以使用 HTTP 传输。为云事件 sidecar 部署设置
http-event-publishers变量。例如,在配置了 PTP 事件的集群中,以下 YAML 片断演示了一个云事件 sidecar 部署:
containers: - name: cloud-event-sidecar image: cloud-event-sidecar args: - "--metrics-addr=127.0.0.1:9091" - "--store-path=/store" - "--transport-host=consumer-events-subscription-service.cloud-events.svc.cluster.local:9043" - "--http-event-publishers=ptp-event-publisher-service-NODE_NAME.openshift-ptp.svc.cluster.local:9043" 1 - "--api-port=8089"- 1
- PTP Operator 会自动将
NODE_NAME解析为正在生成 PTP 事件的主机。例如,compute-1.example.com。
在配置了裸机事件的集群中,在云事件 sidecar 部署 CR 中将
http-event-publishers字段设置为hw-event-publisher-service.openshift-bare-metal-events.svc.cluster.local:9043。将
consumer-events-subscription-service服务与事件消费者应用程序一起部署。例如:apiVersion: v1 kind: Service metadata: annotations: prometheus.io/scrape: "true" service.alpha.openshift.io/serving-cert-secret-name: sidecar-consumer-secret name: consumer-events-subscription-service namespace: cloud-events labels: app: consumer-service spec: ports: - name: sub-port port: 9043 selector: app: consumer clusterIP: None sessionAffinity: None type: ClusterIP
第 10 章 巨页的作用及应用程序如何使用它们
10.1. 巨页的作用
内存在块(称为页)中进行管理。在大多数系统中,页的大小为 4Ki。1Mi 内存相当于 256 个页,1Gi 内存相当于 256,000 个页。CPU 有内置的内存管理单元,可在硬件中管理这些页的列表。Translation Lookaside Buffer (TLB) 是虚拟页到物理页映射的小型硬件缓存。如果在硬件指令中包括的虚拟地址可以在 TLB 中找到,则其映射信息可以被快速获得。如果没有包括在 TLN 中,则称为 TLB miss。系统将会使用基于软件的,速度较慢的地址转换机制,从而出现性能降低的问题。因为 TLB 的大小是固定的,因此降低 TLB miss 的唯一方法是增加页的大小。
巨页指一个大于 4Ki 的内存页。在 x86_64 构架中,有两个常见的巨页大小: 2Mi 和 1Gi。在其它构架上的大小会有所不同。要使用巨页,必须写相应的代码以便应用程序了解它们。Transparent Huge Pages(THP)试图在应用程序不需要了解的情况下自动管理巨页,但这个技术有一定的限制。特别是,它的页大小会被限为 2Mi。当有较高的内存使用率时,THP 可能会导致节点性能下降,或出现大量内存碎片(因为 THP 的碎片处理)导致内存页被锁定。因此,有些应用程序可能更适用于(或推荐)使用预先分配的巨页,而不是 THP。
在 OpenShift Container Platform 中,pod 中的应用程序可以分配并消耗预先分配的巨页。
10.2. 应用程序如何使用巨页
节点必须预先分配巨页以便节点报告其巨页容量。一个节点只能预先分配一个固定大小的巨页。
巨页可以使用名为 hugepages-<size> 的容器一级的资源需求被消耗。其中 size 是特定节点上支持的整数值的最精简的二进制标记。例如:如果某个节点支持 2048KiB 页大小,它将会有一个可调度的资源 hugepages-2Mi。与 CPU 或者内存不同,巨页不支持过量分配。
apiVersion: v1
kind: Pod
metadata:
  generateName: hugepages-volume-
spec:
  containers:
  - securityContext:
      privileged: true
    image: rhel7:latest
    command:
    - sleep
    - inf
    name: example
    volumeMounts:
    - mountPath: /dev/hugepages
      name: hugepage
    resources:
      limits:
        hugepages-2Mi: 100Mi 1
        memory: "1Gi"
        cpu: "1"
  volumes:
  - name: hugepage
    emptyDir:
medium: HugePages- 1
- 为
巨页指定要分配的准确内存数量。不要将这个值指定为巨页内存大小乘以页的大小。例如,巨页的大小为 2MB,如果应用程序需要使用由巨页组成的 100MB 的内存,则需要分配 50 个巨页。OpenShift Container Platform 会进行相应的计算。如上例所示,您可以直接指定100MB。
分配特定大小的巨页
有些平台支持多个巨页大小。要分配指定大小的巨页,在巨页引导命令参数前使用巨页大小选择参数hugepagesz=<size>。<size> 的值必须以字节为单位,并可以使用一个可选的后缀 [kKmMgG]。默认的巨页大小可使用 default_hugepagesz=<size> 引导参数定义。
巨页要求
- 巨页面请求必须等于限制。如果指定了限制,则它是默认的,但请求不是。
- 巨页在 pod 范围内被隔离。容器隔离功能计划在以后的版本中推出。
-
后端为巨页的
EmptyDir卷不能消耗大于 pod 请求的巨页内存。 -
通过带有
SHM_HUGETLB的shmget()来使用巨页的应用程序,需要运行一个匹配 proc/sys/vm/hugetlb_shm_group 的 supplemental 组。
10.3. 使用 Downward API 消耗巨页资源
您可以使用 Downward API 注入容器消耗的巨页资源的信息。
您可以将资源分配作为环境变量、卷插件或两者都注入。您在容器中开发和运行的应用可以通过读取指定卷中的环境变量或文件来确定可用的资源。
流程
创建一个类似以下示例的
hugepages-volume-pod.yaml文件:apiVersion: v1 kind: Pod metadata: generateName: hugepages-volume- labels: app: hugepages-example spec: containers: - securityContext: capabilities: add: [ "IPC_LOCK" ] image: rhel7:latest command: - sleep - inf name: example volumeMounts: - mountPath: /dev/hugepages name: hugepage - mountPath: /etc/podinfo name: podinfo resources: limits: hugepages-1Gi: 2Gi memory: "1Gi" cpu: "1" requests: hugepages-1Gi: 2Gi env: - name: REQUESTS_HUGEPAGES_1GI <.> valueFrom: resourceFieldRef: containerName: example resource: requests.hugepages-1Gi volumes: - name: hugepage emptyDir: medium: HugePages - name: podinfo downwardAPI: items: - path: "hugepages_1G_request" <.> resourceFieldRef: containerName: example resource: requests.hugepages-1Gi divisor: 1Gi<.> 指定从
requests.hugepages-1Gi读取资源使用,并将值公开为REQUESTS_HUGEPAGES_1GI环境变量。< .> 指定从requests.hugepages-1Gi读取资源使用,并将值公开为文件/etc/podinfo/hugepages_1G_request。从
hugepages-volume-pod.yaml文件创建 pod:$ oc create -f hugepages-volume-pod.yaml
验证
检查
REQUESTS_HUGEPAGES_1GI环境变量的值:$ oc exec -it $(oc get pods -l app=hugepages-example -o jsonpath='{.items[0].metadata.name}') \ -- env | grep REQUESTS_HUGEPAGES_1GI输出示例
REQUESTS_HUGEPAGES_1GI=2147483648
检查
/etc/podinfo/hugepages_1G_request文件的值:$ oc exec -it $(oc get pods -l app=hugepages-example -o jsonpath='{.items[0].metadata.name}') \ -- cat /etc/podinfo/hugepages_1G_request输出示例
2
10.4. 在引导时配置巨页
节点必须预先分配在 OpenShift Container Platform 集群中使用的巨页。保留巨页的方法有两种: 在引导时和在运行时。在引导时进行保留会增加成功的可能性,因为内存还没有很大的碎片。Node Tuning Operator 目前支持在特定节点上分配巨页。
流程
要减少节点重启的情况,请按照以下步骤顺序进行操作:
通过标签标记所有需要相同巨页设置的节点。
$ oc label node <node_using_hugepages> node-role.kubernetes.io/worker-hp=
创建一个包含以下内容的文件,并把它命名为
hugepages_tuning.yaml:apiVersion: tuned.openshift.io/v1 kind: Tuned metadata: name: hugepages 1 namespace: openshift-cluster-node-tuning-operator spec: profile: 2 - data: | [main] summary=Boot time configuration for hugepages include=openshift-node [bootloader] cmdline_openshift_node_hugepages=hugepagesz=2M hugepages=50 3 name: openshift-node-hugepages recommend: - machineConfigLabels: 4 machineconfiguration.openshift.io/role: "worker-hp" priority: 30 profile: openshift-node-hugepages
创建 Tuned
hugepages对象$ oc create -f hugepages-tuned-boottime.yaml
创建一个带有以下内容的文件,并把它命名为
hugepages-mcp.yaml:apiVersion: machineconfiguration.openshift.io/v1 kind: MachineConfigPool metadata: name: worker-hp labels: worker-hp: "" spec: machineConfigSelector: matchExpressions: - {key: machineconfiguration.openshift.io/role, operator: In, values: [worker,worker-hp]} nodeSelector: matchLabels: node-role.kubernetes.io/worker-hp: ""创建机器配置池:
$ oc create -f hugepages-mcp.yaml
因为有足够的非碎片内存,worker-hp 机器配置池中的所有节点现在都应分配 50 个 2Mi 巨页。
$ oc get node <node_using_hugepages> -o jsonpath="{.status.allocatable.hugepages-2Mi}"
100MiTuneD bootloader 插件只支持 Red Hat Enterprise Linux CoreOS (RHCOS) worker 节点。
10.5. 禁用透明巨页
Transparent Huge Pages (THP) 会试图自动执行创建、管理和使用巨页的大部分方面。由于 THP 自动管理巨页,因此并不始终对所有类型的工作负载进行最佳处理。THP 可能会导致性能下降,因为许多应用程序都自行处理巨页。因此,请考虑禁用 THP。以下步骤描述了如何使用 Node Tuning Operator (NTO)禁用 THP。
流程
使用以下内容创建文件,并将其命名为
thp-disable-tuned.yaml:apiVersion: tuned.openshift.io/v1 kind: Tuned metadata: name: thp-workers-profile namespace: openshift-cluster-node-tuning-operator spec: profile: - data: | [main] summary=Custom tuned profile for OpenShift to turn off THP on worker nodes include=openshift-node [vm] transparent_hugepages=never name: openshift-thp-never-worker recommend: - match: - label: node-role.kubernetes.io/worker priority: 25 profile: openshift-thp-never-worker创建 Tuned 对象:
$ oc create -f thp-disable-tuned.yaml
检查活跃配置集列表:
$ oc get profile -n openshift-cluster-node-tuning-operator
验证
登录到其中一个节点,并执行常规 THP 检查来验证节点是否成功应用了配置集:
$ cat /sys/kernel/mm/transparent_hugepage/enabled
输出示例
always madvise [never]
第 11 章 低延迟调整
11.1. 了解集群节点的低延迟调整
边缘计算在降低延迟和拥塞问题方面具有关键作用,提高了电信和 5G 网络应用程序的应用程序性能。维护具有最低延迟的网络架构是满足 5G 的网络性能要求的关键。对于 4G 技术,平均延迟为 50 ms,5G 的目标是达到 1 ms 或更小的延迟。这个对延迟的降低会将无线网络的吞吐量提高 10 倍。
11.1.1. 关于低延迟
很多在 Telco 空间部署的应用程序都需要低延迟,它们只能容忍零数据包丢失。针对零数据包丢失进行调节有助于缓解降低网络性能的固有问题。如需更多信息,请参阅 Red Hat OpenStack Platform(RHOSP)中的 Zero Packet Los 调节。
Edge 计算也可用于降低延迟率。将其想象成云边缘,并更接近用户。这可大大减少用户和远程数据中心之间的距离,从而减少应用程序响应时间和性能延迟。
管理员必须能够集中管理多个 Edge 站点和本地服务,以便所有部署都可以以最低的管理成本运行。它们还需要一个简便的方法来部署和配置其集群的某些节点,以实现实时低延迟和高性能目的。低延迟节点对于如 Cloud-native Network Functions(CNF)和 Data Plane Development Kit(DPDK) 等应用程序非常有用。
OpenShift Container Platform 目前提供在 OpenShift Container Platform 集群上调整软件的机制,以获取实时运行和低延迟时间(响应时间小于 20 微秒)。这包括调整内核和 OpenShift Container Platform 设置值、安装内核和重新配置机器。但是这个方法需要设置四个不同的 Operator,并执行很多配置,这些配置在手动完成时比较复杂,并容易出错。
OpenShift Container Platform 使用 Node Tuning Operator 实现自动性能优化,以实现 OpenShift Container Platform 应用程序的低延迟性能。集群管理员使用此性能配置集配置,这有助于以更可靠的方式进行更改。管理员可以指定是否要将内核更新至 kernel-rt,为集群和操作系统日常任务保留 CPU(包括 pod infra 容器),以及隔离 CPU,以便应用程序容器运行工作负载。
在 OpenShift Container Platform 4.14 中,如果您对集群应用性能配置集,则集群中的所有节点将重新引导。此重启包括 control plane 节点和不是由性能配置集为目标的 worker 节点。OpenShift Container Platform 4.14 中存在一个已知问题,因为本发行版本使用 Linux 控制组群版本 2 (cgroup v2) 与 RHEL 9 保持一致。与性能配置集关联的低延迟调整功能不支持 cgroup v2,因此节点重启以切回到 cgroup v1 配置。
要将集群中的所有节点恢复到 cgroups v2 配置,您必须编辑 Node 资源。(OCPBUGS-16976)
目前,cgroup v2 不支持禁用 CPU 负载均衡。因此,如果您启用了 cgroup v2,则可能无法从性能配置集中获取所需的行为。如果您使用 executeace 配置集,则不建议启用 cgroup v2。
OpenShift Container Platform 还支持 Node Tuning Operator 的工作负载提示,它可以微调 PerformanceProfile 以满足不同行业环境的需求。工作负载提示可用于 highPowerConsumption(以增加功耗为代价已实现非常低的延迟),以及 realtime(实现最佳延迟具有高优先级)。对于这些提示使用 true/false 设置的组合来处理特定于应用程序的工作负载配置文件和要求。
工作负载提示简化了行业扇区设置的性能微调。工作负载提示可以满足所有"大小"方法,而是可以将工作负载提示满足使用模式,例如将优先级放在:
- 低延迟
- 实时功能
- 有效地使用电源
理想情况下,所有前面列出的项目都会被优先选择。然而,优先其中一些项目可能会牺牲其他项目的优先级。Node Tuning Operator 现在可以了解工作负载预期并更好地满足工作负载的需求。集群管理员现在可以指定工作负载进入的用例。Node Tuning Operator 使用 PerformanceProfile 来微调工作负载的性能设置。
运行应用程序的环境会影响其行为。对于没有严格的延迟要求的典型数据中心,只需要最小默认调整,它会为某些高性能工作负载 pod 启用 CPU 分区。对于延迟具有更高的优先级的数据中心和工作负载,仍然会采取措施来优化功耗。最复杂的情况是接近对延迟非常敏感的设备的集群,如工厂中的制造设备,以及软件定义的无线电。最后一类部署通常被称为远边缘(Far edge)。对于远边缘部署,以下延迟是最终优先级,且牺牲电源管理。
11.1.2. 关于低延迟和实时应用程序的超线程
超线程是一个 Intel 处理器技术,它允许物理 CPU 处理器内核作为两个逻辑内核同时执行两个独立的线程。超线程可以为并行处理很有用的某些工作负载类型的系统吞吐量提供更好的系统吞吐量。默认的 OpenShift Container Platform 配置需要启用 Hyper-Threading。
对于电信领域的应用程序,设计您的应用程序架构非常重要,以尽量减小延迟。超线程会降低性能,并严重影响需要低延迟的计算负载的吞吐量。禁用超线程可确保性能的可预测性,并可减少这些工作负载的处理时间。
超线程实现和配置会因运行 OpenShift Container Platform 的硬件而异。如需了解特定于该硬件的超线程实现的更多详情,请参考相关的主机硬件调节信息。禁用超线程可以增加集群的每个内核的成本。
其他资源
11.2. 使用性能配置集调整节点以实现低延迟
使用集群性能配置集调整节点以实现低延迟。您可以限制 infra 和应用程序容器的 CPU,配置巨页、Hyper-Threading,并为对延迟敏感的进程配置 CPU 分区。
其他资源
11.2.1. 创建性能配置集
了解 Performance Profile Creator(PPC),以及如何使用它来创建性能配置集。
11.2.1.1. 关于性能配置集创建器
Performance Profile Creator (PPC) 是一个命令行工具,由 Node Tuning Operator 提供,用于创建性能配置集。该工具消耗来自集群的 must-gather 数据以及几个用户提供的配置集参数。PPC 生成适合您的硬件和拓扑的性能配置集。
该工具使用以下方法之一运行:
-
调用
podman - 调用一个打包程序脚本
11.2.1.2. 使用 must-gather 命令收集有关集群的数据
Performance Profile Creator(PPC)工具需要 must-gather 数据。作为集群管理员,运行 must-gather 命令来捕获集群的信息。
先决条件
-
使用具有
cluster-admin角色的用户访问集群。 -
已安装 OpenShift CLI(
oc)。
流程
可选:验证匹配的机器配置池是否存在标签:
$ oc describe mcp/worker-rt
输出示例
Name:         worker-rt
Namespace:
Labels:       machineconfiguration.openshift.io/role=worker-rt
如果匹配的标签不存在,为与 MCP 名称匹配的机器配置池(MCP) 添加标签:
$ oc label mcp <mcp_name> machineconfiguration.openshift.io/role=<mcp_name>
-
进入要存储
must-gather数据的目录。 运行以下命令来收集集群信息:
$ oc adm must-gather
可选:从
must-gather目录创建一个压缩文件:$ tar cvaf must-gather.tar.gz must-gather/
注意如果您正在运行性能配置集 Creator wrapper 脚本,则需要压缩输出。
11.2.1.3. 使用 Podman 运行 Performance Profile Creator
作为集群管理员,您可以运行 podman 和 Performance Profile Creator 来创建性能配置集。
先决条件
-
使用具有
cluster-admin角色的用户访问集群。 - 在裸机硬件上安装的集群。
-
安装了
podman和 OpenShift CLI(oc)的节点。 - 访问 Node Tuning Operator 镜像。
流程
检查机器配置池:
$ oc get mcp
输出示例
NAME         CONFIG                                                 UPDATED   UPDATING   DEGRADED   MACHINECOUNT   READYMACHINECOUNT   UPDATEDMACHINECOUNT   DEGRADEDMACHINECOUNT   AGE
master       rendered-master-acd1358917e9f98cbdb599aea622d78b       True      False      False      3              3                   3                     0                      22h
worker-cnf   rendered-worker-cnf-1d871ac76e1951d32b2fe92369879826   False     True       False      2              1                   1                     0                      22h
使用 Podman 向
registry.redhat.io进行身份验证:$ podman login registry.redhat.io
Username: <username>
Password: <password>
可选:显示 PPC 工具的帮助信息:
$ podman run --rm --entrypoint performance-profile-creator registry.redhat.io/openshift4/ose-cluster-node-tuning-operator:v4.15 -h
输出示例
A tool that automates creation of Performance Profiles

Usage:
  performance-profile-creator [flags]

Flags:
      --disable-ht                        Disable Hyperthreading
  -h, --help                              help for performance-profile-creator
      --info string                       Show cluster information; requires --must-gather-dir-path, ignore the other arguments. [Valid values: log, json] (default "log")
      --mcp-name string                   MCP name corresponding to the target machines (required)
      --must-gather-dir-path string       Must gather directory path (default "must-gather")
      --offlined-cpu-count int            Number of offlined CPUs
      --per-pod-power-management          Enable Per Pod Power Management
      --power-consumption-mode string     The power consumption mode.  [Valid values: default, low-latency, ultra-low-latency] (default "default")
      --profile-name string               Name of the performance profile to be created (default "performance")
      --reserved-cpu-count int            Number of reserved CPUs (required)
      --rt-kernel                         Enable Real Time Kernel (required)
      --split-reserved-cpus-across-numa   Split the Reserved CPUs across NUMA nodes
      --topology-manager-policy string    Kubelet Topology Manager Policy of the performance profile to be created. [Valid values: single-numa-node, best-effort, restricted] (default "restricted")
      --user-level-networking             Run with User level Networking(DPDK) enabled
以发现模式运行 Performance Profile Creator 工具:
注意发现模式使用
must-gather的输出来检查您的集群。生成的输出包括以下条件的信息:- 使用分配的 CPU ID 进行 NUMA 单元分区
- 是否启用了超线程
使用此信息,您可以为提供给 Performance Profile Creator 工具的部分参数设置适当的值。
$ podman run --entrypoint performance-profile-creator -v <path_to_must-gather>/must-gather:/must-gather:z registry.redhat.io/openshift4/ose-cluster-node-tuning-operator:v4.15 --info log --must-gather-dir-path /must-gather
注意此命令使用性能配置集创建器作为
podman的新入口点。它将主机的must-gather数据映射到容器镜像,并调用所需的用户提供的配置集参数来生成my-performance-profile.yaml文件。-v选项可以是以下组件之一的路径:-
must-gather输出目录 -
包含
must-gather解压缩的 .tar 文件的现有目录
info选项要求值指定输出格式。可能的值有 log 和 JSON。JSON 格式被保留用于调试。运行
podman:$ podman run --entrypoint performance-profile-creator -v /must-gather:/must-gather:z registry.redhat.io/openshift4/ose-cluster-node-tuning-operator:v4.15 --mcp-name=worker-cnf --reserved-cpu-count=4 --rt-kernel=true --split-reserved-cpus-across-numa=false --must-gather-dir-path /must-gather --power-consumption-mode=ultra-low-latency --offlined-cpu-count=6 > my-performance-profile.yaml
注意Performance Profile Creator 参数显示在 Performance Profile Creator 参数表中。需要以下参数:
-
reserved-cpu-count -
mcp-name -
rt-kernel
本例中的
mcp-name参数根据oc get mcp命令的输出设置为worker-cnf。对于单节点 OpenShift,请使用--mcp-name=master。-
查看创建的 YAML 文件:
$ cat my-performance-profile.yaml
输出示例
apiVersion: performance.openshift.io/v2
kind: PerformanceProfile
metadata:
  name: performance
spec:
  cpu:
    isolated: 2-39,48-79
    offlined: 42-47
    reserved: 0-1,40-41
  machineConfigPoolSelector:
    machineconfiguration.openshift.io/role: worker-cnf
  nodeSelector:
    node-role.kubernetes.io/worker-cnf: ""
  numa:
    topologyPolicy: restricted
  realTimeKernel:
    enabled: true
  workloadHints:
    highPowerConsumption: true
    realTime: true
应用生成的配置集:
$ oc apply -f my-performance-profile.yaml
其他资源
-
有关
must-gather工具的更多信息,请参阅收集集群的相关数据。
11.2.1.3.1. 如何运行 podman 创建性能配置集
以下示例演示了如何运行 podman 来创建具有 20 个保留 CPU 的性能配置集,这些 CPU 将在 NUMA 节点之间拆分。
节点硬件配置:
- 80 个 CPU
- 启用超线程
- 两个 NUMA 节点
- 编号为偶数的 CPU 在 NUMA 节点 0 上运行,编号为奇数的 CPU 在 NUMA 节点 1 上运行
运行 podman 以创建性能配置集:
$ podman run --entrypoint performance-profile-creator -v /must-gather:/must-gather:z registry.redhat.io/openshift4/ose-cluster-node-tuning-operator:v4.15 --mcp-name=worker-cnf --reserved-cpu-count=20 --rt-kernel=true --split-reserved-cpus-across-numa=true --must-gather-dir-path /must-gather > my-performance-profile.yaml
创建的配置集在以下 YAML 中描述:
  apiVersion: performance.openshift.io/v2
  kind: PerformanceProfile
  metadata:
    name: performance
  spec:
    cpu:
      isolated: 10-39,50-79
      reserved: 0-9,40-49
    nodeSelector:
      node-role.kubernetes.io/worker-cnf: ""
    numa:
      topologyPolicy: restricted
    realTimeKernel:
enabled: true在这种情况下,在 NUMA 节点 0 上保留 10 个 CPU,NUMA 节点 1 上保留 10 个 CPU。
11.2.1.3.2. 运行性能配置集 Creator wrapper 脚本
性能配置集打包程序脚本简化了性能配置文件 Creator(PPC)工具的运行。它隐藏了运行 podman 的复杂性并指定映射目录,它支持创建性能配置集。
先决条件
- 访问 Node Tuning Operator 镜像。
-
访问
must-gathertarball。
流程
在本地机器上创建一个文件,例如
run-perf-profile-creator.sh:$ vi run-perf-profile-creator.sh
将以下代码粘贴到文件中:
#!/bin/bash

readonly CONTAINER_RUNTIME=${CONTAINER_RUNTIME:-podman}
readonly CURRENT_SCRIPT=$(basename "$0")
readonly CMD="${CONTAINER_RUNTIME} run --entrypoint performance-profile-creator"
readonly IMG_EXISTS_CMD="${CONTAINER_RUNTIME} image exists"
readonly IMG_PULL_CMD="${CONTAINER_RUNTIME} image pull"
readonly MUST_GATHER_VOL="/must-gather"

NTO_IMG="registry.redhat.io/openshift4/ose-cluster-node-tuning-operator:v4.15"
MG_TARBALL=""
DATA_DIR=""

usage() {
  print "Wrapper usage:"
  print "  ${CURRENT_SCRIPT} [-h] [-p image][-t path] -- [performance-profile-creator flags]"
  print ""
  print "Options:"
  print "   -h                 help for ${CURRENT_SCRIPT}"
  print "   -p                 Node Tuning Operator image"
  print "   -t                 path to a must-gather tarball"

  ${IMG_EXISTS_CMD} "${NTO_IMG}" && ${CMD} "${NTO_IMG}" -h
}

function cleanup {
  [ -d "${DATA_DIR}" ] && rm -rf "${DATA_DIR}"
}
trap cleanup EXIT

exit_error() {
  print "error: $*"
  usage
  exit 1
}

print() {
  echo  "$*" >&2
}

check_requirements() {
  ${IMG_EXISTS_CMD} "${NTO_IMG}" || ${IMG_PULL_CMD} "${NTO_IMG}" || \
      exit_error "Node Tuning Operator image not found"

  [ -n "${MG_TARBALL}" ] || exit_error "Must-gather tarball file path is mandatory"
  [ -f "${MG_TARBALL}" ] || exit_error "Must-gather tarball file not found"

  DATA_DIR=$(mktemp -d -t "${CURRENT_SCRIPT}XXXX") || exit_error "Cannot create the data directory"
  tar -zxf "${MG_TARBALL}" --directory "${DATA_DIR}" || exit_error "Cannot decompress the must-gather tarball"
  chmod a+rx "${DATA_DIR}"

  return 0
}

main() {
  while getopts ':hp:t:' OPT; do
    case "${OPT}" in
      h)
        usage
        exit 0
        ;;
      p)
        NTO_IMG="${OPTARG}"
        ;;
      t)
        MG_TARBALL="${OPTARG}"
        ;;
      ?)
        exit_error "invalid argument: ${OPTARG}"
        ;;
    esac
  done
  shift $((OPTIND - 1))

  check_requirements || exit 1

  ${CMD} -v "${DATA_DIR}:${MUST_GATHER_VOL}:z" "${NTO_IMG}" "$@" --must-gather-dir-path "${MUST_GATHER_VOL}"
  echo "" 1>&2
}

main "$@"
为这个脚本中的每个人添加执行权限:
$ chmod a+x run-perf-profile-creator.sh
可选:显示
run-perf-profile-creator.sh命令用法:$ ./run-perf-profile-creator.sh -h
预期输出
Wrapper usage:
  run-perf-profile-creator.sh [-h] [-p image][-t path] -- [performance-profile-creator flags]

Options:
   -h                 help for run-perf-profile-creator.sh
   -p                 Node Tuning Operator image 1
   -t                 path to a must-gather tarball 2
A tool that automates creation of Performance Profiles

Usage:
  performance-profile-creator [flags]

Flags:
      --disable-ht                        Disable Hyperthreading
  -h, --help                              help for performance-profile-creator
      --info string                       Show cluster information; requires --must-gather-dir-path, ignore the other arguments. [Valid values: log, json] (default "log")
      --mcp-name string                   MCP name corresponding to the target machines (required)
      --must-gather-dir-path string       Must gather directory path (default "must-gather")
      --offlined-cpu-count int            Number of offlined CPUs
      --per-pod-power-management          Enable Per Pod Power Management
      --power-consumption-mode string     The power consumption mode.  [Valid values: default, low-latency, ultra-low-latency] (default "default")
      --profile-name string               Name of the performance profile to be created (default "performance")
      --reserved-cpu-count int            Number of reserved CPUs (required)
      --rt-kernel                         Enable Real Time Kernel (required)
      --split-reserved-cpus-across-numa   Split the Reserved CPUs across NUMA nodes
      --topology-manager-policy string    Kubelet Topology Manager Policy of the performance profile to be created. [Valid values: single-numa-node, best-effort, restricted] (default "restricted")
      --user-level-networking             Run with User level Networking(DPDK) enabled
注意有两个参数类型:
-
wrapper 参数,即
-h、-p和-t - PPC 参数
-
wrapper 参数,即
以发现模式运行性能配置集创建器工具:
注意发现模式使用
must-gather的输出来检查您的集群。生成的输出包括以下信息:- 使用分配的 CPU ID 进行 NUMA 单元分区
- 是否启用超线程
使用此信息,您可以为提供给 Performance Profile Creator 工具的部分参数设置适当的值。
$ ./run-perf-profile-creator.sh -t /must-gather/must-gather.tar.gz -- --info=log
注意info选项要求值指定输出格式。可能的值有 log 和 JSON。JSON 格式被保留用于调试。检查机器配置池:
$ oc get mcp
输出示例
NAME         CONFIG                                                 UPDATED   UPDATING   DEGRADED   MACHINECOUNT   READYMACHINECOUNT   UPDATEDMACHINECOUNT   DEGRADEDMACHINECOUNT   AGE
master       rendered-master-acd1358917e9f98cbdb599aea622d78b       True      False      False      3              3                   3                     0                      22h
worker-cnf   rendered-worker-cnf-1d871ac76e1951d32b2fe92369879826   False     True       False      2              1                   1                     0                      22h
创建性能配置集:
$ ./run-perf-profile-creator.sh -t /must-gather/must-gather.tar.gz -- --mcp-name=worker-cnf --reserved-cpu-count=2 --rt-kernel=true > my-performance-profile.yaml
注意Performance Profile Creator 参数显示在 Performance Profile Creator 参数表中。需要以下参数:
-
reserved-cpu-count -
mcp-name -
rt-kernel
本例中的
mcp-name参数根据oc get mcp命令的输出设置为worker-cnf。对于单节点 OpenShift,请使用--mcp-name=master。-
查看创建的 YAML 文件:
$ cat my-performance-profile.yaml
输出示例
apiVersion: performance.openshift.io/v2
kind: PerformanceProfile
metadata:
  name: performance
spec:
  cpu:
    isolated: 1-39,41-79
    reserved: 0,40
  nodeSelector:
    node-role.kubernetes.io/worker-cnf: ""
  numa:
    topologyPolicy: restricted
  realTimeKernel:
    enabled: false
应用生成的配置集:
注意在应用配置集前安装 Node Tuning Operator。
$ oc apply -f my-performance-profile.yaml
11.2.1.3.3. Performance Profile Creator 参数
表 11.1. Performance Profile Creator 参数
| 参数 | 描述 |
|---|---|
|
| 禁用超线程。
可能的值:
默认值: 警告
如果此参数设为 |
|
|
这会捕获集群信息,仅用于发现模式。发现模式还需要 可能的值:
默认: |
|
|
MCP 名称(如 |
|
| 必须收集目录路径。这个参数是必需的。
当用户使用 wrapper 脚本 |
|
| 离线 CPU 数量。 注意 这必须是一个大于 0 的自然数字。如果没有足够的逻辑处理器离线,则会记录错误消息。信息是: Error: failed to compute the reserved and isolated CPUs: please ensure that reserved-cpu-count plus offlined-cpu-count should be in the range [0,1] Error: failed to compute the reserved and isolated CPUs: please specify the offlined CPU count in the range [0,1] |
|
| 电源功耗模式。 可能的值:
默认: |
|
|
为每个 pod 电源管理启用。如果您将
可能的值:
默认值: |
|
|
要创建的性能配置集的名称。默认: |
|
| 保留 CPU 的数量。这个参数是必需的。 注意 这必须是一个自然数字。不允许使用 0 值。 |
|
| 启用实时内核。这个参数是必需的。
可能的值: |
|
| 将保留的 CPU 划分到 NUMA 节点。
可能的值:
默认值: |
|
| 要创建的性能配置集的 kubelet Topology Manager 策略。 可能的值:
默认: |
|
| 在启用了用户级别网络(DPDK)的情况下运行。
可能的值:
默认值: |
11.2.1.4. 参考性能配置集
使用以下引用性能配置集作为开发您自己的自定义配置集的基础。
11.2.1.4.1. 在 OpenStack 上使用 OVS-DPDK 的集群的性能配置集模板
要最大化使用 Open vSwitch 和 Red Hat OpenStack Platform(RHOSP)上的 Data Plane Development Kit(OVS-DPDK)的机器性能,您可以使用性能配置集。
您可以使用以下性能配置集模板为您的部署创建配置集。
使用 OVS-DPDK 的集群的性能配置集模板
apiVersion: performance.openshift.io/v2
kind: PerformanceProfile
metadata:
  name: cnf-performanceprofile
spec:
  additionalKernelArgs:
    - nmi_watchdog=0
    - audit=0
    - mce=off
    - processor.max_cstate=1
    - idle=poll
    - intel_idle.max_cstate=0
    - default_hugepagesz=1GB
    - hugepagesz=1G
    - intel_iommu=on
  cpu:
    isolated: <CPU_ISOLATED>
    reserved: <CPU_RESERVED>
  hugepages:
    defaultHugepagesSize: 1G
    pages:
      - count: <HUGEPAGES_COUNT>
        node: 0
        size: 1G
  nodeSelector:
    node-role.kubernetes.io/worker: ''
  realTimeKernel:
    enabled: false
    globallyDisableIrqLoadBalancing: true
插入适用于 CPU_ISOLATED、CPU_RESERVED 和 HUGEPAGES_COUNT 密钥的配置的值。
11.2.1.4.2. Telco RAN DU 参考设计性能配置集模板
以下性能配置集在商业硬件上配置 OpenShift Container Platform 集群的节点级性能设置,以托管电信 RAN DU 工作负载。
Telco RAN DU 参考设计性能配置集
apiVersion: performance.openshift.io/v2
kind: PerformanceProfile
metadata:
  # if you change this name make sure the 'include' line in TunedPerformancePatch.yaml
  # matches this name: include=openshift-node-performance-${PerformanceProfile.metadata.name}
  # Also in file 'validatorCRs/informDuValidator.yaml':
  # name: 50-performance-${PerformanceProfile.metadata.name}
  name: openshift-node-performance-profile
  annotations:
    ran.openshift.io/reference-configuration: "ran-du.redhat.com"
spec:
  additionalKernelArgs:
    - "rcupdate.rcu_normal_after_boot=0"
    - "efi=runtime"
    - "vfio_pci.enable_sriov=1"
    - "vfio_pci.disable_idle_d3=1"
    - "module_blacklist=irdma"
  cpu:
    isolated: $isolated
    reserved: $reserved
  hugepages:
    defaultHugepagesSize: $defaultHugepagesSize
    pages:
      - size: $size
        count: $count
        node: $node
  machineConfigPoolSelector:
    pools.operator.machineconfiguration.openshift.io/$mcp: ""
  nodeSelector:
    node-role.kubernetes.io/$mcp: ''
  numa:
    topologyPolicy: "restricted"
  # To use the standard (non-realtime) kernel, set enabled to false
  realTimeKernel:
    enabled: true
  workloadHints:
    # WorkloadHints defines the set of upper level flags for different type of workloads.
    # See https://github.com/openshift/cluster-node-tuning-operator/blob/master/docs/performanceprofile/performance_profile.md#workloadhints
    # for detailed descriptions of each item.
    # The configuration below is set for a low latency, performance mode.
    realTime: true
    highPowerConsumption: false
    perPodPowerManagement: false
11.2.1.4.3. 电信核心参考设计性能配置集模板
以下性能配置集在商业硬件上为 OpenShift Container Platform 集群配置节点级别的性能设置,以托管电信核心工作负载。
电信核心参考设计性能配置集
apiVersion: performance.openshift.io/v2
kind: PerformanceProfile
metadata:
  # if you change this name make sure the 'include' line in TunedPerformancePatch.yaml
  # matches this name: include=openshift-node-performance-${PerformanceProfile.metadata.name}
  # Also in file 'validatorCRs/informDuValidator.yaml':
  # name: 50-performance-${PerformanceProfile.metadata.name}
  name: openshift-node-performance-profile
  annotations:
    ran.openshift.io/reference-configuration: "ran-du.redhat.com"
spec:
  additionalKernelArgs:
    - "rcupdate.rcu_normal_after_boot=0"
    - "efi=runtime"
    - "vfio_pci.enable_sriov=1"
    - "vfio_pci.disable_idle_d3=1"
    - "module_blacklist=irdma"
  cpu:
    isolated: $isolated
    reserved: $reserved
  hugepages:
    defaultHugepagesSize: $defaultHugepagesSize
    pages:
      - size: $size
        count: $count
        node: $node
  machineConfigPoolSelector:
    pools.operator.machineconfiguration.openshift.io/$mcp: ""
  nodeSelector:
    node-role.kubernetes.io/$mcp: ''
  numa:
    topologyPolicy: "restricted"
  # To use the standard (non-realtime) kernel, set enabled to false
  realTimeKernel:
    enabled: true
  workloadHints:
    # WorkloadHints defines the set of upper level flags for different type of workloads.
    # See https://github.com/openshift/cluster-node-tuning-operator/blob/master/docs/performanceprofile/performance_profile.md#workloadhints
    # for detailed descriptions of each item.
    # The configuration below is set for a low latency, performance mode.
    realTime: true
    highPowerConsumption: false
    perPodPowerManagement: false
11.2.2. 支持的性能配置集 API 版本
Node Tuning Operator 在性能配置集 apiVersion 字段中支持 v2、v1 和 v1alpha1。v1 和 v1alpha1 API 相同。v2 API 包括一个可选的布尔值项 globallyDisableIrqLoadBalancing,默认值为 false。
升级性能配置集以使用设备中断处理
当您将 Node Tuning Operator 性能配置集自定义资源定义(CRD)从 v1 或 v1alpha1 升级到 v2 时,现有配置集会将 globallyDisableIrqLoadBalancing 设置为 true。
globallyDisableIrqLoadBalancing 切换用于 Isolated CPU 集是否禁用了 IRQ 负载均衡。当选项设置为 true 时,它会禁用 Isolated CPU 集的 IRQ 负载均衡。将选项设置为 false 允许在所有 CPU 之间平衡 IRQ。
将 Node Tuning Operator API 从 v1alpha1 升级到 v1
当将 Node Tuning Operator API 版本从 v1alpha1 升级到 v1 时,,v1alpha1 性能配置集会通过"None" Conversion 策略自行转换,并提供给带有 API 版本 v1 的 Performance Addon Operator。
将 Node Tuning Operator API 从 v1alpha1 或 v1 升级到 v2
当从旧的 Node Tuning Operator API 版本升级时,现有的 v1 和 v1alpha1 性能配置集将使用转换 Webhook 转换,它将注入 globallyDisableIrqLoadBalancing 字段,值为 true。
11.2.3. 使用工作负载提示配置节点功耗和实时处理
流程
-
按照 "Understanding workload hints" 的表,创建一个适合环境的硬件和拓扑的
PerformanceProfile。调整配置集以匹配预期的工作负载。在这个示例中,我们针对最低的延迟进行优化。 添加
highPowerConsumption和realTime工作负载提示。这里两者都设为true。apiVersion: performance.openshift.io/v2 kind: PerformanceProfile metadata: name: workload-hints spec: ... workloadHints: highPowerConsumption: true 1 realTime: true 2
当在性能配置集中将 realTime 工作负载 hint 标志设置为 true 时,将 cpu-quota.crio.io: disable 注解添加到带有固定 CPU 的每个保证 pod。此注解是防止 pod 中进程性能降级所必需的。如果没有显式设置 realTime 工作负载提示,则默认为 true。
下表描述了节能和实时设置对延迟的影响。
表 11.2. 节能和实时设置对延迟的影响
| 性能配置集创建器设置 | 提示 | 环境 | 描述 |
|---|---|---|---|
| Default(默认) |
workloadHints: highPowerConsumption: false realTime: false | 没有延迟要求的高吞吐量集群 | 仅通过 CPU 分区实现的性能。 |
| Low-latency |
workloadHints: highPowerConsumption: false realTime: true | 地区数据中心 | 节能和低延迟都需要考虑的:在电源管理、延迟和吞吐量之间进行妥当调节。 |
| Ultra-low-latency |
workloadHints: highPowerConsumption: true realTime: true | 对于远边缘集群,对延迟非常敏感的工作负载 | 实现最小延迟和最大确定性会增加电源消耗的成本。 |
| 每个 pod 电源管理 |
workloadHints: realTime: true highPowerConsumption: false perPodPowerManagement: true | 关键和非关键工作负载 | 允许每个 pod 进行电源管理。 |
11.2.4. 为运行 colocated 高和低优先级工作负载的节点配置节能
您可以为带有低优先级工作负载的节点实现节能,而不影响高优先级工作负载的延迟或吞吐量。无需修改工作负载本身即可进行节能。
Intel Ice Lake 及更新的 Intel CPU 支持该功能。处理器的功能可能会影响高优先级工作负载的延迟和吞吐量。
先决条件
- 您在 BIOS 中启用了 C-states 和操作系统控制的 P-states
流程
将
per-pod-power-management参数设置为true来生成PerformanceProfile:$ podman run --entrypoint performance-profile-creator -v \ /must-gather:/must-gather:z registry.redhat.io/openshift4/ose-cluster-node-tuning-operator:v4.15 \ --mcp-name=worker-cnf --reserved-cpu-count=20 --rt-kernel=true \ --split-reserved-cpus-across-numa=false --topology-manager-policy=single-numa-node \ --must-gather-dir-path /must-gather --power-consumption-mode=low-latency \ 1 --per-pod-power-management=true > my-performance-profile.yaml- 1
- 当
per-pod-power-management参数设置为true时,power-consumption-mode参数必须是default或low-latency。
带有
perPodPowerManagement的PerformanceProfile示例apiVersion: performance.openshift.io/v2 kind: PerformanceProfile metadata: name: performance spec: [.....] workloadHints: realTime: true highPowerConsumption: false perPodPowerManagement: true在
PerformanceProfile自定义资源(CR) 中将默认cpufreq调控器设置为附加内核参数:apiVersion: performance.openshift.io/v2 kind: PerformanceProfile metadata: name: performance spec: ... additionalKernelArgs: - cpufreq.default_governor=schedutil 1- 1
- 建议使用
schedutil管理器,但您可以使用其他监管器,如ondemand或powersavegovernors。
在
Tuned PerformancePatchCR 中设置最大 CPU 频率:spec: profile: - data: | [sysfs] /sys/devices/system/cpu/intel_pstate/max_perf_pct = <x> 1- 1
max_perf_pct控制cpufreq驱动程序的最大频率,以最大百分比的形式设置支持的 cpu 频率。这个值适用于所有 CPU。您可以检查/sys/devices/system/cpu/cpu0/cpufreq/cpuinfo_max_freq中的最大支持频率。作为起点,您可以使用以All Cores Turbo频率封装所有 CPU 的百分比。All Cores Turbo频率是所有内核在运行的频率,当内核完全占用时。
11.2.5. 为 infra 和应用程序容器限制 CPU
通用内务处理和工作负载任务使用 CPU 的方式可能会影响对延迟敏感的进程。默认情况下,容器运行时使用所有在线 CPU 一起运行所有容器,这可能导致上下文切换和延迟激增。对 CPU 进行分区可防止无状态进程通过相互分离来干扰对延迟敏感的进程。下表描述了在使用 Node Tuning Operator 调整节点后在 CPU 上运行的进程:
表 11.3. 进程的 CPU 分配
| 进程类型 | 详情 |
|---|---|
|
| 在除了运行低延迟工作负载外的任意 CPU 上运行 |
| 基础架构 pod | 在除了运行低延迟工作负载外的任意 CPU 上运行 |
| 中断 | 重定向到保留的 CPU(OpenShift Container Platform 4.7 及更新的版本中的可选) |
| 内核进程 | 固定保留的 CPU |
| 对延迟敏感的工作负载 pod | 固定到隔离池中的特定专用 CPU |
| OS 进程/systemd 服务 | 固定保留的 CPU |
在一个节点上的对于所有 QoS 进程类型( Burstable、BestEffort 或 Guaranteed )的 pod 的可分配容量等于隔离池的容量。保留池的容量已从节点的总内核容量中删除,供集群和操作系统日常任务使用。
示例 1
节点具有 100 个内核的容量。通过使用性能配置集,集群管理员将 50 个内核分配给隔离池,将 50 个内核分配给保留池。集群管理员为 QoS 为 BestEffort 或 Burstable 的 pod 分配 25 个内核,为 Guaranteed 的 pod 分配 25 个内核。这与隔离池的容量匹配。
示例 2
节点具有 100 个内核的容量。通过使用性能配置集,集群管理员将 50 个内核分配给隔离池,将 50 个内核分配给保留池。集群管理员为 QoS 为 BestEffort 或 Burstable 的 pod 分配一个内核,为 Guaranteed 的 pod 分配 50 个内核。这超过了隔离池容量一个内核。Pod 调度因为 CPU 容量不足而失败。
使用的确切分区模式取决于许多因素,如硬件、工作负载特性和预期的系统负载。以下是一些用例示例:
- 如果对延迟敏感的工作负载使用特定的硬件,如网络接口控制器(NIC),请确保隔离池中的 CPU 尽可能地与这个硬件接近。至少,您应该将工作负载放在同一个非统一内存访问 (NUMA) 节点中。
- 保留的池用于处理所有中断。根据系统网络,分配一个足够大小的保留池来处理所有传入的数据包中断。在 4.15 及更高版本中,工作负载可以选择性地被标记为敏感版本。
在决定哪些特定 CPU 用于保留和隔离分区时,需要详细分析和测量。设备和内存的 NUMA 紧密度等因素扮演了角色。选择也取决于工作负载架构和具体的用例。
保留和隔离的 CPU 池不得重叠,并且必须一起跨越 worker 节点中的所有可用内核。
为确保内务处理任务和工作负载不会相互干扰,请在性能配置集的 spec 部分指定两组 CPU。
-
isolated- 指定应用程序容器工作负载的 CPU。这些 CPU 的延迟最低。这个组中的进程没有中断,例如,可以达到更高的 DPDK 零数据包丢失带宽。 -
reserved- 为集群和操作系统日常任务指定 CPU。reserved组中的线程经常会比较繁忙。不要在reserved组中运行对延迟敏感的应用程序。对延迟敏感的应用程序在isolated组中运行。
流程
- 创建适合环境硬件和拓扑的性能配置集。
使用您想要为 infra 和应用程序容器保留和隔离的 CPU 添加
reserved和isolated参数:apiVersion: performance.openshift.io/v2 kind: PerformanceProfile metadata: name: infra-cpus spec: cpu: reserved: "0-4,9" 1 isolated: "5-8" 2 nodeSelector: 3 node-role.kubernetes.io/worker: ""
11.2.6. 为集群配置超线程
要为 OpenShift Container Platform 集群配置超线程,请将性能配置集中的 CPU 线程设置为为保留或隔离的 CPU 池配置的相同内核。
如果您配置了性能配置集,然后更改主机的超线程配置,请确保更新 PerformanceProfile YAML 中的 CPU isolated 和 reserved字段以匹配新配置。
禁用之前启用的主机超线程配置可能会导致 PerformanceProfile YAML 中列出的 CPU 内核 ID 错误。此不正确的配置可能会导致节点不可用,因为无法找到列出的 CPU。
先决条件
-
使用具有
cluster-admin角色的用户访问集群。 - 安装 OpenShift CLI(oc)。
流程
确定在您要配置的主机的 CPU 上运行哪些线程。
您可以通过登录到集群并运行以下命令来查看在主机 CPU 上运行哪些线程:
$ lscpu --all --extended
输出示例
CPU NODE SOCKET CORE L1d:L1i:L2:L3 ONLINE MAXMHZ    MINMHZ
0   0    0      0    0:0:0:0       yes    4800.0000 400.0000
1   0    0      1    1:1:1:0       yes    4800.0000 400.0000
2   0    0      2    2:2:2:0       yes    4800.0000 400.0000
3   0    0      3    3:3:3:0       yes    4800.0000 400.0000
4   0    0      0    0:0:0:0       yes    4800.0000 400.0000
5   0    0      1    1:1:1:0       yes    4800.0000 400.0000
6   0    0      2    2:2:2:0       yes    4800.0000 400.0000
7   0    0      3    3:3:3:0       yes    4800.0000 400.0000
在这个示例中,在四个物理 CPU 内核中运行了八个逻辑 CPU 内核。CPU0 和 CPU4 在物理 Core0 中运行,CPU1 和 CPU5 在物理 Core 1 中运行,以此类推。
另外要查看为特定物理 CPU 内核设定的线程(以下示例中的
cpu0),打开命令提示符并运行以下命令:$ cat /sys/devices/system/cpu/cpu0/topology/thread_siblings_list
输出示例
0-4
在
PerformanceProfileYAML 中应用隔离和保留的 CPU。例如,您可以将逻辑内核 CPU0 和 CPU4 设置为isolated;将逻辑内核 CPU1 到 CPU3 以及 CPU5 到 CPU7 设置为reserved。当您配置保留的和隔离的 CPU 时,pod 中的 infra 容器将使用保留的 CPU,应用程序容器则使用隔离的 CPU。... cpu: isolated: 0,4 reserved: 1-3,5-7 ...注意保留和隔离的 CPU 池不得重叠,并且必须一起跨越 worker 节点中的所有可用内核。
大多数 Intel 处理器上默认启用超线程。如果启用超线程,特定内核处理的所有线程都必须被隔离或者在同一个内核中处理。
启用超线程后,所有保证的 pod 都必须使用多个 SMT (simultaneous multi-threading)级别,以避免造成 "noisy neighbor" 的情况并导致 pod 失败。如需更多信息,请参阅静态策略选项。
11.2.6.1. 为低延迟应用程序禁用超线程
在为低延迟进程配置集群时,请考虑是否要在部署集群前禁用超线程。要禁用 Hyper-Threading,请执行以下步骤:
- 创建一个适合您的硬件和拓扑的性能配置集。
将
nosmt设为附加内核参数。以下示例的性能配置集演示了此设置:apiVersion: performance.openshift.io/v2 kind: PerformanceProfile metadata: name: example-performanceprofile spec: additionalKernelArgs: - nmi_watchdog=0 - audit=0 - mce=off - processor.max_cstate=1 - idle=poll - intel_idle.max_cstate=0 - nosmt cpu: isolated: 2-3 reserved: 0-1 hugepages: defaultHugepagesSize: 1G pages: - count: 2 node: 0 size: 1G nodeSelector: node-role.kubernetes.io/performance: '' realTimeKernel: enabled: true注意当您配置保留的和隔离的 CPU 时,pod 中的 infra 容器将使用保留的 CPU,应用程序容器则使用隔离的 CPU。
11.2.7. 管理设备中断处理保证 pod 隔离 CPU
Node Tuning Operator 可以通过将主机 CPU 划分为保留的 CPU 来管理主机 CPU,以进行集群和操作系统日常任务(包括 pod infra 容器),以及用于应用程序容器运行工作负载的隔离 CPU。这可让您将低延迟工作负载的 CPU 设置为隔离状态。
设备中断在所有隔离和保留 CPU 之间平衡负载,以避免出现 CPU 超载问题,但运行有保证 pod 的 CPU 除外。当为 pod 设置相关注解时,保证 pod CPU 无法处理设备中断。
在性能配置集中,globallyDisableIrqLoadBalancing 用于管理设备中断是否被处理。对于某些工作负载,保留 CPU 并不总是足以处理设备中断,因此不会在隔离的 CPU 上禁用设备中断。默认情况下,Node Tuning Operator 不会禁用隔离 CPU 上的设备中断。
11.2.7.1. 为节点查找有效的 IRQ 关联性设置
有些 IRQ 控制器缺少对 IRQ 关联性设置的支持,并将始终将所有在线 CPU 公开为 IRQ 掩码。这些 IRQ 控制器在 CPU 0 上运行。
以下是红帽了解对 IRQ 关联性设置的支持的驱动程序和硬件示例。以下是相关的列表(并没有包括所有):
-
一些 RAID 控制器驱动程序,如
megaraid_sas - 许多非易失性内存表达 (NVMe) 驱动程序
- 主板 (LOM) 网络控制器上的一些 LAN
-
驱动程序使用
managed_irqs
不支持 IRQ 关联性设置的原因可能与主板中的处理器类型、IRI 控制器或断路器连接等因素相关。
如果任何 IRQ 的有效关联性被设置为一个隔离的 CPU,则可能代表一些硬件或驱动程序不支持 IRQ 关联性设置。要查找有效的关联性,请登录到主机并运行以下命令:
$ find /proc/irq -name effective_affinity -printf "%p: " -exec cat {} \;输出示例
/proc/irq/0/effective_affinity: 1
/proc/irq/1/effective_affinity: 8
/proc/irq/2/effective_affinity: 0
/proc/irq/3/effective_affinity: 1
/proc/irq/4/effective_affinity: 2
/proc/irq/5/effective_affinity: 1
/proc/irq/6/effective_affinity: 1
/proc/irq/7/effective_affinity: 1
/proc/irq/8/effective_affinity: 1
/proc/irq/9/effective_affinity: 2
/proc/irq/10/effective_affinity: 1
/proc/irq/11/effective_affinity: 1
/proc/irq/12/effective_affinity: 4
/proc/irq/13/effective_affinity: 1
/proc/irq/14/effective_affinity: 1
/proc/irq/15/effective_affinity: 1
/proc/irq/24/effective_affinity: 2
/proc/irq/25/effective_affinity: 4
/proc/irq/26/effective_affinity: 2
/proc/irq/27/effective_affinity: 1
/proc/irq/28/effective_affinity: 8
/proc/irq/29/effective_affinity: 4
/proc/irq/30/effective_affinity: 4
/proc/irq/31/effective_affinity: 8
/proc/irq/32/effective_affinity: 8
/proc/irq/33/effective_affinity: 1
/proc/irq/34/effective_affinity: 2
有些驱动程序使用 managed_irqs,其关联性由内核在内部管理,用户空间无法更改关联性。在某些情况下,这些 IRQ 可能会分配给隔离的 CPU。有关 managed_irqs 的更多信息,请参阅 无法更改受管中断的关联性,即使它们目标隔离 CPU。
11.2.7.2. 配置节点中断关联性
为 IRQ 动态负载平衡配置集群节点,以控制哪些内核可以接收设备中断请求 (IRQ)。
先决条件
- 对于内核隔离,所有服务器硬件组件都必须支持 IRQ 关联性。要检查服务器的硬件组件是否支持 IRQ 关联性,请查看服务器的硬件规格或联系您的硬件供应商。
流程
- 以具有 cluster-admin 权限的用户身份登录 OpenShift Container Platform 集群。
-
将性能配置集
apiVersion设置为使用performance.openshift.io/v2。 -
删除
globallyDisableIrqLoadBalancing字段,或把它设置为false。 设置适当的隔离 CPU 和保留的 CPU。以下片段演示了保留 2 个 CPU 的配置集。对于在
isolatedCPU 集中运行的 pod,启用 IRQ 负载均衡:apiVersion: performance.openshift.io/v2 kind: PerformanceProfile metadata: name: dynamic-irq-profile spec: cpu: isolated: 2-5 reserved: 0-1 ...注意当您配置保留和隔离的 CPU、操作系统进程、内核进程和 systemd 服务在保留 CPU 上运行时。基础架构 pod 在任何 CPU 上运行,但运行低延迟工作负载除外。低延迟工作负载 pod 在隔离池中的专用 CPU 上运行。如需更多信息,请参阅"为 infra 和应用程序容器限制 CPU"。
11.2.8. 配置巨页
节点必须预先分配在 OpenShift Container Platform 集群中使用的巨页。使用 Node Tuning Operator 在特定节点中分配巨页。
OpenShift Container Platform 提供了创建和分配巨页的方法。Node Tuning Operator 提供了一种更易于使用性能配置集的方法。
例如,在性能配置集的 hugepages pages 部分,您可以指定多个块的 size、count 以及可选的 node:
hugepages:
   defaultHugepagesSize: "1G"
   pages:
   - size:  "1G"
     count:  4
node: 0 1- 1
node是分配巨页的 NUMA 节点。如果省略了node,该页面将平均分布在所有 NUMA 节点中。
等待显示更新已完成的相关机器配置池状态。
这些是分配巨页的唯一配置步骤。
验证
要验证配置,请查看节点上的
/proc/meminfo文件:$ oc debug node/ip-10-0-141-105.ec2.internal
# grep -i huge /proc/meminfo
输出示例
AnonHugePages:    ###### ##
ShmemHugePages:        0 kB
HugePages_Total:       2
HugePages_Free:        2
HugePages_Rsvd:        0
HugePages_Surp:        0
Hugepagesize:       #### ##
Hugetlb:            #### ##
使用
oc describe报告新大小:$ oc describe node worker-0.ocp4poc.example.com | grep -i huge
输出示例
                                   hugepages-1g=true
 hugepages-###:  ###
 hugepages-###:  ###
11.2.8.1. 分配多个巨页大小
您可以在同一容器下请求具有不同大小的巨页。这样,您可以定义由具有不同巨页大小的容器组成的更复杂的 pod。
例如,您可以把大小定义为 1G 和 2M,Node Tuning Operator 会在节点上配置这两个大小,如下所示:
spec:
  hugepages:
    defaultHugepagesSize: 1G
    pages:
    - count: 1024
      node: 0
      size: 2M
    - count: 4
      node: 1
      size: 1G
11.2.9. 使用 Node Tuning Operator 减少 NIC 队列
Node Tuning Operator 有助于减少 NIC 队列以提高性能。使用性能配置集进行调整,允许为不同的网络设备自定义队列。
11.2.9.1. 使用性能配置集调整 NIC 队列
通过性能配置集,您可以调整每个网络设备的队列计数。
支持的网络设备:
- 非虚拟网络设备
- 支持多个队列的网络设备(通道)
不支持的网络设备:
- 纯软件网络接口
- 块设备
- Intel DPDK 虚拟功能
先决条件
-
使用具有
cluster-admin角色的用户访问集群。 -
安装 OpenShift CLI(
oc)。
流程
-
以具有
cluster-admin权限的用户身份登录运行 Node Tuning Operator 的 OpenShift Container Platform 集群。 - 创建并应用适合您的硬件和拓扑的性能配置集。有关创建配置集的指南,请参阅"创建性能配置集"部分。
编辑这个创建的性能配置集:
$ oc edit -f <your_profile_name>.yaml
使用
net对象填充spec字段。对象列表可以包含两个字段:-
userLevelNetworking是一个必需字段,指定为布尔值标记。如果userLevelNetworking为true,则队列数将设置为所有支持设备的保留 CPU 计数。默认值为false。 devices是一个可选字段,指定队列设置为保留 CPU 数的设备列表。如果设备列表为空,则配置适用于所有网络设备。配置如下:interfaceName:此字段指定接口名称,并支持 shell 样式的通配符,可以是正数或负数。-
通配符语法示例如下:
<string> .* -
负规则的前缀为感叹号。要将网络队列更改应用到排除列表以外的所有设备,请使用
!<device>。例如!eno1。
-
通配符语法示例如下:
-
vendorID:网络设备供应商 ID,以带有0x前缀的 16 位十六进制数字代表。 deviceID:网络设备 ID(model),以带有0x前缀的 16 位十六进制数字代表。注意当指定
deviceID时,还必须定义vendorID。与设备条目interfaceName、vendorID或vendorID加deviceID中指定的所有设备标识符相匹配的设备会被视为一个网络设备。然后,此网络设备的 net 队列数设置为保留的 CPU 计数。当指定了两个或多个设备时,网络队列数将设置为与其中一个设备匹配的任何网络设备。
-
使用此示例性能配置集将所有设备的队列数设置为保留的 CPU 计数:
apiVersion: performance.openshift.io/v2
kind: PerformanceProfile
metadata:
  name: manual
spec:
  cpu:
    isolated: 3-51,55-103
    reserved: 0-2,52-54
  net:
    userLevelNetworking: true
  nodeSelector:
    node-role.kubernetes.io/worker-cnf: ""
使用这个示例性能配置集,将所有与任何定义的设备标识符匹配的保留 CPU 数设置为保留的 CPU 计数:
apiVersion: performance.openshift.io/v2
kind: PerformanceProfile
metadata:
  name: manual
spec:
  cpu:
    isolated: 3-51,55-103
    reserved: 0-2,52-54
  net:
    userLevelNetworking: true
    devices:
    - interfaceName: "eth0"
    - interfaceName: "eth1"
    - vendorID: "0x1af4"
      deviceID: "0x1000"
  nodeSelector:
    node-role.kubernetes.io/worker-cnf: ""
使用这个示例性能配置集,将所有以接口名称
eth开头的设备的队列数设置为保留的 CPU 计数:apiVersion: performance.openshift.io/v2 kind: PerformanceProfile metadata: name: manual spec: cpu: isolated: 3-51,55-103 reserved: 0-2,52-54 net: userLevelNetworking: true devices: - interfaceName: "eth*" nodeSelector: node-role.kubernetes.io/worker-cnf: ""使用这个示例性能配置集。将所有设备的队列数设置为保留的 CPU 计数,该接口具有
eno1以外的任何接口:apiVersion: performance.openshift.io/v2 kind: PerformanceProfile metadata: name: manual spec: cpu: isolated: 3-51,55-103 reserved: 0-2,52-54 net: userLevelNetworking: true devices: - interfaceName: "!eno1" nodeSelector: node-role.kubernetes.io/worker-cnf: ""使用这个示例性能配置集,将所有具有接口名称
eth0,vendorID为0x1af4、deviceID为0x1000的设备的队列数设置为保留 CPU 数:apiVersion: performance.openshift.io/v2 kind: PerformanceProfile metadata: name: manual spec: cpu: isolated: 3-51,55-103 reserved: 0-2,52-54 net: userLevelNetworking: true devices: - interfaceName: "eth0" - vendorID: "0x1af4" deviceID: "0x1000" nodeSelector: node-role.kubernetes.io/worker-cnf: ""应用更新的性能配置集:
$ oc apply -f <your_profile_name>.yaml
其他资源
11.2.9.2. 验证队列状态
在这一部分中,一些示例演示了不同的性能配置集以及如何验证是否应用了更改。
示例 1
在本例中,网络队列数为所有支持的设备设置为保留 CPU 数(2)。
性能配置集中的相关部分是:
apiVersion: performance.openshift.io/v2
metadata:
  name: performance
spec:
  kind: PerformanceProfile
  spec:
    cpu:
      reserved: 0-1  #total = 2
      isolated: 2-8
    net:
      userLevelNetworking: true
# ...
使用以下命令显示与设备关联的队列状态:
注意在应用了性能配置集的节点中运行这个命令。
$ ethtool -l <device>
在应用配置集前验证队列状态:
$ ethtool -l ens4
输出示例
Channel parameters for ens4:
Pre-set maximums:
RX:         0
TX:         0
Other:      0
Combined:   4
Current hardware settings:
RX:         0
TX:         0
Other:      0
Combined:   4
应用配置集后验证队列状态:
$ ethtool -l ens4
输出示例
Channel parameters for ens4:
Pre-set maximums:
RX:         0
TX:         0
Other:      0
Combined:   4
Current hardware settings:
RX:         0
TX:         0
Other:      0
Combined:   2 1
- 1
- 该组合通道显示为所有支持的设备保留 CPU 的总数为 2。这与性能配置集中配置的内容匹配。
示例 2
在本例中,针对具有特定 vendorID 的所有受支持的网络设备,网络队列数设置为保留 CPU 数(2)。
性能配置集中的相关部分是:
apiVersion: performance.openshift.io/v2
metadata:
  name: performance
spec:
  kind: PerformanceProfile
  spec:
    cpu:
      reserved: 0-1  #total = 2
      isolated: 2-8
    net:
      userLevelNetworking: true
      devices:
      - vendorID = 0x1af4
# ...
使用以下命令显示与设备关联的队列状态:
注意在应用了性能配置集的节点中运行这个命令。
$ ethtool -l <device>
应用配置集后验证队列状态:
$ ethtool -l ens4
输出示例
Channel parameters for ens4:
Pre-set maximums:
RX:         0
TX:         0
Other:      0
Combined:   4
Current hardware settings:
RX:         0
TX:         0
Other:      0
Combined:   2 1
- 1
- 带有
vendorID=0x1af4的所有支持设备的预留 CPU 总数为 2。例如,如果存在另一个网络设备ens2,其vendorID=0x1af4也具有总计的网络队列为 2。这与性能配置集中配置的内容匹配。
示例 3
在本例中,针对与任何定义的设备标识符匹配的所有受支持网络设备,网络队列数设置为保留 CPU 数(2)。
命令 udevadm info 提供了有关设备的详细报告。在这个示例中,设备是:
# udevadm info -p /sys/class/net/ens4
...
E: ID_MODEL_ID=0x1000
E: ID_VENDOR_ID=0x1af4
E: INTERFACE=ens4
...
# udevadm info -p /sys/class/net/eth0
...
E: ID_MODEL_ID=0x1002
E: ID_VENDOR_ID=0x1001
E: INTERFACE=eth0
...
对于
interfaceName等于eth0的设备,以及具有vendorID=0x1af4的设备,并使用以下性能配置集,将网络队列设置为 2:apiVersion: performance.openshift.io/v2 metadata: name: performance spec: kind: PerformanceProfile spec: cpu: reserved: 0-1 #total = 2 isolated: 2-8 net: userLevelNetworking: true devices: - interfaceName = eth0 - vendorID = 0x1af4 ...应用配置集后验证队列状态:
$ ethtool -l ens4
输出示例
Channel parameters for ens4: Pre-set maximums: RX: 0 TX: 0 Other: 0 Combined: 4 Current hardware settings: RX: 0 TX: 0 Other: 0 Combined: 2 1- 1
- 带有
vendorID=0x1af4的所有支持设备的预留 CPU 总数设置为 2。例如,如果存在另一个带有vendorID=0x1af4的网络设备ens2,则其总子网队列也将设置为 2。类似地,interfaceName等于eth0的设备会将总网络队列设置为 2。
11.2.9.3. 与调整 NIC 队列关联的日志记录
详细说明所分配设备的日志消息记录在相应的 Tuned 守护进程日志中。以下信息可能会记录到 /var/log/tuned/tuned.log 文件中:
记录了一个
INFO信息,详细描述了成功分配的设备:INFO tuned.plugins.base: instance net_test (net): assigning devices ens1, ens2, ens3
如果无法分配任何设备,则会记录
WARNING信息:WARNING tuned.plugins.base: instance net_test: no matching devices available
11.3. 置备实时和低延迟工作负载
许多企业需要高性能计算和低可预测延迟,特别是在金融和电信行业中。
OpenShift Container Platform 提供 Node Tuning Operator 来实现自动性能优化,以便为 OpenShift Container Platform 应用程序实现低延迟性能和响应时间。您可以使用性能配置集配置进行这些更改。您可以将内核更新至 kernel-rt,为集群和操作系统日常任务保留 CPU,包括 pod infra 容器,为应用程序容器隔离 CPU 来运行工作负载,并禁用未使用的 CPU 来减少功耗。
在编写应用程序时,请遵循 RHEL for Real Time 进程和线程中介绍的常规建议。
其他资源
11.3.1. 将低延迟工作负载调度到具有实时功能的 worker
您可以将低延迟工作负载调度到应用实时功能的 worker 节点上。
要将工作负载调度到特定的节点上,请使用 Pod 自定义资源(CR)中的标签选择器。标签选择器必须与附加到机器配置池的节点匹配,这些池是为低延迟配置的。
先决条件
-
已安装 OpenShift CLI(
oc)。 -
您已以具有
cluster-admin权限的用户身份登录。 - 您已在集群中应用了性能配置集,用于针对低延迟工作负载调整 worker 节点。
流程
为低延迟工作负载创建
PodCR,并在集群中应用它,例如:配置为使用实时处理的
Pod规格示例apiVersion: v1 kind: Pod metadata: name: dynamic-low-latency-pod annotations: cpu-quota.crio.io: "disable" 1 cpu-load-balancing.crio.io: "disable" 2 irq-load-balancing.crio.io: "disable" 3 spec: securityContext: runAsNonRoot: true seccompProfile: type: RuntimeDefault containers: - name: dynamic-low-latency-pod image: "registry.redhat.io/openshift4/cnf-tests-rhel8:v4.15" command: ["sleep", "10h"] resources: requests: cpu: 2 memory: "200M" limits: cpu: 2 memory: "200M" securityContext: allowPrivilegeEscalation: false capabilities: drop: [ALL] nodeSelector: node-role.kubernetes.io/worker-cnf: "" 4 runtimeClassName: performance-dynamic-low-latency-profile 5 # ...-
以 performance-<profile_name> 格式输入 pod
runtimeClassName,其中 <profile_name> 是来自PerformanceProfileYAML 中的名称。在上例中,名称是performance-dynamic-low-latency-profile。 确保 pod 正确运行。状态应该为
running,并应正确设置了 cnf-worker 节点:$ oc get pod -o wide
预期输出
NAME                     READY   STATUS    RESTARTS   AGE     IP           NODE
dynamic-low-latency-pod  1/1     Running   0          5h33m   10.131.0.10  cnf-worker.example.com
获取为 IRQ 动态负载均衡配置的 pod 运行 CPU:
$ oc exec -it dynamic-low-latency-pod -- /bin/bash -c "grep Cpus_allowed_list /proc/self/status | awk '{print $2}'"预期输出
Cpus_allowed_list: 2-3
验证
确保正确应用节点配置。
登录节点以验证配置。
$ oc debug node/<node-name>
验证可以使用节点文件系统:
sh-4.4# chroot /host
预期输出
sh-4.4#
确保默认系统 CPU 关联性掩码不包括
dynamic-low-latency-podCPU,如 CPU 2 和 3。sh-4.4# cat /proc/irq/default_smp_affinity
输出示例
33
确定系统 IRQ 没有配置为在
dynamic-low-latency-podCPU 上运行:sh-4.4# find /proc/irq/ -name smp_affinity_list -exec sh -c 'i="$1"; mask=$(cat $i); file=$(echo $i); echo $file: $mask' _ {} \;输出示例
/proc/irq/0/smp_affinity_list: 0-5
/proc/irq/1/smp_affinity_list: 5
/proc/irq/2/smp_affinity_list: 0-5
/proc/irq/3/smp_affinity_list: 0-5
/proc/irq/4/smp_affinity_list: 0
/proc/irq/5/smp_affinity_list: 0-5
/proc/irq/6/smp_affinity_list: 0-5
/proc/irq/7/smp_affinity_list: 0-5
/proc/irq/8/smp_affinity_list: 4
/proc/irq/9/smp_affinity_list: 4
/proc/irq/10/smp_affinity_list: 0-5
/proc/irq/11/smp_affinity_list: 0
/proc/irq/12/smp_affinity_list: 1
/proc/irq/13/smp_affinity_list: 0-5
/proc/irq/14/smp_affinity_list: 1
/proc/irq/15/smp_affinity_list: 0
/proc/irq/24/smp_affinity_list: 1
/proc/irq/25/smp_affinity_list: 1
/proc/irq/26/smp_affinity_list: 1
/proc/irq/27/smp_affinity_list: 5
/proc/irq/28/smp_affinity_list: 1
/proc/irq/29/smp_affinity_list: 0
/proc/irq/30/smp_affinity_list: 0-5
当您调整节点以实现低延迟时,执行探测与需要保证 CPU 的应用程序一起使用可能会导致延迟激增。使用其他探测(如正确配置的一组网络探测作为替代方案)。
11.3.2. 创建具有保证 QoS 类的 pod
在创建带有 Guaranteed 类的 QoS 类的 pod 时请注意以下几点:
- pod 中的每个容器都必须具有内存限制和内存请求,且它们必须相同。
- pod 中的每个容器都必须具有 CPU 限制和 CPU 请求,且它们必须相同。
以下示例显示了一个容器的 pod 的配置文件。容器设置了内存限制和内存请求,均为 200 MiB。容器具有 CPU 限制和 CPU 请求,均为 1 CPU。
apiVersion: v1
kind: Pod
metadata:
  name: qos-demo
  namespace: qos-example
spec:
  securityContext:
    runAsNonRoot: true
    seccompProfile:
      type: RuntimeDefault
  containers:
  - name: qos-demo-ctr
    image: <image-pull-spec>
    resources:
      limits:
        memory: "200Mi"
        cpu: "1"
      requests:
        memory: "200Mi"
        cpu: "1"
    securityContext:
      allowPrivilegeEscalation: false
      capabilities:
        drop: [ALL]
创建 pod:
$ oc apply -f qos-pod.yaml --namespace=qos-example
查看有关 pod 的详细信息:
$ oc get pod qos-demo --namespace=qos-example --output=yaml
输出示例
spec: containers: ... status: qosClass: Guaranteed注意如果您为容器指定了内存限值,但没有指定内存请求,OpenShift Container Platform 会自动分配与限制匹配的内存请求。同样,如果您为容器指定 CPU 限值,但没有指定 CPU 请求,OpenShift Container Platform 会自动分配与限制匹配的 CPU 请求。
11.3.3. 在 Pod 中禁用 CPU 负载均衡
禁用或启用 CPU 负载均衡的功能在 CRI-O 级别实现。CRI-O 下的代码仅在满足以下要求时禁用或启用 CPU 负载均衡。
pod 必须使用
performance-<profile-name>运行时类。您可以通过查看性能配置集的状态来获得正确的名称,如下所示:apiVersion: performance.openshift.io/v2 kind: PerformanceProfile ... status: ... runtimeClass: performance-manual
目前,cgroup v2 不支持禁用 CPU 负载均衡。
Node Tuning Operator 负责在相关节点下创建高性能运行时处理器配置片断,并在集群下创建高性能运行时类。它将具有与默认运行时处理程序相同的内容,但它启用了 CPU 负载均衡配置功能。
要禁用 pod 的 CPU 负载均衡,Pod 规格必须包括以下字段:
apiVersion: v1
kind: Pod
metadata:
  #...
  annotations:
    #...
    cpu-load-balancing.crio.io: "disable"
    #...
  #...
spec:
  #...
  runtimeClassName: performance-<profile_name>
#...仅在启用了 CPU 管理器静态策略,以及带有保证 QoS 使用整个 CPU 的 pod 时,禁用 CPU 负载均衡。否则,禁用 CPU 负载均衡会影响集群中其他容器的性能。
11.3.4. 为高优先级 pod 禁用节能模式
您可以配置 pod,以确保在为工作负载运行的节点配置节能时,高优先级工作负载不受影响。
当您使用节能配置配置节点时,您必须使用 pod 级别的性能配置高优先级工作负载,这意味着配置适用于 pod 使用的所有内核。
通过在 pod 级别上禁用 P-states 和 C-states,您可以配置高优先级工作负载以获得最佳性能和最低延迟。
表 11.4. 配置高优先级工作负载
| 注解 | 可能的值 | 描述 |
|---|---|---|
|
|
|
此注解允许您为每个 CPU 启用或禁用 C-states。另外,您还可以为 C-states 指定最大延迟(以微秒为单位)。例如,启用最大延迟为 10 微秒的 C-states,设置 |
|
|
任何支持的 |
为每个 CPU 设置 |
先决条件
- 您已为调度高优先级工作负载 pod 的节点在性能配置集中配置了节能。
流程
将所需的注解添加到高优先级工作负载 pod。注解会覆盖
默认设置。高优先级工作负载注解示例
apiVersion: v1 kind: Pod metadata: #... annotations: #... cpu-c-states.crio.io: "disable" cpu-freq-governor.crio.io: "performance" #... #... spec: #... runtimeClassName: performance-<profile_name> #...- 重启 pod 以应用注解。
11.3.5. 禁用 CPU CFS 配额
要消除固定 pod 的 CPU 节流,请使用 cpu-quota.crio.io: "disable" 注解创建一个 pod。此注解在 pod 运行时禁用 CPU 完全公平调度程序(CFS)配额。
禁用 cpu-quota.crio.io 的 pod 规格示例
apiVersion: v1
kind: Pod
metadata:
  annotations:
      cpu-quota.crio.io: "disable"
spec:
    runtimeClassName: performance-<profile_name>
#...
仅在启用了 CPU 管理器静态策略,以及带有保证 QoS 使用整个 CPU 的 pod 时禁用 CPU CFS 配额。例如,包含 CPU 固定容器的 pod。否则,禁用 CPU CFS 配额可能会影响集群中其他容器的性能。
其他资源
11.3.6. 为固定容器运行的 CPU 禁用中断处理
为实现低延迟,一些容器需要固定的 CPU 不处理设备中断。pod 注解 irq-load-balancing.crio.io 用于定义在固定容器运行的 CPU 上是否处理设备中断。配置后,CRI-O 禁用运行 pod 容器的设备中断。
要禁用属于各个 pod 的容器的中断处理,请确保在性能配置集中将 globallyDisableIrqLoadBalancing 设置为 false。然后,在 pod 规格中,将 irq-load-balancing.crio.io pod 注解设置为 disable。
以下 pod 规格包含此注解:
apiVersion: performance.openshift.io/v2
kind: Pod
metadata:
  annotations:
      irq-load-balancing.crio.io: "disable"
spec:
    runtimeClassName: performance-<profile_name>
...11.4. 调试低延迟节点调整状态
使用 PerformanceProfile 自定义资源(CR)状态字段来报告集群节点中的调优状态和调试延迟问题。
11.4.1. 调试低延迟 CNF 调整状态
PerformanceProfile 自定义资源(CR)包含报告调整状态和调试延迟降级问题的状态字段。这些字段报告描述 Operator 协调功能状态的条件。
当附加到性能配置集的机器配置池处于降级状态时会出现一个典型的问题,从而导致 PerformanceProfile 状态降级。在这种情况下,机器配置池会给出一个失败信息。
Node Tuning Operator 包含 performanceProfile.spec.status.Conditions 状态字段:
Status:
  Conditions:
    Last Heartbeat Time:   2020-06-02T10:01:24Z
    Last Transition Time:  2020-06-02T10:01:24Z
    Status:                True
    Type:                  Available
    Last Heartbeat Time:   2020-06-02T10:01:24Z
    Last Transition Time:  2020-06-02T10:01:24Z
    Status:                True
    Type:                  Upgradeable
    Last Heartbeat Time:   2020-06-02T10:01:24Z
    Last Transition Time:  2020-06-02T10:01:24Z
    Status:                False
    Type:                  Progressing
    Last Heartbeat Time:   2020-06-02T10:01:24Z
    Last Transition Time:  2020-06-02T10:01:24Z
    Status:                False
    Type:                  Degraded
Status 字段包含指定 Type 值来指示性能配置集状态的 Conditions:
Available- 所有机器配置和 Tuned 配置集都已被成功创建,且集群组件可用于处理它们(NTO、MCO、Kubelet)。
Upgradeable- 代表 Operator 维护的资源是否处于可安全升级的状态。
Progressing- 表示已从性能配置集启动部署过程。
Degraded如果出现以下情况代表错误:
- 验证性能配置集失败。
- 创建所有相关组件未能成功完成。
每个类型都包括以下字段:
状态-
特定类型的状态(
true或false)。 Timestamp- 事务的时间戳。
Reason string- 机器可读的原因。
Message string- 描述状态和错误详情的人类可读的原因信息(如果存在)。
11.4.1.1. 机器配置池
性能配置集及其创建的产品会根据关联的机器配置池(MCP)应用到节点。MCP 包含有关应用由性能配置集创建的机器配置的有价值的信息,它包括了内核 arg、Kube 配置、巨页分配和 rt-kernel 部署。Performance Profile 控制器监控 MCP 中的更改,并相应地更新性能配置集状态。
MCP 返回到性能配置集状态的唯一条件是 MCP 处于 Degraded 状态,这会导致 performaceProfile.status.condition.Degraded = true。
Example
以下示例是创建关联机器配置池(worker-cnf)的性能配置集:
关联的机器配置池处于降级状态:
# oc get mcp
输出示例
NAME         CONFIG                                                 UPDATED   UPDATING   DEGRADED   MACHINECOUNT   READYMACHINECOUNT   UPDATEDMACHINECOUNT   DEGRADEDMACHINECOUNT   AGE
master       rendered-master-2ee57a93fa6c9181b546ca46e1571d2d       True      False      False      3              3                   3                     0                      2d21h
worker       rendered-worker-d6b2bdc07d9f5a59a6b68950acf25e5f       True      False      False      2              2                   2                     0                      2d21h
worker-cnf   rendered-worker-cnf-6c838641b8a08fff08dbd8b02fb63f7c   False     True       True       2              1                   1                     1                      2d20h
MCP 的
describe部分包括了原因:# oc describe mcp worker-cnf
输出示例
  Message:               Node node-worker-cnf is reporting: "prepping update:
  machineconfig.machineconfiguration.openshift.io \"rendered-worker-cnf-40b9996919c08e335f3ff230ce1d170\" not
  found"
    Reason:                1 nodes are reporting degraded status on sync
降级状态也应该出现在标记为
degraded = true的性能配置集的status字段中:# oc describe performanceprofiles performance
输出示例
Message: Machine config pool worker-cnf Degraded Reason: 1 nodes are reporting degraded status on sync.
Machine config pool worker-cnf Degraded Message: Node yquinn-q8s5v-w-b-z5lqn.c.openshift-gce-devel.internal is
reporting: "prepping update: machineconfig.machineconfiguration.openshift.io
\"rendered-worker-cnf-40b9996919c08e335f3ff230ce1d170\" not found".    Reason:  MCPDegraded
   Status:  True
   Type:    Degraded
11.4.2. 为红帽支持收集调试数据延迟
在提交问题单时同时提供您的集群信息,可以帮助红帽支持为您进行排除故障。
您可使用 must-gather 工具来收集有关 OpenShift Container Platform 集群的诊断信息,包括节点调整、NUMA 拓扑和其他调试延迟设置问题所需的信息。
为了获得快速支持,请提供 OpenShift Container Platform 和低延迟调整的诊断信息。
11.4.2.1. 关于 must-gather 工具
oc adm must-gather CLI 命令可收集最有助于解决问题的集群信息,如:
- 资源定义
- 审计日志
- 服务日志
您在运行该命令时,可通过包含 --image 参数来指定一个或多个镜像。指定镜像后,该工具便会收集有关相应功能或产品的信息。在运行 oc adm must-gather 时,集群上会创建一个新 pod。在该 pod 上收集数据,并保存至以 must-gather.local 开头的一个新目录中。该目录在当前工作目录中创建。
11.4.2.2. 收集低延迟数据
使用 oc adm must-gather CLI 命令来收集有关集群的信息,包括与低延迟性能优化相关的功能和对象,包括:
- Node Tuning Operator 命名空间和子对象。
-
MachineConfigPool和关联的MachineConfig对象。 - Node Tuning Operator 和关联的 Tuned 对象。
- Linux 内核命令行选项。
- CPU 和 NUMA 拓扑
- 基本 PCI 设备信息和 NUMA 本地性。
先决条件
-
使用具有
cluster-admin角色的用户访问集群。 - 安装了 OpenShift Container Platform CLI(oc)。
流程
-
进入要存储
must-gather数据的目录。 运行以下命令来收集调试信息:
$ oc adm must-gather
输出示例
[must-gather      ] OUT Using must-gather plug-in image: quay.io/openshift-release
When opening a support case, bugzilla, or issue please include the following summary data along with any other requested information:
ClusterID: 829er0fa-1ad8-4e59-a46e-2644921b7eb6
ClusterVersion: Stable at "<cluster_version>"
ClusterOperators:
	All healthy and stable


[must-gather      ] OUT namespace/openshift-must-gather-8fh4x created
[must-gather      ] OUT clusterrolebinding.rbac.authorization.k8s.io/must-gather-rhlgc created
[must-gather-5564g] POD 2023-07-17T10:17:37.610340849Z Gathering data for ns/openshift-cluster-version...
[must-gather-5564g] POD 2023-07-17T10:17:38.786591298Z Gathering data for ns/default...
[must-gather-5564g] POD 2023-07-17T10:17:39.117418660Z Gathering data for ns/openshift...
[must-gather-5564g] POD 2023-07-17T10:17:39.447592859Z Gathering data for ns/kube-system...
[must-gather-5564g] POD 2023-07-17T10:17:39.803381143Z Gathering data for ns/openshift-etcd...

...

Reprinting Cluster State:
When opening a support case, bugzilla, or issue please include the following summary data along with any other requested information:
ClusterID: 829er0fa-1ad8-4e59-a46e-2644921b7eb6
ClusterVersion: Stable at "<cluster_version>"
ClusterOperators:
	All healthy and stable
从工作目录中创建的
must-gather目录创建一个压缩文件。例如,在使用 Linux 操作系统的计算机上运行以下命令:$ tar cvaf must-gather.tar.gz must-gather-local.54213423446277122891- 1
- 将
must-gather-local.5421342344627712289//替换为must-gather工具创建的目录名称。
注意创建压缩文件以将数据附加到支持问题单中,或者在创建性能配置集时与 Performance Profile Creator wrapper 脚本一起使用。
- 在红帽客户门户中为您的问题单附上压缩文件。
11.5. 为平台验证执行延迟测试
您可以使用 Cloud-native Network Function (CNF) 测试镜像在启用了 CNF 的 OpenShift Container Platform 集群上运行延迟测试,其中安装了运行 CNF 工作负载所需的所有组件。运行延迟测试以验证工作负载的节点调整。
cnf-tests 容器镜像位于 registry.redhat.io/openshift4/cnf-tests-rhel8:v4.15 中。
11.5.1. 运行延迟测试的先决条件
运行延迟测试前,集群必须满足以下要求:
- 已使用 Node Tuning Operator 配置一个性能配置集。
- 已在集群中应用了所有所需的 CNF 配置。
-
已在集群中应用了已存在的
MachineConfigPoolCR。默认 worker 池为worker-cnf。
11.5.2. 测量延迟
cnf-tests 镜像使用三种工具来测量系统的延迟:
-
hwlatdetect -
cyclictest -
oslat
每个工具都有特定的用途。按顺序使用工具来获取可靠的测试结果。
- hwlatdetect
-
测量裸机硬件可达到的基准。在继续执行下一个延迟测试前,请确保
hwlatdetect报告的延迟满足所需的阈值,因为您无法通过操作系统调整来修复硬件延迟高峰。 - cyclictest
-
在
hwlatdetect验证后验证实时内核调度程序延迟。cyclictest工具调度重复的计时器,并测量所需与实际触发时间之间的差别。这种差别可以发现与中断或进程优先级导致的调优相关的基本问题。该工具必须在实时内核中运行。 - oslat
- 行为与 CPU 密集型 DPDK 应用程序类似,并测量模拟 CPU 繁重数据处理的忙碌循环和中断。
测试引入了以下环境变量:
表 11.5. 延迟测试环境变量
| 环境变量 | 描述 |
|---|---|
|
| 指定测试开始运行的时间(以秒为单位)。您可以使用变量来允许 CPU 管理器协调循环来更新默认的 CPU 池。默认值为 0。 |
|
| 指定运行延迟测试的 pod 使用的 CPU 数量。如果没有设置变量,则默认配置包含所有隔离的 CPU。 |
|
| 指定延迟测试必须运行的时间(以秒为单位)。默认值为 300 秒。 注意
要防止 Ginkgo 2.0 测试套件在延迟测试完成前超时,请将 |
|
|
指定工作负载和操作系统的最大可接受硬件延迟(微秒)。如果您没有设置 |
|
|
指定 |
|
|
指定 |
|
| 指定以微秒为单位的最大可接受的延迟的统一变量。适用于所有可用延迟工具。 |
特定于延迟工具的变量优先于统一变量。例如,如果 OSLAT_MAXIMUM_LATENCY 设置为 30 微秒,而 MAXIMUM_LATENCY 被设置为 10 微秒,则 oslat 测试将以最大可接受的延迟 30 微秒运行。
11.5.3. 运行延迟测试
运行集群延迟测试,以验证 Cloud-native Network Function (CNF) 工作负载的节点调整。
当以非 root 用户或非特权用户执行 podman 命令时,挂载路径可能会失败,错误为 permission denied。要使 podman 命令正常工作,请将 :Z 附加到卷创建中,例如 -v $(pwd)/:/kubeconfig:Z。这允许 podman 进行正确的 SELinux 重新标记。
流程
在包含
kubeconfig文件的目录中打开 shell 提示符。您可以在当前目录中为测试镜像提供
kubeconfig文件,及其相关的$KUBECONFIG环境变量(通过卷挂载)。这允许运行的容器使用容器内的kubeconfig文件。输入以下命令运行延迟测试:
$ podman run -v $(pwd)/:/kubeconfig:Z -e KUBECONFIG=/kubeconfig/kubeconfig \
-e LATENCY_TEST_RUNTIME=<time_in_seconds>\
-e MAXIMUM_LATENCY=<time_in_microseconds> \
registry.redhat.io/openshift4/cnf-tests-rhel8:v4.15 /usr/bin/test-run.sh \
--ginkgo.v --ginkgo.timeout="24h"
-
可选:使用
--ginkgo.dryRun标志,以 dry-run 模式运行延迟测试。这可用于检查测试会运行哪些命令。 -
可选:使用
--ginkgo.v标志来运行测试并增加输出详细程度。 可选: 使用
--ginkgo.timeout="24h"标志,以确保在延迟测试完成前 Ginkgo 2.0 测试套件不会超时。重要每个测试的默认运行时为 300 秒。如需有效的延迟测试结果,通过更新
LATENCY_TEST_RUNTIME变量,对至少 12 小时运行测试。
11.5.3.1. 运行 hwlatdetect
hwlatdetect 工具位于 rt-kernel 软件包中,带有常规订阅 Red Hat Enterprise Linux (RHEL) 9.x。
当以非 root 用户或非特权用户执行 podman 命令时,挂载路径可能会失败,错误为 permission denied。要使 podman 命令正常工作,请将 :Z 附加到卷创建中,例如 -v $(pwd)/:/kubeconfig:Z。这允许 podman 进行正确的 SELinux 重新标记。
先决条件
- 已在集群中安装了实时内核。
-
您使用客户门户网站凭证登录到
registry.redhat.io。
流程
要运行
hwlatdetect测试,请运行以下命令,并根据情况替换变量值:$ podman run -v $(pwd)/:/kubeconfig:Z -e KUBECONFIG=/kubeconfig/kubeconfig \ -e LATENCY_TEST_RUNTIME=600 -e MAXIMUM_LATENCY=20 \ registry.redhat.io/openshift4/cnf-tests-rhel8:v4.15 \ /usr/bin/test-run.sh --ginkgo.focus="hwlatdetect" --ginkgo.v --ginkgo.timeout="24h"
hwlatdetect测试运行了 10 分钟 (600 秒)。当最观察到的延迟低于MAXIMUM_LATENCY(20 FORWARD) 时,测试会成功运行。如果结果超过延迟阈值,测试会失败。
重要对于有效结果,测试应至少运行 12 小时。
失败输出示例
running /usr/bin/cnftests -ginkgo.v -ginkgo.focus=hwlatdetect
I0908 15:25:20.023712      27 request.go:601] Waited for 1.046586367s due to client-side throttling, not priority and fairness, request: GET:https://api.hlxcl6.lab.eng.tlv2.redhat.com:6443/apis/imageregistry.operator.openshift.io/v1?timeout=32s
Running Suite: CNF Features e2e integration tests
=================================================
Random Seed: 1662650718
Will run 1 of 3 specs

[...]

• Failure [283.574 seconds]
[performance] Latency Test
/remote-source/app/vendor/github.com/openshift/cluster-node-tuning-operator/test/e2e/performanceprofile/functests/4_latency/latency.go:62
  with the hwlatdetect image
  /remote-source/app/vendor/github.com/openshift/cluster-node-tuning-operator/test/e2e/performanceprofile/functests/4_latency/latency.go:228
    should succeed [It]
    /remote-source/app/vendor/github.com/openshift/cluster-node-tuning-operator/test/e2e/performanceprofile/functests/4_latency/latency.go:236

    Log file created at: 2022/09/08 15:25:27
    Running on machine: hwlatdetect-b6n4n
    Binary: Built with gc go1.17.12 for linux/amd64
    Log line format: [IWEF]mmdd hh:mm:ss.uuuuuu threadid file:line] msg
    I0908 15:25:27.160620       1 node.go:39] Environment information: /proc/cmdline: BOOT_IMAGE=(hd1,gpt3)/ostree/rhcos-c6491e1eedf6c1f12ef7b95e14ee720bf48359750ac900b7863c625769ef5fb9/vmlinuz-4.18.0-372.19.1.el8_6.x86_64 random.trust_cpu=on console=tty0 console=ttyS0,115200n8 ignition.platform.id=metal ostree=/ostree/boot.1/rhcos/c6491e1eedf6c1f12ef7b95e14ee720bf48359750ac900b7863c625769ef5fb9/0 ip=dhcp root=UUID=5f80c283-f6e6-4a27-9b47-a287157483b2 rw rootflags=prjquota boot=UUID=773bf59a-bafd-48fc-9a87-f62252d739d3 skew_tick=1 nohz=on rcu_nocbs=0-3 tuned.non_isolcpus=0000ffff,ffffffff,fffffff0 systemd.cpu_affinity=4,5,6,7,8,9,10,11,12,13,14,15,16,17,18,19,20,21,22,23,24,25,26,27,28,29,30,31,32,33,34,35,36,37,38,39,40,41,42,43,44,45,46,47,48,49,50,51,52,53,54,55,56,57,58,59,60,61,62,63,64,65,66,67,68,69,70,71,72,73,74,75,76,77,78,79 intel_iommu=on iommu=pt isolcpus=managed_irq,0-3 nohz_full=0-3 tsc=nowatchdog nosoftlockup nmi_watchdog=0 mce=off skew_tick=1 rcutree.kthread_prio=11 + +
    I0908 15:25:27.160830       1 node.go:46] Environment information: kernel version 4.18.0-372.19.1.el8_6.x86_64
    I0908 15:25:27.160857       1 main.go:50] running the hwlatdetect command with arguments [/usr/bin/hwlatdetect --threshold 1 --hardlimit 1 --duration 100 --window 10000000us --width 950000us]
    F0908 15:27:10.603523       1 main.go:53] failed to run hwlatdetect command; out: hwlatdetect:  test duration 100 seconds
       detector: tracer
       parameters:
            Latency threshold: 1us 1
            Sample window:     10000000us
            Sample width:      950000us
         Non-sampling period:  9050000us
            Output File:       None

    Starting test
    test finished
    Max Latency: 326us 2
    Samples recorded: 5
    Samples exceeding threshold: 5
    ts: 1662650739.017274507, inner:6, outer:6
    ts: 1662650749.257272414, inner:14, outer:326
    ts: 1662650779.977272835, inner:314, outer:12
    ts: 1662650800.457272384, inner:3, outer:9
    ts: 1662650810.697273520, inner:3, outer:2

[...]

JUnit report was created: /junit.xml/cnftests-junit.xml


Summarizing 1 Failure:

[Fail] [performance] Latency Test with the hwlatdetect image [It] should succeed
/remote-source/app/vendor/github.com/openshift/cluster-node-tuning-operator/test/e2e/performanceprofile/functests/4_latency/latency.go:476

Ran 1 of 194 Specs in 365.797 seconds
FAIL! -- 0 Passed | 1 Failed | 0 Pending | 2 Skipped
--- FAIL: TestTest (366.08s)
FAIL
hwlatdetect 测试结果示例
您可以捕获以下类型的结果:
- 在每次运行后收集的粗略结果,以便对整个测试过程中所做的任何更改产生影响的历史记录。
- 基本测试和配置设置的组合。
良好结果的示例
hwlatdetect: test duration 3600 seconds
detector: tracer
parameters:
Latency threshold: 10us
Sample window: 1000000us
Sample width: 950000us
Non-sampling period: 50000us
Output File: None

Starting test
test finished
Max Latency: Below threshold
Samples recorded: 0
hwlatdetect 工具仅在示例超过指定阈值时提供输出。
错误结果的示例
hwlatdetect: test duration 3600 seconds
detector: tracer
parameters:Latency threshold: 10usSample window: 1000000us
Sample width: 950000usNon-sampling period: 50000usOutput File: None

Starting tests:1610542421.275784439, inner:78, outer:81
ts: 1610542444.330561619, inner:27, outer:28
ts: 1610542445.332549975, inner:39, outer:38
ts: 1610542541.568546097, inner:47, outer:32
ts: 1610542590.681548531, inner:13, outer:17
ts: 1610543033.818801482, inner:29, outer:30
ts: 1610543080.938801990, inner:90, outer:76
ts: 1610543129.065549639, inner:28, outer:39
ts: 1610543474.859552115, inner:28, outer:35
ts: 1610543523.973856571, inner:52, outer:49
ts: 1610543572.089799738, inner:27, outer:30
ts: 1610543573.091550771, inner:34, outer:28
ts: 1610543574.093555202, inner:116, outer:63
hwlatdetect 的输出显示多个样本超过阈值。但是,相同的输出可能会根据以下因素显示不同的结果:
- 测试的持续时间
- CPU 内核数
- 主机固件设置
在继续执行下一个延迟测试前,请确保 hwlatdetect 报告的延迟满足所需的阈值。修复硬件带来的延迟可能需要您联系系统厂商支持。
并非所有延迟高峰都与硬件相关。确保调整主机固件以满足您的工作负载要求。如需更多信息,请参阅为系统调整设置固件参数。
11.5.3.2. 运行 cyclictest
cyclictest 工具测量指定 CPU 上的实时内核调度程序延迟。
当以非 root 用户或非特权用户执行 podman 命令时,挂载路径可能会失败,错误为 permission denied。要使 podman 命令正常工作,请将 :Z 附加到卷创建中,例如 -v $(pwd)/:/kubeconfig:Z。这允许 podman 进行正确的 SELinux 重新标记。
先决条件
-
您使用客户门户网站凭证登录到
registry.redhat.io。 - 已在集群中安装了实时内核。
- 已使用 Node Tuning Operator 应用了集群性能配置集。
流程
要执行
cyclictest,请运行以下命令,并根据情况替换变量值:$ podman run -v $(pwd)/:/kubeconfig:Z -e KUBECONFIG=/kubeconfig/kubeconfig \ -e LATENCY_TEST_CPUS=10 -e LATENCY_TEST_RUNTIME=600 -e MAXIMUM_LATENCY=20 \ registry.redhat.io/openshift4/cnf-tests-rhel8:v4.15 \ /usr/bin/test-run.sh --ginkgo.focus="cyclictest" --ginkgo.v --ginkgo.timeout="24h"
该命令运行
cyclictest工具 10 分钟(600 秒)。当观察到的延迟低于MAXIMUM_LATENCY时,测试会成功运行(在本例中,20 TOKENs)。对于电信 RAN 工作负载,对 20 个以上延迟的激增通常并不能接受。如果结果超过延迟阈值,测试会失败。
重要对于有效结果,测试应至少运行 12 小时。
失败输出示例
running /usr/bin/cnftests -ginkgo.v -ginkgo.focus=cyclictest
I0908 13:01:59.193776      27 request.go:601] Waited for 1.046228824s due to client-side throttling, not priority and fairness, request: GET:https://api.compute-1.example.com:6443/apis/packages.operators.coreos.com/v1?timeout=32s
Running Suite: CNF Features e2e integration tests
=================================================
Random Seed: 1662642118
Will run 1 of 3 specs

[...]

Summarizing 1 Failure:

[Fail] [performance] Latency Test with the cyclictest image [It] should succeed
/remote-source/app/vendor/github.com/openshift/cluster-node-tuning-operator/test/e2e/performanceprofile/functests/4_latency/latency.go:220

Ran 1 of 194 Specs in 161.151 seconds
FAIL! -- 0 Passed | 1 Failed | 0 Pending | 2 Skipped
--- FAIL: TestTest (161.48s)
FAIL
cyclictest 结果示例
相同的输出可能会显示不同工作负载的结果。例如,spikes 最长为 18μs 对 4G DU 工作负载是可以接受的,但对于 5G DU 工作负载不能接受。
良好结果的示例
running cmd: cyclictest -q -D 10m -p 1 -t 16 -a 2,4,6,8,10,12,14,16,54,56,58,60,62,64,66,68 -h 30 -i 1000 -m
# Histogram
000000 000000   000000  000000  000000  000000  000000  000000  000000  000000  000000  000000  000000  000000  000000  000000  000000
000001 000000   000000  000000  000000  000000  000000  000000  000000  000000  000000  000000  000000  000000  000000  000000  000000
000002 579506   535967  418614  573648  532870  529897  489306  558076  582350  585188  583793  223781  532480  569130  472250  576043
More histogram entries ...
# Total: 000600000 000600000 000600000 000599999 000599999 000599999 000599998 000599998 000599998 000599997 000599997 000599996 000599996 000599995 000599995 000599995
# Min Latencies: 00002 00002 00002 00002 00002 00002 00002 00002 00002 00002 00002 00002 00002 00002 00002 00002
# Avg Latencies: 00002 00002 00002 00002 00002 00002 00002 00002 00002 00002 00002 00002 00002 00002 00002 00002
# Max Latencies: 00005 00005 00004 00005 00004 00004 00005 00005 00006 00005 00004 00005 00004 00004 00005 00004
# Histogram Overflows: 00000 00000 00000 00000 00000 00000 00000 00000 00000 00000 00000 00000 00000 00000 00000 00000
# Histogram Overflow at cycle number:
# Thread 0:
# Thread 1:
# Thread 2:
# Thread 3:
# Thread 4:
# Thread 5:
# Thread 6:
# Thread 7:
# Thread 8:
# Thread 9:
# Thread 10:
# Thread 11:
# Thread 12:
# Thread 13:
# Thread 14:
# Thread 15:
错误结果的示例
running cmd: cyclictest -q -D 10m -p 1 -t 16 -a 2,4,6,8,10,12,14,16,54,56,58,60,62,64,66,68 -h 30 -i 1000 -m
# Histogram
000000 000000   000000  000000  000000  000000  000000  000000  000000  000000  000000  000000  000000  000000  000000  000000  000000
000001 000000   000000  000000  000000  000000  000000  000000  000000  000000  000000  000000  000000  000000  000000  000000  000000
000002 564632   579686  354911  563036  492543  521983  515884  378266  592621  463547  482764  591976  590409  588145  589556  353518
More histogram entries ...
# Total: 000599999 000599999 000599999 000599997 000599997 000599998 000599998 000599997 000599997 000599996 000599995 000599996 000599995 000599995 000599995 000599993
# Min Latencies: 00002 00002 00002 00002 00002 00002 00002 00002 00002 00002 00002 00002 00002 00002 00002 00002
# Avg Latencies: 00002 00002 00002 00002 00002 00002 00002 00002 00002 00002 00002 00002 00002 00002 00002 00002
# Max Latencies: 00493 00387 00271 00619 00541 00513 00009 00389 00252 00215 00539 00498 00363 00204 00068 00520
# Histogram Overflows: 00001 00001 00001 00002 00002 00001 00000 00001 00001 00001 00002 00001 00001 00001 00001 00002
# Histogram Overflow at cycle number:
# Thread 0: 155922
# Thread 1: 110064
# Thread 2: 110064
# Thread 3: 110063 155921
# Thread 4: 110063 155921
# Thread 5: 155920
# Thread 6:
# Thread 7: 110062
# Thread 8: 110062
# Thread 9: 155919
# Thread 10: 110061 155919
# Thread 11: 155918
# Thread 12: 155918
# Thread 13: 110060
# Thread 14: 110060
# Thread 15: 110059 155917
11.5.3.3. 运行 oslat
oslat 测试模拟 CPU 密集型 DPDK 应用程序,并测量所有中断和中断来测试集群处理 CPU 大量数据处理的方式。
当以非 root 用户或非特权用户执行 podman 命令时,挂载路径可能会失败,错误为 permission denied。要使 podman 命令正常工作,请将 :Z 附加到卷创建中,例如 -v $(pwd)/:/kubeconfig:Z。这允许 podman 进行正确的 SELinux 重新标记。
先决条件
-
您使用客户门户网站凭证登录到
registry.redhat.io。 - 已使用 Node Tuning Operator 应用了集群性能配置集。
流程
要执行
oslat测试,请运行以下命令,根据需要替换变量值:$ podman run -v $(pwd)/:/kubeconfig:Z -e KUBECONFIG=/kubeconfig/kubeconfig \ -e LATENCY_TEST_CPUS=10 -e LATENCY_TEST_RUNTIME=600 -e MAXIMUM_LATENCY=20 \ registry.redhat.io/openshift4/cnf-tests-rhel8:v4.15 \ /usr/bin/test-run.sh --ginkgo.focus="oslat" --ginkgo.v --ginkgo.timeout="24h"
LATENCY_TEST_CPUS指定使用oslat命令测试的 CPU 数量。命令运行
oslat工具 10 分钟(600 秒)。当最观察到的延迟低于MAXIMUM_LATENCY(20 FORWARD) 时,测试会成功运行。如果结果超过延迟阈值,测试会失败。
重要对于有效结果,测试应至少运行 12 小时。
失败输出示例
running /usr/bin/cnftests -ginkgo.v -ginkgo.focus=oslat I0908 12:51:55.999393 27 request.go:601] Waited for 1.044848101s due to client-side throttling, not priority and fairness, request: GET:https://compute-1.example.com:6443/apis/machineconfiguration.openshift.io/v1?timeout=32s Running Suite: CNF Features e2e integration tests ================================================= Random Seed: 1662641514 Will run 1 of 3 specs [...] • Failure [77.833 seconds] [performance] Latency Test /remote-source/app/vendor/github.com/openshift/cluster-node-tuning-operator/test/e2e/performanceprofile/functests/4_latency/latency.go:62 with the oslat image /remote-source/app/vendor/github.com/openshift/cluster-node-tuning-operator/test/e2e/performanceprofile/functests/4_latency/latency.go:128 should succeed [It] /remote-source/app/vendor/github.com/openshift/cluster-node-tuning-operator/test/e2e/performanceprofile/functests/4_latency/latency.go:153 The current latency 304 is bigger than the expected one 1 : 1 [...] Summarizing 1 Failure: [Fail] [performance] Latency Test with the oslat image [It] should succeed /remote-source/app/vendor/github.com/openshift/cluster-node-tuning-operator/test/e2e/performanceprofile/functests/4_latency/latency.go:177 Ran 1 of 194 Specs in 161.091 seconds FAIL! -- 0 Passed | 1 Failed | 0 Pending | 2 Skipped --- FAIL: TestTest (161.42s) FAIL- 1
- 在本例中,测量的延迟超出了最大允许的值。
11.5.4. 生成延迟测试失败报告
使用以下步骤生成 JUnit 延迟测试输出和测试失败报告。
先决条件
-
已安装 OpenShift CLI(
oc)。 -
您已以具有
cluster-admin权限的用户身份登录。
流程
使用集群状态和资源的信息创建测试失败报告,通过传递
--report参数并使用报告转储的路径来进行故障排除:$ podman run -v $(pwd)/:/kubeconfig:Z -v $(pwd)/reportdest:<report_folder_path> \ -e KUBECONFIG=/kubeconfig/kubeconfig registry.redhat.io/openshift4/cnf-tests-rhel8:v4.15 \ /usr/bin/test-run.sh --report <report_folder_path> --ginkgo.v
其中:
- <report_folder_path>
- 是生成报告的文件夹的路径。
11.5.5. 生成 JUnit 延迟测试报告
使用以下步骤生成 JUnit 延迟测试输出和测试失败报告。
先决条件
-
已安装 OpenShift CLI(
oc)。 -
您已以具有
cluster-admin权限的用户身份登录。
流程
通过传递
--junit参数和转储报告的路径来创建兼容 JUnit 的 XML 报告:注意您必须先创建
junit文件夹,然后才能运行此命令。$ podman run -v $(pwd)/:/kubeconfig:Z -v $(pwd)/junit:/junit \ -e KUBECONFIG=/kubeconfig/kubeconfig registry.redhat.io/openshift4/cnf-tests-rhel8:v4.15 \ /usr/bin/test-run.sh --ginkgo.junit-report junit/<file-name>.xml --ginkgo.v
其中:
junit- 是存储 junit 报告的文件夹。
11.5.6. 在单节点 OpenShift 集群上运行延迟测试
您可以在单节点 OpenShift 集群上运行延迟测试。
当以非 root 用户或非特权用户执行 podman 命令时,挂载路径可能会失败,错误为 permission denied。要使 podman 命令正常工作,请将 :Z 附加到卷创建中,例如 -v $(pwd)/:/kubeconfig:Z。这允许 podman 进行正确的 SELinux 重新标记。
先决条件
-
已安装 OpenShift CLI(
oc)。 -
您已以具有
cluster-admin权限的用户身份登录。 - 已使用 Node Tuning Operator 应用了集群性能配置集。
流程
要在单节点 OpenShift 集群上运行延迟测试,请运行以下命令:
$ podman run -v $(pwd)/:/kubeconfig:Z -e KUBECONFIG=/kubeconfig/kubeconfig \ -e LATENCY_TEST_RUNTIME=<time_in_seconds> registry.redhat.io/openshift4/cnf-tests-rhel8:v4.15 \ /usr/bin/test-run.sh --ginkgo.v --ginkgo.timeout="24h"
注意每个测试的默认运行时为 300 秒。如需有效的延迟测试结果,通过更新
LATENCY_TEST_RUNTIME变量,对至少 12 小时运行测试。要运行存储桶延迟验证步骤,您必须指定最大延迟。有关最大延迟变量的详情,请查看 "Measuring latency" 部分中的表。运行测试套件后,,清理所有悬停的资源。
11.5.7. 在断开连接的集群中运行延迟测试
CNF 测试镜像可在无法访问外部 registry 的断开连接的集群中运行测试。这需要两个步骤:
-
将
cnf-tests镜像镜像到自定义断开连接的 registry。 - 指示测试使用来自自定义断开连接的 registry 的镜像。
将镜像镜像(mirror)到集群可访问的自定义 registry
mirror 中提供了镜像可执行文件,以提供 oc 需要的输入来镜像运行测试到本地 registry 所需的镜像。
从可访问集群和 registry.redhat.io 的中间机器运行这个命令:
$ podman run -v $(pwd)/:/kubeconfig:Z -e KUBECONFIG=/kubeconfig/kubeconfig \ registry.redhat.io/openshift4/cnf-tests-rhel8:v4.15 \ /usr/bin/mirror -registry <disconnected_registry> | oc image mirror -f -
其中:
- <disconnected_registry>
-
是您配置的断开连接的镜像 registry,如
my.local.registry:5000/。
当您将
cnf-tests镜像 mirror 到断开连接的 registry 中时,您必须覆盖用于运行测试时用来获取镜像的原始 registry,例如:podman run -v $(pwd)/:/kubeconfig:Z -e KUBECONFIG=/kubeconfig/kubeconfig \ -e IMAGE_REGISTRY="<disconnected_registry>" \ -e CNF_TESTS_IMAGE="cnf-tests-rhel8:v4.15" \ -e LATENCY_TEST_RUNTIME=<time_in_seconds> \ <disconnected_registry>/cnf-tests-rhel8:v4.15 /usr/bin/test-run.sh --ginkgo.v --ginkgo.timeout="24h"
配置测试以使用自定义 registry 中的镜像
您可以使用 CNF_TESTS_IMAGE 和 IMAGE_REGISTRY 变量来使用自定义测试镜像和镜像 registry 运行延迟测试。
要将延迟测试配置为使用自定义测试镜像和镜像 registry,请运行以下命令:
$ podman run -v $(pwd)/:/kubeconfig:Z -e KUBECONFIG=/kubeconfig/kubeconfig \ -e IMAGE_REGISTRY="<custom_image_registry>" \ -e CNF_TESTS_IMAGE="<custom_cnf-tests_image>" \ -e LATENCY_TEST_RUNTIME=<time_in_seconds> \ registry.redhat.io/openshift4/cnf-tests-rhel8:v4.15 /usr/bin/test-run.sh --ginkgo.v --ginkgo.timeout="24h"
其中:
- <custom_image_registry>
-
是自定义镜像 registry,如
custom.registry:5000/。 - <custom_cnf-tests_image>
-
是自定义 cnf-tests 镜像,如
custom-cnf-tests-image:latest。
将镜像镜像 (mirror) 到集群 OpenShift 镜像 registry
OpenShift Container Platform 提供了一个内建的容器镜像 registry,它作为一个标准的工作负载在集群中运行。
流程
通过使用路由公开到 registry 的外部访问权限:
$ oc patch configs.imageregistry.operator.openshift.io/cluster --patch '{"spec":{"defaultRoute":true}}' --type=merge运行以下命令来获取 registry 端点:
$ REGISTRY=$(oc get route default-route -n openshift-image-registry --template='{{ .spec.host }}')创建用于公开镜像的命名空间:
$ oc create ns cnftests
使镜像流可供用于测试的所有命名空间使用。这需要允许 test 命名空间从
cnf-tests镜像流中获取镜像。运行以下命令:$ oc policy add-role-to-user system:image-puller system:serviceaccount:cnf-features-testing:default --namespace=cnftests
$ oc policy add-role-to-user system:image-puller system:serviceaccount:performance-addon-operators-testing:default --namespace=cnftests
运行以下命令,检索 docker secret 名称和 auth 令牌:
$ SECRET=$(oc -n cnftests get secret | grep builder-docker | awk {'print $1'}$ TOKEN=$(oc -n cnftests get secret $SECRET -o jsonpath="{.data['\.dockercfg']}" | base64 --decode | jq '.["image-registry.openshift-image-registry.svc:5000"].auth')创建
dockerauth.json文件,例如:$ echo "{\"auths\": { \"$REGISTRY\": { \"auth\": $TOKEN } }}" > dockerauth.json对镜像进行 mirror:
$ podman run -v $(pwd)/:/kubeconfig:Z -e KUBECONFIG=/kubeconfig/kubeconfig \ registry.redhat.io/openshift4/cnf-tests-rhel8:4.15 \ /usr/bin/mirror -registry $REGISTRY/cnftests | oc image mirror --insecure=true \ -a=$(pwd)/dockerauth.json -f -
运行测试:
$ podman run -v $(pwd)/:/kubeconfig:Z -e KUBECONFIG=/kubeconfig/kubeconfig \ -e LATENCY_TEST_RUNTIME=<time_in_seconds> \ -e IMAGE_REGISTRY=image-registry.openshift-image-registry.svc:5000/cnftests cnf-tests-local:latest /usr/bin/test-run.sh --ginkgo.v --ginkgo.timeout="24h"
对不同的测试镜像进行镜像(mirror)
您可以选择更改对延迟测试镜像的默认上游镜像。
流程
mirror命令默认尝试对上游镜像进行 mirror。这可以通过向镜像传递带有以下格式的文件来覆盖:[ { "registry": "public.registry.io:5000", "image": "imageforcnftests:4.15" } ]将文件传递给
mirror命令,例如将其在本地保存为images.json。使用以下命令,本地路径挂载到容器内的/kubeconfig中,并可传递给 mirror 命令。$ podman run -v $(pwd)/:/kubeconfig:Z -e KUBECONFIG=/kubeconfig/kubeconfig \ registry.redhat.io/openshift4/cnf-tests-rhel8:v4.15 /usr/bin/mirror \ --registry "my.local.registry:5000/" --images "/kubeconfig/images.json" \ | oc image mirror -f -
11.5.8. 对 cnf-tests 容器的错误进行故障排除
要运行延迟测试,集群必须从 cnf-tests 容器中访问。
先决条件
-
已安装 OpenShift CLI(
oc)。 -
您已以具有
cluster-admin权限的用户身份登录。
流程
运行以下命令,验证可以从
cnf-tests容器中访问集群:$ podman run -v $(pwd)/:/kubeconfig:Z -e KUBECONFIG=/kubeconfig/kubeconfig \ registry.redhat.io/openshift4/cnf-tests-rhel8:v4.15 \ oc get nodes
如果这个命令无法正常工作,则可能会出现与跨 DNS、MTU 大小或防火墙访问相关的错误。
第 12 章 使用 worker 延迟配置集提高高延迟环境中的集群稳定性
如果集群管理员为平台验证执行了延迟测试,他们可以发现需要调整集群的操作,以确保高延迟的情况的稳定性。集群管理员只需要更改一个参数,该参数记录在一个文件中,它控制了 Supervisory 进程读取状态并解释集群的运行状况的四个参数。仅更改一个参数可以以方便、可支持的方式提供集群调整。
Kubelet 进程提供监控集群运行状况的起点。Kubelet 为 OpenShift Container Platform 集群中的所有节点设置状态值。Kubernetes Controller Manager (kube controller) 默认每 10 秒读取状态值。如果 kube 控制器无法读取节点状态值,它会在配置的时间后丢失与该节点联系。默认行为是:
-
control plane 上的节点控制器将节点健康状况更新为
Unhealthy,并奖节点Ready的条件标记为 'Unknown'。 - 因此,调度程序会停止将 pod 调度到该节点。
-
Node Lifecycle Controller 添加了一个
node.kubernetes.io/unreachable污点,对节点具有NoExecute效果,默认在五分钟后调度节点上的任何 pod 进行驱除。
如果您的网络容易出现延迟问题,尤其是在网络边缘中有节点时,此行为可能会造成问题。在某些情况下,Kubernetes Controller Manager 可能会因为网络延迟而从健康的节点接收更新。Kubelet 会从节点中驱除 pod,即使节点处于健康状态。
要避免这个问题,您可以使用 worker 延迟配置集调整 kubelet 和 Kubernetes Controller Manager 在执行操作前等待状态更新的频率。如果在控制平面和 worker 节点间存在网络延迟,worker 节点没有处于最近状态,这个调整有助于集群可以正常工作。
这些 worker 延迟配置集包含预定义的三组参数,它们带有经过仔细调优的值,以控制集群对增加的延迟进行适当地响应。用户不需要手动进行实验以查找最佳值。
您可在安装集群时配置 worker 延迟配置集,或当您发现集群网络中的延迟增加时。
12.1. 了解 worker 延迟配置集
worker 延迟配置集带有四个不同的、包括经过仔细调优的参数的类别。实现这些值的四个参数是 node-status-update-frequency、node-monitor-grace-period、default-not-ready-toleration-seconds 和 default-unreachable-toleration-seconds。这些参数可让您使用这些值来控制集群对延迟问题的响应,而无需手动确定最佳值。
不支持手动设置这些参数。参数设置不正确会影响集群的稳定性。
所有 worker 延迟配置集配置以下参数:
- node-status-update-frequency
- 指定 kubelet 将节点状态发布到 API 服务器的频率。
- node-monitor-grace-period
-
指定 Kubernetes Controller Manager 在节点不健康前等待更新的时间(以秒为单位),并将
node.kubernetes.io/not-ready或node.kubernetes.io/unreachable污点添加到节点。 - default-not-ready-toleration-seconds
- 指定在标记节点不健康后,Kube API Server Operator 在从该节点驱除 pod 前等待的时间(以秒为单位)。
- default-unreachable-toleration-seconds
- 指定在节点无法访问后,Kube API Server Operator 在从该节点驱除 pod 前等待的时间(以秒为单位)。
以下 Operator 监控 worker 延迟配置集的更改并相应地响应:
-
Machine Config Operator (MCO) 更新 worker 节点上的
node-status-update-frequency参数。 -
Kubernetes Controller Manager 更新 control plane 节点上的
node-monitor-grace-period参数。 -
Kubernetes API Server Operator 更新 control plane 节点上的
default-not-ready-toleration-seconds和default-unreachable-toleration-seconds参数。
虽然默认配置在大多数情况下可以正常工作,但 OpenShift Container Platform 会为网络遇到比通常更高的延迟的情况提供两个其他 worker 延迟配置集。以下部分描述了三个 worker 延迟配置集:
- 默认 worker 延迟配置集
使用
Default配置集时,每个Kubelet每 10 秒更新其状态(node-status-update-frequency)。Kube Controller Manager每 5 秒检查Kubelet的状态(node-monitor-grace-period)。在认为
Kubelet不健康前,Kubernetes Controller Manager 会等待 40 秒以获取来自Kubelet的状态更新。如果没有可用于 Kubernetes Controller Manager 的使用状态,它会使用node.kubernetes.io/not-ready或node.kubernetes.io/unreachable污点标记节点,并驱除该节点上的 pod。如果该节点上的 pod 具有
NoExecute污点,则 pod 会根据tolerationSeconds运行。如果 pod 没有污点,它将在 300 秒内被驱除(default-not-ready-toleration-seconds和Kube API Server的default-unreachable-toleration-seconds设置)。profile 组件 参数 值 Default(默认)
kubelet
node-status-update-frequency10s
kubelet Controller Manager
node-monitor-grace-period40s
Kubernetes API Server Operator
default-not-ready-toleration-seconds300s
Kubernetes API Server Operator
default-unreachable-toleration-seconds300s
- 中型 worker 延迟配置集
如果网络延迟比通常稍高,则使用
MediumUpdateAverageReaction配置集。MediumUpdateAverageReaction配置集减少了 kubelet 更新频率为 20 秒,并将 Kubernetes Controller Manager 等待这些更新的时间更改为 2 分钟。该节点上的 pod 驱除周期会减少到 60 秒。如果 pod 具有tolerationSeconds参数,则驱除会等待该参数指定的周期。Kubernetes Controller Manager 会先等待 2 分钟时间,才会认为节点不健康。另一分钟后,驱除过程会启动。
profile 组件 参数 值 MediumUpdateAverageReaction
kubelet
node-status-update-frequency20s
kubelet Controller Manager
node-monitor-grace-period2m
Kubernetes API Server Operator
default-not-ready-toleration-seconds60s
Kubernetes API Server Operator
default-unreachable-toleration-seconds60s
- 低 worker 延迟配置集
如果网络延迟非常高,请使用
LowUpdateSlowReaction配置集。LowUpdateSlowReaction配置集将 kubelet 更新频率减少为 1 分钟,并将 Kubernetes Controller Manager 等待这些更新的时间更改为 5 分钟。该节点上的 pod 驱除周期会减少到 60 秒。如果 pod 具有tolerationSeconds参数,则驱除会等待该参数指定的周期。Kubernetes Controller Manager 在认为节点不健康前会等待 5 分钟。另一分钟后,驱除过程会启动。
profile 组件 参数 值 LowUpdateSlowReaction
kubelet
node-status-update-frequency1m
kubelet Controller Manager
node-monitor-grace-period5m
Kubernetes API Server Operator
default-not-ready-toleration-seconds60s
Kubernetes API Server Operator
default-unreachable-toleration-seconds60s
12.2. 在集群创建时实现 worker 延迟配置集
要编辑安装程序的配置,首先需要使用命令 openshift-install create manifests 来创建默认节点清单,以及其他清单 YAML 文件。在添加 workerLatencyProfile 前,该文件结构必须存在。安装的平台可能具有不同的要求。有关特定平台,请参阅文档中的安装部分。
workerLatencyProfile 必须按以下顺序添加到清单中:
- 使用适合您安装的文件夹名称,创建构建集群所需的清单。
-
创建 YAML 文件以定义
config.node。该文件必须位于manifests目录中。 -
第一次在清单中定义
workerLatencyProfile时,在集群创建时指定任何配置集:Default,MediumUpdateAverageReaction或LowUpdateSlowReaction。
验证
以下是一个清单创建示例,显示清单文件中的
spec.workerLatencyProfileDefault值:$ openshift-install create manifests --dir=<cluster-install-dir>
编辑清单并添加值。在本例中,我们使用
vi显示添加了 "Default"workerLatencyProfile值的示例清单文件:$ vi <cluster-install-dir>/manifests/config-node-default-profile.yaml
输出示例
apiVersion: config.openshift.io/v1 kind: Node metadata: name: cluster spec: workerLatencyProfile: "Default"
12.3. 使用和更改 worker 延迟配置集
要更改 worker 延迟配置集以处理网络延迟,请编辑 node.config 对象以添加配置集的名称。当延迟增加或减少时,您可以随时更改配置集。
您必须一次移动一个 worker 延迟配置集。例如,您无法直接从 Default 配置集移到 LowUpdateSlowReaction worker 延迟配置集。您必须首先从 Default worker 延迟配置集移到 MediumUpdateAverageReaction 配置集,然后再移到 LowUpdateSlowReaction。同样,当返回到 Default 配置集时,您必须首先从低配置集移到中配置集,然后移到 Default。
您还可以在安装 OpenShift Container Platform 集群时配置 worker 延迟配置集。
流程
将默认的 worker 延迟配置集改为:
中 worke worker 延迟配置集:
编辑
node.config对象:$ oc edit nodes.config/cluster
添加
spec.workerLatencyProfile: MediumUpdateAverageReaction:node.config对象示例apiVersion: config.openshift.io/v1 kind: Node metadata: annotations: include.release.openshift.io/ibm-cloud-managed: "true" include.release.openshift.io/self-managed-high-availability: "true" include.release.openshift.io/single-node-developer: "true" release.openshift.io/create-only: "true" creationTimestamp: "2022-07-08T16:02:51Z" generation: 1 name: cluster ownerReferences: - apiVersion: config.openshift.io/v1 kind: ClusterVersion name: version uid: 36282574-bf9f-409e-a6cd-3032939293eb resourceVersion: "1865" uid: 0c0f7a4c-4307-4187-b591-6155695ac85b spec: workerLatencyProfile: MediumUpdateAverageReaction 1 # ...- 1
- 指定中 worker 延迟策略。
随着更改被应用,每个 worker 节点上的调度都会被禁用。
可选:改为低 worker 延迟配置集:
编辑
node.config对象:$ oc edit nodes.config/cluster
将
spec.workerLatencyProfile值更改为LowUpdateSlowReaction:node.config对象示例apiVersion: config.openshift.io/v1 kind: Node metadata: annotations: include.release.openshift.io/ibm-cloud-managed: "true" include.release.openshift.io/self-managed-high-availability: "true" include.release.openshift.io/single-node-developer: "true" release.openshift.io/create-only: "true" creationTimestamp: "2022-07-08T16:02:51Z" generation: 1 name: cluster ownerReferences: - apiVersion: config.openshift.io/v1 kind: ClusterVersion name: version uid: 36282574-bf9f-409e-a6cd-3032939293eb resourceVersion: "1865" uid: 0c0f7a4c-4307-4187-b591-6155695ac85b spec: workerLatencyProfile: LowUpdateSlowReaction 1 # ...- 1
- 指定使用低 worker 延迟策略。
随着更改被应用,每个 worker 节点上的调度都会被禁用。
验证
当所有节点都返回到
Ready条件时,您可以使用以下命令查看 Kubernetes Controller Manager 以确保应用它:$ oc get KubeControllerManager -o yaml | grep -i workerlatency -A 5 -B 5
输出示例
# ... - lastTransitionTime: "2022-07-11T19:47:10Z" reason: ProfileUpdated status: "False" type: WorkerLatencyProfileProgressing - lastTransitionTime: "2022-07-11T19:47:10Z" 1 message: all static pod revision(s) have updated latency profile reason: ProfileUpdated status: "True" type: WorkerLatencyProfileComplete - lastTransitionTime: "2022-07-11T19:20:11Z" reason: AsExpected status: "False" type: WorkerLatencyProfileDegraded - lastTransitionTime: "2022-07-11T19:20:36Z" status: "False" # ...- 1
- 指定配置集被应用并激活。
要将中配置集改为默认,或将默认改为中,编辑 node.config 对象,并将 spec.workerLatencyProfile 参数设置为适当的值。
12.4. 显示 workerLatencyProfile 生成的值的步骤示例
您可以使用以下命令显示 workerLatencyProfile 中的值。
验证
检查 Kube API Server 的
default-not-ready-toleration-seconds和default-unreachable-toleration-seconds字段输出:$ oc get KubeAPIServer -o yaml | grep -A 1 default-
输出示例
default-not-ready-toleration-seconds: - "300" default-unreachable-toleration-seconds: - "300"
从 Kube Controller Manager 检查
node-monitor-grace-period字段的值:$ oc get KubeControllerManager -o yaml | grep -A 1 node-monitor
输出示例
node-monitor-grace-period: - 40s
检查 Kubelet 中的
nodeStatusUpdateFrequency值。将目录/host设置为 debug shell 中的根目录。将根目录改为/host,您可以运行主机可执行路径中包含的二进制文件:$ oc debug node/<worker-node-name> $ chroot /host # cat /etc/kubernetes/kubelet.conf|grep nodeStatusUpdateFrequency
输出示例
“nodeStatusUpdateFrequency”: “10s”
这些输出验证 Worker Latency Profile 的计时变量集合。
第 13 章 工作负载分区
在资源受限环境中,您可以使用工作负载分区来隔离 OpenShift Container Platform 服务、集群管理工作负载和基础架构 pod,以便在保留的一组 CPU 上运行。
集群管理所需的最小保留 CPU 数量是 4 个 CPU Hyper-Threads (HT)。使用工作负载分区,您可以注解一组集群管理 pod 和一组典型的附加 Operator,以包含在集群管理工作负载分区中。这些 pod 通常在大小为最小要求的 CPU 配置中运行。除了最小集群管理 pod 之外,额外的其他 Operator 或工作负载则需要将额外的 CPU 添加到工作负载分区中。
工作负载分区使用标准 Kubernetes 调度功能将用户工作负载与平台工作负载隔离。
工作负载分区需要以下更改:
在
install-config.yaml文件中,添加额外的字段:cpuPartitioningMode。apiVersion: v1 baseDomain: devcluster.openshift.com cpuPartitioningMode: AllNodes 1 compute: - architecture: amd64 hyperthreading: Enabled name: worker platform: {} replicas: 3 controlPlane: architecture: amd64 hyperthreading: Enabled name: master platform: {} replicas: 3- 1
- 在安装时为 CPU 分区设置集群。默认值为
None。
注意工作负载分区只能在集群安装过程中启用。您不能在安装后禁用工作负载分区。
在性能配置集中,指定
isolated和reservedCPU。推荐的性能配置集配置
apiVersion: performance.openshift.io/v2 kind: PerformanceProfile metadata: # if you change this name make sure the 'include' line in TunedPerformancePatch.yaml # matches this name: include=openshift-node-performance-${PerformanceProfile.metadata.name} # Also in file 'validatorCRs/informDuValidator.yaml': # name: 50-performance-${PerformanceProfile.metadata.name} name: openshift-node-performance-profile annotations: ran.openshift.io/reference-configuration: "ran-du.redhat.com" spec: additionalKernelArgs: - "rcupdate.rcu_normal_after_boot=0" - "efi=runtime" - "vfio_pci.enable_sriov=1" - "vfio_pci.disable_idle_d3=1" - "module_blacklist=irdma" cpu: isolated: $isolated reserved: $reserved hugepages: defaultHugepagesSize: $defaultHugepagesSize pages: - size: $size count: $count node: $node machineConfigPoolSelector: pools.operator.machineconfiguration.openshift.io/$mcp: "" nodeSelector: node-role.kubernetes.io/$mcp: '' numa: topologyPolicy: "restricted" # To use the standard (non-realtime) kernel, set enabled to false realTimeKernel: enabled: true workloadHints: # WorkloadHints defines the set of upper level flags for different type of workloads. # See https://github.com/openshift/cluster-node-tuning-operator/blob/master/docs/performanceprofile/performance_profile.md#workloadhints # for detailed descriptions of each item. # The configuration below is set for a low latency, performance mode. realTime: true highPowerConsumption: false perPodPowerManagement: false表 13.1. 单节点 OpenShift 集群的 PerformanceProfile CR 选项
PerformanceProfile CR 字段 描述 metadata.name确保
名称与相关 GitOps ZTP 自定义资源(CR)中设置的以下字段匹配:-
TunedPerformancePatch.yaml中的include=openshift-node-performance-${PerformanceProfile.metadata.name} -
validatorCRs/informDuValidator.yaml中的name: 50-performance-${PerformanceProfile.metadata.name}
spec.additionalKernelArgs"efi=runtime"为集群主机配置 UEFI 安全引导。spec.cpu.isolated设置隔离的 CPU。确保所有 Hyper-Threading 对都匹配。
重要保留和隔离的 CPU 池不得重叠,并且必须一起跨越所有可用的内核。未考虑导致系统中未定义的 CPU 内核。
spec.cpu.reserved设置保留的 CPU。启用工作负载分区时,系统进程、内核线程和系统容器线程仅限于这些 CPU。所有不是隔离的 CPU 都应保留。
spec.hugepages.pages-
设置巨页数量(
数量) -
设置巨页大小(
大小)。 -
将
node设置为 NUMA 节点,它是hugepages分配的位置 (node)
spec.realTimeKernel将
enabled设置为true以使用实时内核。spec.workloadHints使用
workloadHints为不同类型的工作负载定义顶级标记集合。示例配置为低延迟和高性能配置集群。-
工作负载分区为平台 pod 引进了扩展 management.workload.openshift.io/cores 资源类型。kubelet 公告分配给对应资源内池的 pod 的资源和 CPU 请求。启用工作负载分区后,management.workload.openshift.io/cores 资源允许调度程序根据主机的 cpushares 容量正确分配 pod,而不只是默认的 cpuset。
其他资源
- 有关单节点 OpenShift 集群的推荐工作负载分区配置,请参阅 Workload partitioning。
第 14 章 使用 Node Observability Operator
Node Observability Operator 从计算节点脚本收集并存储 CRI-O 和 Kubelet 分析或指标。
使用 Node Observability Operator,您可以查询性能分析数据,从而分析 CRI-O 和 Kubelet 中的性能趋势。它支持调试与性能相关的问题,并使用自定义资源定义中的 run 字段为网络指标执行内嵌脚本。要启用 CRI-O 和 Kubelet 分析或脚本,您可以在自定义资源定义中配置 type 字段。
Node Observability Operator 只是一个技术预览功能。技术预览功能不受红帽产品服务等级协议(SLA)支持,且功能可能并不完整。红帽不推荐在生产环境中使用它们。这些技术预览功能可以使用户提早试用新的功能,并有机会在开发阶段提供反馈意见。
有关红帽技术预览功能支持范围的更多信息,请参阅技术预览功能支持范围。
14.1. Node Observability Operator 的工作流
以下工作流概述了如何使用 Node Observability Operator 查询分析数据:
- 在 OpenShift Container Platform 集群中安装 Node Observability Operator。
- 创建 NodeObservability 自定义资源,在您选择的 worker 节点上启用 CRI-O 分析。
- 运行性能分析查询,以生成分析数据。
14.2. 安装 Node Observability Operator
默认情况下,OpenShift Container Platform 中不会安装 Node Observability Operator。您可以使用 OpenShift Container Platform CLI 或 Web 控制台安装 Node Observability Operator。
14.2.1. 使用 CLI 安装 Node Observability Operator
您可以使用 OpenShift CLI(oc)安装 Node Observability Operator。
先决条件
- 已安装 OpenShift CLI(oc)。
-
您可以使用
cluster-admin权限访问集群。
流程
运行以下命令确认 Node Observability Operator 可用:
$ oc get packagemanifests -n openshift-marketplace node-observability-operator
输出示例
NAME CATALOG AGE node-observability-operator Red Hat Operators 9h
运行以下命令来创建
node-observability-operator命名空间:$ oc new-project node-observability-operator
创建
OperatorGroup对象 YAML 文件:cat <<EOF | oc apply -f - apiVersion: operators.coreos.com/v1 kind: OperatorGroup metadata: name: node-observability-operator namespace: node-observability-operator spec: targetNamespaces: [] EOF
创建一个
Subscription对象 YAML 文件,以便为 Operator 订阅一个命名空间:cat <<EOF | oc apply -f - apiVersion: operators.coreos.com/v1alpha1 kind: Subscription metadata: name: node-observability-operator namespace: node-observability-operator spec: channel: alpha name: node-observability-operator source: redhat-operators sourceNamespace: openshift-marketplace EOF
验证
运行以下命令来查看安装计划名称:
$ oc -n node-observability-operator get sub node-observability-operator -o yaml | yq '.status.installplan.name'
输出示例
install-dt54w
运行以下命令验证安装计划状态:
$ oc -n node-observability-operator get ip <install_plan_name> -o yaml | yq '.status.phase'
<install_plan_name>是您从上一命令的输出中获取的安装计划名称。输出示例
COMPLETE
验证 Node Observability Operator 是否正在运行:
$ oc get deploy -n node-observability-operator
输出示例
NAME READY UP-TO-DATE AVAILABLE AGE node-observability-operator-controller-manager 1/1 1 1 40h
14.2.2. 使用 Web 控制台安装 Node Observability Operator
您可从 OpenShift Container Platform Web 控制台安装 Node Observability Operator。
先决条件
-
您可以使用
cluster-admin权限访问集群。 - 访问 OpenShift Container Platform web 控制台。
流程
- 登陆到 OpenShift Container Platform Web 控制台。
- 在管理员的导航面板中,展开 Operators → OperatorHub。
- 在 All items 字段中,输入 Node Observability Operator 并选择 Node Observability Operator 标题。
- 点 Install。
在 Install Operator 页面中,配置以下设置:
- 在 Update 频道区中,点 alpha。
- 在 Installation 模式 区中,点 A specific namespace on the cluster。
- 在 Installed Namespace 列表中,从列表中选择 node-observability-operator。
- 在 Update approval 区中,选择 Automatic。
- 点 Install。
验证
- 在 Administrator 的导航面板中,展开 Operators → Installed Operators。
- 验证 Node Observability Operator 是否列在 Operators 列表中。
14.3. 使用 Node Observability Operator 请求 CRI-O 和 Kubelet 分析数据
创建 Node Observability 自定义资源来收集 CRI-O 和 Kubelet 分析数据。
14.3.1. 创建 Node Observability 自定义资源
在运行性能分析查询前,您必须创建并运行 NodeObservability 自定义资源 (CR)。运行 NodeObservability CR 时,它会创建所需的机器配置和机器配置池 CR,以便在与 nodeSelector 匹配的 worker 节点上启用 CRI-O 分析。
如果 worker 节点上没有启用 CRI-O 分析,则会创建 NodeObservabilityMachineConfig 资源。与 NodeObservability CR 中指定的 nodeSelector 匹配的 worker 节点。这可能需要 10 分钟或更长时间来完成。
kubelet 分析被默认启用。
节点的 CRI-O unix 套接字挂载在代理 pod 上,允许代理与 CRI-O 通信来运行 pprof 请求。同样,kubelet-serving-ca 证书链被挂载到代理 pod 上,允许在代理和节点的 kubelet 端点之间进行安全通信。
先决条件
- 已安装 Node Observability Operator。
- 已安装 OpenShift CLI(oc)。
-
您可以使用
cluster-admin权限访问集群。
流程
运行以下命令登录到 OpenShift Container Platform CLI:
$ oc login -u kubeadmin https://<HOSTNAME>:6443
运行以下命令切换回
node-observability-operator命名空间:$ oc project node-observability-operator
创建名为
nodeobservability.yaml的 CR 文件,其中包含以下文本:apiVersion: nodeobservability.olm.openshift.io/v1alpha2 kind: NodeObservability metadata: name: cluster 1 spec: nodeSelector: kubernetes.io/hostname: <node_hostname> 2 type: crio-kubelet运行
NodeObservabilityCR:oc apply -f nodeobservability.yaml
输出示例
nodeobservability.olm.openshift.io/cluster created
运行以下命令,检查
NodeObservabilityCR 的状态:$ oc get nob/cluster -o yaml | yq '.status.conditions'
输出示例
conditions: conditions: - lastTransitionTime: "2022-07-05T07:33:54Z" message: 'DaemonSet node-observability-ds ready: true NodeObservabilityMachineConfig ready: true' reason: Ready status: "True" type: Ready当原因为
Ready且状态为True时,NodeObservabilityCR 运行已完成。
14.3.2. 运行性能分析查询
要运行性能分析查询,您必须创建一个 NodeObservabilityRun 资源。分析查询是一个阻止操作,用于在 30 秒内获取 CRI-O 和 Kubelet 分析数据。分析查询完成后,您必须检索容器文件系统 /run/node-observability 目录中的性能分析数据。数据生命周期通过 emptyDir 卷绑定到代理 pod,因此您可以在代理 pod 处于 running 状态时访问性能分析数据。
您可以在任何时间点上请求一个性能分析查询。
先决条件
- 已安装 Node Observability Operator。
-
您已创建了
NodeObservability自定义资源(CR)。 -
您可以使用
cluster-admin权限访问集群。
流程
创建名为
nodeobservabilityrun.yaml的NodeObservabilityRun资源文件,其中包含以下文本:apiVersion: nodeobservability.olm.openshift.io/v1alpha2 kind: NodeObservabilityRun metadata: name: nodeobservabilityrun spec: nodeObservabilityRef: name: cluster运行
NodeObservabilityRun资源来触发性能分析查询:$ oc apply -f nodeobservabilityrun.yaml
运行以下命令,检查
NodeObservabilityRun的状态:$ oc get nodeobservabilityrun nodeobservabilityrun -o yaml | yq '.status.conditions'
输出示例
conditions: - lastTransitionTime: "2022-07-07T14:57:34Z" message: Ready to start profiling reason: Ready status: "True" type: Ready - lastTransitionTime: "2022-07-07T14:58:10Z" message: Profiling query done reason: Finished status: "True" type: Finished
分析查询在状态变为
True后完成,类型为Finished。通过运行以下 bash 脚本,从容器的
/run/node-observability路径中检索配置集数据:for a in $(oc get nodeobservabilityrun nodeobservabilityrun -o yaml | yq .status.agents[].name); do echo "agent ${a}" mkdir -p "/tmp/${a}" for p in $(oc exec "${a}" -c node-observability-agent -- bash -c "ls /run/node-observability/*.pprof"); do f="$(basename ${p})" echo "copying ${f} to /tmp/${a}/${f}" oc exec "${a}" -c node-observability-agent -- cat "${p}" > "/tmp/${a}/${f}" done done
14.4. Node Observability Operator 脚本
脚本允许您使用当前的 Node Observability Operator 和 Node Observability 代理运行预先配置的 bash 脚本。
这些脚本监控 CPU 负载、内存压力和 worker 节点问题等关键指标。它们还收集 sar 报告和自定义性能指标。
14.4.1. 为脚本创建 Node Observability 自定义资源
在运行脚本前,您必须创建并运行 NodeObservability 自定义资源 (CR)。运行 NodeObservability CR 时,它会在与 nodeSelector 标签匹配的计算节点上以脚本模式启用代理。
先决条件
- 已安装 Node Observability Operator。
-
已安装 OpenShift CLI(
oc)。 -
您可以使用
cluster-admin权限访问集群。
流程
运行以下命令登录到 OpenShift Container Platform 集群:
$ oc login -u kubeadmin https://<host_name>:6443
运行以下命令切换到
node-observability-operator命名空间:$ oc project node-observability-operator
创建名为
nodeobservability.yaml的文件,其中包含以下内容:apiVersion: nodeobservability.olm.openshift.io/v1alpha2 kind: NodeObservability metadata: name: cluster 1 spec: nodeSelector: kubernetes.io/hostname: <node_hostname> 2 type: scripting 3运行以下命令来创建
NodeObservabilityCR:$ oc apply -f nodeobservability.yaml
输出示例
nodeobservability.olm.openshift.io/cluster created
运行以下命令,检查
NodeObservabilityCR 的状态:$ oc get nob/cluster -o yaml | yq '.status.conditions'
输出示例
conditions: conditions: - lastTransitionTime: "2022-07-05T07:33:54Z" message: 'DaemonSet node-observability-ds ready: true NodeObservabilityScripting ready: true' reason: Ready status: "True" type: Ready当
reason为Ready,status为"True"时代表NodeObservabilityCR 运行完成。
14.4.2. 配置 Node Observability Operator 脚本
先决条件
- 已安装 Node Observability Operator。
-
您已创建了
NodeObservability自定义资源(CR)。 -
您可以使用
cluster-admin权限访问集群。
流程
创建一个名为
nodeobservabilityrun-script.yaml的文件,其中包含以下内容:apiVersion: nodeobservability.olm.openshift.io/v1alpha2 kind: NodeObservabilityRun metadata: name: nodeobservabilityrun-script namespace: node-observability-operator spec: nodeObservabilityRef: name: cluster type: scripting重要您只能请求以下脚本:
-
metrics.sh -
network-metrics.sh(使用monitor.sh)
-
使用以下命令创建
NodeObservabilityRun资源来触发脚本:$ oc apply -f nodeobservabilityrun-script.yaml
运行以下命令,查看
NodeObservabilityRun脚本的状态:$ oc get nodeobservabilityrun nodeobservabilityrun-script -o yaml | yq '.status.conditions'
输出示例
Status: Agents: Ip: 10.128.2.252 Name: node-observability-agent-n2fpm Port: 8443 Ip: 10.131.0.186 Name: node-observability-agent-wcc8p Port: 8443 Conditions: Conditions: Last Transition Time: 2023-12-19T15:10:51Z Message: Ready to start profiling Reason: Ready Status: True Type: Ready Last Transition Time: 2023-12-19T15:11:01Z Message: Profiling query done Reason: Finished Status: True Type: Finished Finished Timestamp: 2023-12-19T15:11:01Z Start Timestamp: 2023-12-19T15:10:51Z当
Status为True,Type为Finished时代表脚本完成。运行以下 bash 脚本,从容器的 root 路径检索脚本数据:
#!/bin/bash RUN=$(oc get nodeobservabilityrun --no-headers | awk '{print $1}') for a in $(oc get nodeobservabilityruns.nodeobservability.olm.openshift.io/${RUN} -o json | jq .status.agents[].name); do echo "agent ${a}" agent=$(echo ${a} | tr -d "\"\'\`") base_dir=$(oc exec "${agent}" -c node-observability-agent -- bash -c "ls -t | grep node-observability-agent" | head -1) echo "${base_dir}" mkdir -p "/tmp/${agent}" for p in $(oc exec "${agent}" -c node-observability-agent -- bash -c "ls ${base_dir}"); do f="/${base_dir}/${p}" echo "copying ${f} to /tmp/${agent}/${p}" oc exec "${agent}" -c node-observability-agent -- cat ${f} > "/tmp/${agent}/${p}" done done
14.5. 其他资源
有关如何收集 worker 指标的更多信息,请参阅红帽知识库文章。