
Monitoring
Monitoring projects on Red Hat OpenShift Service on AWS
Abstract
Chapter 1. Monitoring overview
1.1. About Red Hat OpenShift Service on AWS monitoring
In Red Hat OpenShift Service on AWS, you can monitor your own projects in isolation from Red Hat Site Reliability Engineering (SRE) platform metrics. You can monitor your own projects without the need for an additional monitoring solution.
1.2. Understanding the monitoring stack
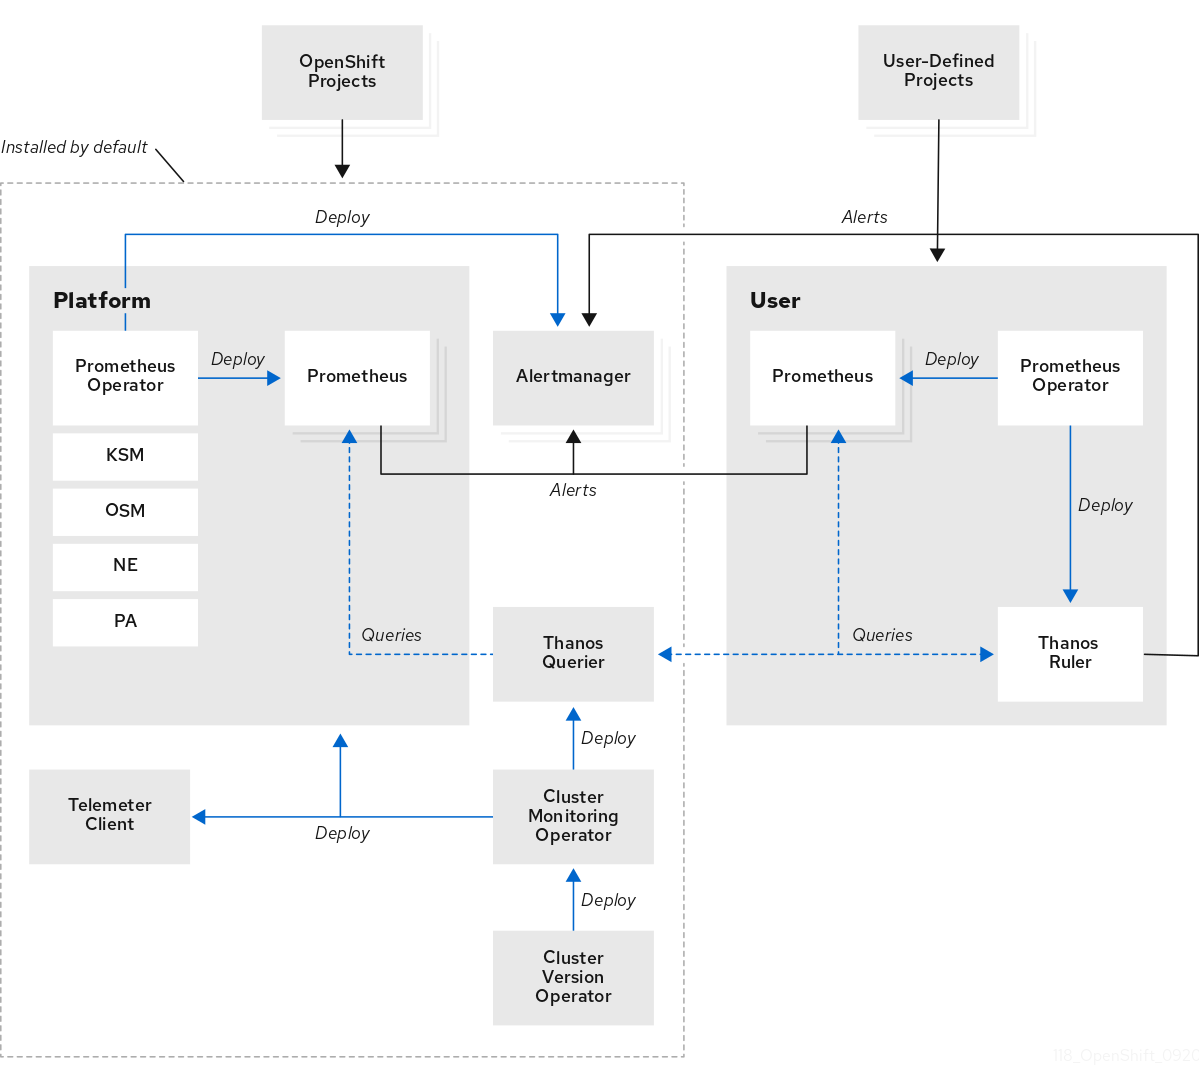
The Red Hat OpenShift Service on AWS (ROSA) monitoring stack is based on the Prometheus open source project and its wider ecosystem. The monitoring stack includes the following:
Default platform monitoring components. A set of platform monitoring components are installed in the
openshift-monitoringproject by default during a Red Hat OpenShift Service on AWS installation. Red Hat Site Reliability Engineers (SRE) use these components to monitor core cluster components including Kubernetes services. This includes critical metrics, such as CPU and memory, collected from all of the workloads in every namespace.These components are illustrated in the Installed by default section in the following diagram.
-
Components for monitoring user-defined projects. A set of user-defined project monitoring components are installed in the
openshift-user-workload-monitoringproject by default during a Red Hat OpenShift Service on AWS installation. You can use these components to monitor services and pods in user-defined projects. These components are illustrated in the User section in the following diagram.
1.2.1. Default monitoring targets
Red Hat Site Reliability Engineers (SRE) monitor the following platform targets in your Red Hat OpenShift Service on AWS cluster:
- CoreDNS
- Elasticsearch (if Logging is installed)
- etcd
- Fluentd (if Logging is installed)
- HAProxy
- Image registry
- Kubelets
- Kubernetes API server
- Kubernetes controller manager
- Kubernetes scheduler
- OpenShift API server
- OpenShift Controller Manager
- Operator Lifecycle Manager (OLM)
- Vector (if Logging is installed)
1.2.2. Components for monitoring user-defined projects
Red Hat OpenShift Service on AWS includes an optional enhancement to the monitoring stack that enables you to monitor services and pods in user-defined projects. This feature includes the following components:
Table 1.1. Components for monitoring user-defined projects
| Component | Description |
|---|---|
| Prometheus Operator |
The Prometheus Operator (PO) in the |
| Prometheus | Prometheus is the monitoring system through which monitoring is provided for user-defined projects. Prometheus sends alerts to Alertmanager for processing. |
| Thanos Ruler | The Thanos Ruler is a rule evaluation engine for Prometheus that is deployed as a separate process. In Red Hat OpenShift Service on AWS , Thanos Ruler provides rule and alerting evaluation for the monitoring of user-defined projects. |
| Alertmanager | The Alertmanager service handles alerts received from Prometheus and Thanos Ruler. Alertmanager is also responsible for sending user-defined alerts to external notification systems. Deploying this service is optional. |
All of these components are monitored by the stack and are automatically updated when Red Hat OpenShift Service on AWS is updated.
1.2.3. Monitoring targets for user-defined projects
Monitoring is enabled by default for Red Hat OpenShift Service on AWS user-defined projects. You can monitor:
- Metrics provided through service endpoints in user-defined projects.
- Pods running in user-defined projects.
1.3. Glossary of common terms for Red Hat OpenShift Service on AWS monitoring
This glossary defines common terms that are used in Red Hat OpenShift Service on AWS architecture.
- Alertmanager
- Alertmanager handles alerts received from Prometheus. Alertmanager is also responsible for sending the alerts to external notification systems.
- Alerting rules
- Alerting rules contain a set of conditions that outline a particular state within a cluster. Alerts are triggered when those conditions are true. An alerting rule can be assigned a severity that defines how the alerts are routed.
- Cluster Monitoring Operator
- The Cluster Monitoring Operator (CMO) is a central component of the monitoring stack. It deploys and manages Prometheus instances such as, the Thanos Querier, the Telemeter Client, and metrics targets to ensure that they are up to date. The CMO is deployed by the Cluster Version Operator (CVO).
- Cluster Version Operator
- The Cluster Version Operator (CVO) manages the lifecycle of cluster Operators, many of which are installed in Red Hat OpenShift Service on AWS by default.
- config map
-
A config map provides a way to inject configuration data into pods. You can reference the data stored in a config map in a volume of type
ConfigMap. Applications running in a pod can use this data. - Container
- A container is a lightweight and executable image that includes software and all its dependencies. Containers virtualize the operating system. As a result, you can run containers anywhere from a data center to a public or private cloud as well as a developer’s laptop.
- custom resource (CR)
- A CR is an extension of the Kubernetes API. You can create custom resources.
- etcd
- etcd is the key-value store for Red Hat OpenShift Service on AWS, which stores the state of all resource objects.
- Fluentd
Fluentd is a log collector that resides on each Red Hat OpenShift Service on AWS node. It gathers application, infrastructure, and audit logs and forwards them to different outputs.
NoteFluentd is deprecated and is planned to be removed in a future release. Red Hat provides bug fixes and support for this feature during the current release lifecycle, but this feature no longer receives enhancements. As an alternative to Fluentd, you can use Vector instead.
- Kubelets
- Runs on nodes and reads the container manifests. Ensures that the defined containers have started and are running.
- Kubernetes API server
- Kubernetes API server validates and configures data for the API objects.
- Kubernetes controller manager
- Kubernetes controller manager governs the state of the cluster.
- Kubernetes scheduler
- Kubernetes scheduler allocates pods to nodes.
- labels
- Labels are key-value pairs that you can use to organize and select subsets of objects such as a pod.
- node
- A worker machine in the Red Hat OpenShift Service on AWS cluster. A node is either a virtual machine (VM) or a physical machine.
- Operator
- The preferred method of packaging, deploying, and managing a Kubernetes application in an Red Hat OpenShift Service on AWS cluster. An Operator takes human operational knowledge and encodes it into software that is packaged and shared with customers.
- Operator Lifecycle Manager (OLM)
- OLM helps you install, update, and manage the lifecycle of Kubernetes native applications. OLM is an open source toolkit designed to manage Operators in an effective, automated, and scalable way.
- Persistent storage
- Stores the data even after the device is shut down. Kubernetes uses persistent volumes to store the application data.
- Persistent volume claim (PVC)
- You can use a PVC to mount a PersistentVolume into a Pod. You can access the storage without knowing the details of the cloud environment.
- pod
- The pod is the smallest logical unit in Kubernetes. A pod is comprised of one or more containers to run in a worker node.
- Prometheus
- Prometheus is the monitoring system on which the Red Hat OpenShift Service on AWS monitoring stack is based. Prometheus is a time-series database and a rule evaluation engine for metrics. Prometheus sends alerts to Alertmanager for processing.
- Prometheus adapter
- The Prometheus Adapter translates Kubernetes node and pod queries for use in Prometheus. The resource metrics that are translated include CPU and memory utilization. The Prometheus Adapter exposes the cluster resource metrics API for horizontal pod autoscaling.
- Prometheus Operator
-
The Prometheus Operator (PO) in the
openshift-monitoringproject creates, configures, and manages platform Prometheus and Alertmanager instances. It also automatically generates monitoring target configurations based on Kubernetes label queries. - Silences
- A silence can be applied to an alert to prevent notifications from being sent when the conditions for an alert are true. You can mute an alert after the initial notification, while you work on resolving the underlying issue.
- storage
- Red Hat OpenShift Service on AWS supports many types of storage on AWS. You can manage container storage for persistent and non-persistent data in an Red Hat OpenShift Service on AWS cluster.
- Thanos Ruler
- The Thanos Ruler is a rule evaluation engine for Prometheus that is deployed as a separate process. In Red Hat OpenShift Service on AWS, Thanos Ruler provides rule and alerting evaluation for the monitoring of user-defined projects.
- Vector
- Vector is a log collector that deploys to each Red Hat OpenShift Service on AWS node. It collects log data from each node, transforms the data, and forwards it to configured outputs.
- web console
- A user interface (UI) to manage Red Hat OpenShift Service on AWS.
1.4. Next steps
Chapter 2. Accessing monitoring for user-defined projects
When you install a Red Hat OpenShift Service on AWS (ROSA) cluster, monitoring for user-defined projects is enabled by default. With monitoring for user-defined projects enabled, you can monitor your own ROSA projects without the need for an additional monitoring solution.
The dedicated-admin user has default permissions to configure and access monitoring for user-defined projects.
Custom Prometheus instances and the Prometheus Operator installed through Operator Lifecycle Manager (OLM) can cause issues with user-defined project monitoring if it is enabled. Custom Prometheus instances are not supported.
Optionally, you can disable monitoring for user-defined projects during or after a cluster installation.
2.1. Next steps
Chapter 3. Configuring the monitoring stack
This section explains what configuration is supported, shows how to configure the monitoring stack for user-defined projects, and demonstrates several common configuration scenarios.
Not all configuration parameters for the monitoring stack are exposed. Only the parameters and fields listed in the Config map reference for the Cluster Monitoring Operator are supported for configuration.
3.1. Maintenance and support for monitoring
Not all configuration options for the monitoring stack are exposed. The only supported way of configuring Red Hat OpenShift Service on AWS monitoring is by configuring the Cluster Monitoring Operator using the options described in the Config map reference for the Cluster Monitoring Operator. Do not use other configurations, as they are unsupported.
Configuration paradigms might change across Prometheus releases, and such cases can only be handled gracefully if all configuration possibilities are controlled. If you use configurations other than those described in the Config map reference for the Cluster Monitoring Operator, your changes will disappear because the Cluster Monitoring Operator automatically reconciles any differences and resets any unsupported changes back to the originally defined state by default and by design.
Installing another Prometheus instance is not supported by the Red Hat Site Reliability Engineers (SRE).
3.1.1. Support considerations for monitoring
Backward compatibility for metrics, recording rules, or alerting rules is not guaranteed.
The following modifications are explicitly not supported:
- Installing custom Prometheus instances on Red Hat OpenShift Service on AWS. A custom instance is a Prometheus custom resource (CR) managed by the Prometheus Operator.
-
Modifying the default platform monitoring components. You should not modify any of the components defined in the
cluster-monitoring-configconfig map. Red Hat SRE uses these components to monitor the core cluster components and Kubernetes services.
3.2. Configuring the monitoring stack
In Red Hat OpenShift Service on AWS, you can configure the stack that monitors workloads for user-defined projects by using the user-workload-monitoring-config ConfigMap object. Config maps configure the Cluster Monitoring Operator (CMO), which in turn configures the components of the stack.
Prerequisites
-
You have access to the cluster as a user with the
dedicated-adminrole. -
The
user-workload-monitoring-configConfigMapobject exists. This object is created by default when the cluster is created. -
You have installed the OpenShift CLI (
oc).
Procedure
Edit the
ConfigMapobject.Edit the
user-workload-monitoring-configConfigMapobject in theopenshift-user-workload-monitoringproject:$ oc -n openshift-user-workload-monitoring edit configmap user-workload-monitoring-config
Add your configuration under
data/config.yamlas a key-value pair<component_name>: <component_configuration>:apiVersion: v1 kind: ConfigMap metadata: name: user-workload-monitoring-config namespace: openshift-user-workload-monitoring data: config.yaml: | <component>: <configuration_for_the_component>Substitute
<component>and<configuration_for_the_component>accordingly.The following example
ConfigMapobject configures a data retention period and minimum container resource requests for Prometheus. This relates to the Prometheus instance that monitors user-defined projects only:apiVersion: v1 kind: ConfigMap metadata: name: user-workload-monitoring-config namespace: openshift-user-workload-monitoring data: config.yaml: | prometheus: 1 retention: 24h 2 resources: requests: cpu: 200m 3 memory: 2Gi 4- 1
- Defines the Prometheus component and the subsequent lines define its configuration.
- 2
- Configures a twenty-four hour data retention period for the Prometheus instance that monitors user-defined projects.
- 3
- Defines a minimum resource request of 200 millicores for the Prometheus container.
- 4
- Defines a minimum pod resource request of 2 GiB of memory for the Prometheus container.
Save the file to apply the changes to the
ConfigMapobject. The pods affected by the new configuration are restarted automatically.WarningWhen changes are saved to a monitoring config map, the pods and other resources in the related project might be redeployed. The running monitoring processes in that project might also be restarted.
Additional resources
-
Configuration reference for the
user-workload-monitoring-configconfig map
3.3. Configurable monitoring components
This table shows the monitoring components you can configure and the keys used to specify the components in the user-workload-monitoring-config ConfigMap objects.
Do not modify the monitoring components in the cluster-monitoring-config ConfigMap object. Red Hat Site Reliability Engineers (SRE) use these components to monitor the core cluster components and Kubernetes services.
Table 3.1. Configurable monitoring components
| Component | user-workload-monitoring-config config map key |
|---|---|
| Alertmanager |
|
| Prometheus Operator |
|
| Prometheus |
|
| Thanos Ruler |
|
3.4. Using node selectors to move monitoring components
By using the nodeSelector constraint with labeled nodes, you can move any of the monitoring stack components to specific nodes. By doing so, you can control the placement and distribution of the monitoring components across a cluster.
By controlling placement and distribution of monitoring components, you can optimize system resource use, improve performance, and segregate workloads based on specific requirements or policies.
3.4.1. How node selectors work with other constraints
If you move monitoring components by using node selector constraints, be aware that other constraints to control pod scheduling might exist for a cluster:
- Topology spread constraints might be in place to control pod placement.
- Hard anti-affinity rules are in place for Prometheus, Thanos Querier, Alertmanager, and other monitoring components to ensure that multiple pods for these components are always spread across different nodes and are therefore always highly available.
When scheduling pods onto nodes, the pod scheduler tries to satisfy all existing constraints when determining pod placement. That is, all constraints compound when the pod scheduler determines which pods will be placed on which nodes.
Therefore, if you configure a node selector constraint but existing constraints cannot all be satisfied, the pod scheduler cannot match all constraints and will not schedule a pod for placement onto a node.
To maintain resilience and high availability for monitoring components, ensure that enough nodes are available and match all constraints when you configure a node selector constraint to move a component.
3.4.2. Moving monitoring components to different nodes
You can move any of the components that monitor workloads for user-defined projects to specific worker nodes. It is not permitted to move components to control plane or infrastructure nodes.
Prerequisites
-
You have access to the cluster as a user with the
dedicated-adminrole. -
The
user-workload-monitoring-configConfigMapobject exists. This object is created by default when the cluster is created. -
You have installed the OpenShift CLI (
oc).
Procedure
If you have not done so yet, add a label to the nodes on which you want to run the monitoring components:
$ oc label nodes <node-name> <node-label>
Edit the
ConfigMapobject:Edit the
user-workload-monitoring-configConfigMapobject in theopenshift-user-workload-monitoringproject:$ oc -n openshift-user-workload-monitoring edit configmap user-workload-monitoring-config
Specify the node labels for the
nodeSelectorconstraint for the component underdata/config.yaml:apiVersion: v1 kind: ConfigMap metadata: name: user-workload-monitoring-config namespace: openshift-user-workload-monitoring data: config.yaml: | <component>: 1 nodeSelector: <node-label-1> 2 <node-label-2> 3 <...>- 1
- Substitute
<component>with the appropriate monitoring stack component name. - 2
- Substitute
<node-label-1>with the label you added to the node. - 3
- Optional: Specify additional labels. If you specify additional labels, the pods for the component are only scheduled on the nodes that contain all of the specified labels.
NoteIf monitoring components remain in a
Pendingstate after configuring thenodeSelectorconstraint, check the pod events for errors relating to taints and tolerations.
Save the file to apply the changes. The components specified in the new configuration are moved to the new nodes automatically.
WarningWhen you save changes to a monitoring config map, the pods and other resources in the project might be redeployed. The running monitoring processes in that project might also restart.
Additional resources
-
See the Kubernetes documentation for details on the
nodeSelectorconstraint
3.5. Assigning tolerations to monitoring components
You can assign tolerations to the components that monitor user-defined projects, to enable moving them to tainted worker nodes. Scheduling is not permitted on control plane or infrastructure nodes.
Prerequisites
-
You have access to the cluster as a user with the
dedicated-adminrole. -
The
user-workload-monitoring-configConfigMapobject exists in theopenshift-user-workload-monitoringnamespace. This object is created by default when the cluster is created. -
You have installed the OpenShift CLI (
oc).
Procedure
Edit the
ConfigMapobject:Edit the
user-workload-monitoring-configConfigMapobject in theopenshift-user-workload-monitoringproject:$ oc -n openshift-user-workload-monitoring edit configmap user-workload-monitoring-config
Specify
tolerationsfor the component:apiVersion: v1 kind: ConfigMap metadata: name: user-workload-monitoring-config namespace: openshift-user-workload-monitoring data: config.yaml: | <component>: tolerations: <toleration_specification>Substitute
<component>and<toleration_specification>accordingly.For example,
oc adm taint nodes node1 key1=value1:NoScheduleadds a taint tonode1with the keykey1and the valuevalue1. This prevents monitoring components from deploying pods onnode1unless a toleration is configured for that taint. The following example configures thethanosRulercomponent to tolerate the example taint:apiVersion: v1 kind: ConfigMap metadata: name: user-workload-monitoring-config namespace: openshift-user-workload-monitoring data: config.yaml: | thanosRuler: tolerations: - key: "key1" operator: "Equal" value: "value1" effect: "NoSchedule"
Save the file to apply the changes. The new component placement configuration is applied automatically.
WarningWhen changes are saved to a monitoring config map, the pods and other resources in the related project might be redeployed. The running monitoring processes in that project might also be restarted.
Additional resources
- See the Kubernetes documentation on taints and tolerations
3.6. Managing CPU and memory resources for monitoring components
You can ensure that the containers that run monitoring components have enough CPU and memory resources by specifying values for resource limits and requests for those components.
You can configure these limits and requests for core platform monitoring components in the openshift-monitoring namespace and for the components that monitor user-defined projects in the openshift-user-workload-monitoring namespace.
3.6.1. About specifying limits and requests for monitoring components
You can configure resource limits and request settings for core platform monitoring components and for the components that monitor user-defined projects, including the following components:
- Alertmanager (for core platform monitoring and for user-defined projects)
- kube-state-metrics
- monitoring-plugin
- node-exporter
- openshift-state-metrics
- Prometheus (for core platform monitoring and for user-defined projects)
- Prometheus Adapter
- Prometheus Operator and its admission webhook service
- Telemeter Client
- Thanos Querier
- Thanos Ruler
By defining resource limits, you limit a container’s resource usage, which prevents the container from exceeding the specified maximum values for CPU and memory resources.
By defining resource requests, you specify that a container can be scheduled only on a node that has enough CPU and memory resources available to match the requested resources.
3.6.2. Specifying limits and requests for monitoring components
To configure CPU and memory resources, specify values for resource limits and requests in the appropriate ConfigMap object for the namespace in which the monitoring component is located:
-
The
cluster-monitoring-configconfig map in theopenshift-monitoringnamespace for core platform monitoring -
The
user-workload-monitoring-configconfig map in theopenshift-user-workload-monitoringnamespace for components that monitor user-defined projects
Prerequisites
If you are configuring core platform monitoring components:
-
You have access to the cluster as a user with the
cluster-admincluster role. -
You have created a
ConfigMapobject namedcluster-monitoring-config.
-
You have access to the cluster as a user with the
If you are configuring components that monitor user-defined projects:
-
You have access to the cluster as a user with the
cluster-admincluster role, or as a user with theuser-workload-monitoring-config-editrole in theopenshift-user-workload-monitoringproject.
-
You have access to the cluster as a user with the
-
You have installed the OpenShift CLI (
oc).
Procedure
To configure core platform monitoring components, edit the
cluster-monitoring-configconfig map object in theopenshift-monitoringnamespace:$ oc -n openshift-monitoring edit configmap cluster-monitoring-config
Add values to define resource limits and requests for each core platform monitoring component you want to configure.
ImportantMake sure that the value set for a limit is always higher than the value set for a request. Otherwise, an error will occur, and the container will not run.
Example
apiVersion: v1
kind: ConfigMap
metadata:
  name: cluster-monitoring-config
  namespace: openshift-monitoring
data:
  config.yaml: |
    alertmanagerMain:
      resources:
        limits:
          cpu: 500m
          memory: 1Gi
        requests:
          cpu: 200m
          memory: 500Mi
    prometheusK8s:
      resources:
        limits:
          cpu: 500m
          memory: 3Gi
        requests:
          cpu: 200m
          memory: 500Mi
    prometheusOperator:
      resources:
        limits:
          cpu: 500m
          memory: 1Gi
        requests:
          cpu: 200m
          memory: 500Mi
    k8sPrometheusAdapter:
      resources:
        limits:
          cpu: 500m
          memory: 1Gi
        requests:
          cpu: 200m
          memory: 500Mi
    kubeStateMetrics:
      resources:
        limits:
          cpu: 500m
          memory: 1Gi
        requests:
          cpu: 200m
          memory: 500Mi
    telemeterClient:
      resources:
        limits:
          cpu: 500m
          memory: 1Gi
        requests:
          cpu: 200m
          memory: 500Mi
    openshiftStateMetrics:
      resources:
        limits:
          cpu: 500m
          memory: 1Gi
        requests:
          cpu: 200m
          memory: 500Mi
    thanosQuerier:
      resources:
        limits:
          cpu: 500m
          memory: 1Gi
        requests:
          cpu: 200m
          memory: 500Mi
    nodeExporter:
      resources:
        limits:
          cpu: 50m
          memory: 150Mi
        requests:
          cpu: 20m
          memory: 50Mi
    monitoringPlugin:
      resources:
        limits:
          cpu: 500m
          memory: 1Gi
        requests:
          cpu: 200m
          memory: 500Mi
    prometheusOperatorAdmissionWebhook:
      resources:
        limits:
          cpu: 50m
          memory: 100Mi
        requests:
          cpu: 20m
          memory: 50Mi
Save the file to apply the changes automatically.
ImportantWhen you save changes to the
cluster-monitoring-configconfig map, the pods and other resources in theopenshift-monitoringproject might be redeployed. The running monitoring processes in that project might also restart.
Additional resources
3.7. Configuring persistent storage
Running cluster monitoring with persistent storage means that your metrics are stored to a persistent volume (PV) and can survive a pod being restarted or recreated. This is ideal if you require your metrics or alerting data to be guarded from data loss. For production environments, it is highly recommended to configure persistent storage. Because of the high IO demands, it is advantageous to use local storage.
3.7.1. Persistent storage prerequisites
- Use the block type of storage.
3.7.2. Configuring a persistent volume claim
For monitoring components to use a persistent volume (PV), you must configure a persistent volume claim (PVC).
Prerequisites
-
You have access to the cluster as a user with the
dedicated-adminrole. -
The
user-workload-monitoring-configConfigMapobject exists. This object is created by default when the cluster is created. -
You have installed the OpenShift CLI (
oc).
Procedure
Edit the
ConfigMapobject:Edit the
user-workload-monitoring-configConfigMapobject in theopenshift-user-workload-monitoringproject:$ oc -n openshift-user-workload-monitoring edit configmap user-workload-monitoring-config
Add your PVC configuration for the component under
data/config.yaml:apiVersion: v1 kind: ConfigMap metadata: name: user-workload-monitoring-config namespace: openshift-user-workload-monitoring data: config.yaml: | <component>: volumeClaimTemplate: spec: storageClassName: <storage_class> resources: requests: storage: <amount_of_storage>See the Kubernetes documentation on PersistentVolumeClaims for information on how to specify
volumeClaimTemplate.The following example configures a PVC that claims persistent storage for the Prometheus instance that monitors user-defined projects:
apiVersion: v1
kind: ConfigMap
metadata:
  name: user-workload-monitoring-config
  namespace: openshift-user-workload-monitoring
data:
  config.yaml: |
    prometheus:
      volumeClaimTemplate:
        spec:
          storageClassName: gp3
          resources:
            requests:
              storage: 40Gi
The above example uses the
gp3storage class.The following example configures a PVC that claims persistent storage for Thanos Ruler:
apiVersion: v1 kind: ConfigMap metadata: name: user-workload-monitoring-config namespace: openshift-user-workload-monitoring data: config.yaml: | thanosRuler: volumeClaimTemplate: spec: storageClassName: gp3 resources: requests: storage: 10GiNoteStorage requirements for the
thanosRulercomponent depend on the number of rules that are evaluated and how many samples each rule generates.
Save the file to apply the changes. The pods affected by the new configuration are restarted automatically and the new storage configuration is applied.
WarningWhen changes are saved to a monitoring config map, the pods and other resources in the related project might be redeployed. The running monitoring processes in that project might also be restarted.
3.7.3. Modifying the retention time and size for Prometheus metrics data
By default, Prometheus retains metrics data for the following durations:
- Core platform monitoring: 15 days
- Monitoring for user-defined projects: 24 hours
You can modify the retention time for the Prometheus instance that monitors user-defined projects, to change how soon the data is deleted. You can also set the maximum amount of disk space the retained metrics data uses. If the data reaches this size limit, Prometheus deletes the oldest data first until the disk space used is again below the limit.
Note the following behaviors of these data retention settings:
-
The size-based retention policy applies to all data block directories in the
/prometheusdirectory, including persistent blocks, write-ahead log (WAL) data, and m-mapped chunks. -
Data in the
/waland/head_chunksdirectories counts toward the retention size limit, but Prometheus never purges data from these directories based on size- or time-based retention policies. Thus, if you set a retention size limit lower than the maximum size set for the/waland/head_chunksdirectories, you have configured the system not to retain any data blocks in the/prometheusdata directories. - The size-based retention policy is applied only when Prometheus cuts a new data block, which occurs every two hours after the WAL contains at least three hours of data.
-
If you do not explicitly define values for either
retentionorretentionSize, retention time defaults to 15 days for core platform monitoring and 24 hours for user-defined project monitoring. Retention size is not set. -
If you define values for both
retentionandretentionSize, both values apply. If any data blocks exceed the defined retention time or the defined size limit, Prometheus purges these data blocks. -
If you define a value for
retentionSizeand do not defineretention, only theretentionSizevalue applies. -
If you do not define a value for
retentionSizeand only define a value forretention, only theretentionvalue applies. -
If you set the
retentionSizeorretentionvalue to0, the default settings apply. The default settings set retention time to 15 days for core platform monitoring and 24 hours for user-defined project monitoring. By default, retention size is not set.
Data compaction occurs every two hours. Therefore, a persistent volume (PV) might fill up before compaction, potentially exceeding the retentionSize limit. In such cases, the KubePersistentVolumeFillingUp alert fires until the space on a PV is lower than the retentionSize limit.
Prerequisites
-
You have access to the cluster as a user with the
dedicated-adminrole. -
The
user-workload-monitoring-configConfigMapobject exists. This object is created by default when the cluster is created. -
You have installed the OpenShift CLI (
oc).
Procedure
Edit the
ConfigMapobject:Edit the
user-workload-monitoring-configConfigMapobject in theopenshift-user-workload-monitoringproject:$ oc -n openshift-user-workload-monitoring edit configmap user-workload-monitoring-config
Add the retention time and size configuration under
data/config.yaml:apiVersion: v1 kind: ConfigMap metadata: name: user-workload-monitoring-config namespace: openshift-user-workload-monitoring data: config.yaml: | prometheus: retention: <time_specification> 1 retentionSize: <size_specification> 2- 1
- The retention time: a number directly followed by
ms(milliseconds),s(seconds),m(minutes),h(hours),d(days),w(weeks), ory(years). You can also combine time values for specific times, such as1h30m15s. - 2
- The retention size: a number directly followed by
B(bytes),KB(kilobytes),MB(megabytes),GB(gigabytes),TB(terabytes),PB(petabytes), orEB(exabytes).
The following example sets the retention time to 24 hours and the retention size to 10 gigabytes for the Prometheus instance that monitors user-defined projects:
apiVersion: v1
kind: ConfigMap
metadata:
  name: user-workload-monitoring-config
  namespace: openshift-user-workload-monitoring
data:
  config.yaml: |
    prometheus:
      retention: 24h
      retentionSize: 10GB
Save the file to apply the changes. The pods affected by the new configuration restart automatically.
WarningWhen changes are saved to a monitoring config map, the pods and other resources in the related project might be redeployed. The running monitoring processes in that project might also be restarted.
3.7.4. Modifying the retention time for Thanos Ruler metrics data
By default, for user-defined projects, Thanos Ruler automatically retains metrics data for 24 hours. You can modify the retention time to change how long this data is retained by specifying a time value in the user-workload-monitoring-config config map in the openshift-user-workload-monitoring namespace.
Prerequisites
-
You have access to the cluster as a user with the
dedicated-adminrole. -
The
user-workload-monitoring-configConfigMapobject exists. This object is created by default when the cluster is created. -
You have installed the OpenShift CLI (
oc).
Procedure
Edit the
user-workload-monitoring-configConfigMapobject in theopenshift-user-workload-monitoringproject:$ oc -n openshift-user-workload-monitoring edit configmap user-workload-monitoring-config
Add the retention time configuration under
data/config.yaml:apiVersion: v1 kind: ConfigMap metadata: name: user-workload-monitoring-config namespace: openshift-user-workload-monitoring data: config.yaml: | thanosRuler: retention: <time_specification> 1- 1
- Specify the retention time in the following format: a number directly followed by
ms(milliseconds),s(seconds),m(minutes),h(hours),d(days),w(weeks), ory(years). You can also combine time values for specific times, such as1h30m15s. The default is24h.
The following example sets the retention time to 10 days for Thanos Ruler data:
apiVersion: v1
kind: ConfigMap
metadata:
  name: user-workload-monitoring-config
  namespace: openshift-user-workload-monitoring
data:
  config.yaml: |
    thanosRuler:
      retention: 10d
Save the file to apply the changes. The pods affected by the new configuration automatically restart.
WarningSaving changes to a monitoring config map might restart monitoring processes and redeploy the pods and other resources in the related project. The running monitoring processes in that project might also restart.
Additional resources
3.8. Configuring remote write storage
You can configure remote write storage to enable Prometheus to send ingested metrics to remote systems for long-term storage. Doing so has no impact on how or for how long Prometheus stores metrics.
Prerequisites
-
You have access to the cluster as a user with the
dedicated-adminrole. -
The
user-workload-monitoring-configConfigMapobject exists. This object is created by default when the cluster is created. -
You have installed the OpenShift CLI (
oc). You have set up a remote write compatible endpoint (such as Thanos) and know the endpoint URL. See the Prometheus remote endpoints and storage documentation for information about endpoints that are compatible with the remote write feature.
ImportantRed Hat only provides information for configuring remote write senders and does not offer guidance on configuring receiver endpoints. Customers are responsible for setting up their own endpoints that are remote-write compatible. Issues with endpoint receiver configurations are not included in Red Hat production support.
You have set up authentication credentials in a
Secretobject for the remote write endpoint. You must create the secret in theopenshift-user-workload-monitoringnamespace.WarningTo reduce security risks, use HTTPS and authentication to send metrics to an endpoint.
Procedure
Edit the
ConfigMapobject:Edit the
user-workload-monitoring-configConfigMapobject in theopenshift-user-workload-monitoringproject:$ oc -n openshift-user-workload-monitoring edit configmap user-workload-monitoring-config
-
Add a
remoteWrite:section underdata/config.yaml/prometheus. Add an endpoint URL and authentication credentials in this section:
apiVersion: v1 kind: ConfigMap metadata: name: user-workload-monitoring-config namespace: openshift-user-workload-monitoring data: config.yaml: | prometheus: remoteWrite: - url: "https://remote-write-endpoint.example.com" 1 <endpoint_authentication_credentials> 2- 1
- The URL of the remote write endpoint.
- 2
- The authentication method and credentials for the endpoint. Currently supported authentication methods are AWS Signature Version 4, authentication using HTTP an
Authorizationrequest header, basic authentication, OAuth 2.0, and TLS client. See Supported remote write authentication settings below for sample configurations of supported authentication methods.
Add write relabel configuration values after the authentication credentials:
apiVersion: v1 kind: ConfigMap metadata: name: user-workload-monitoring-config namespace: openshift-user-workload-monitoring data: config.yaml: | prometheus: remoteWrite: - url: "https://remote-write-endpoint.example.com" <endpoint_authentication_credentials> <your_write_relabel_configs> 1- 1
- The write relabel configuration settings.
For
<your_write_relabel_configs>substitute a list of write relabel configurations for metrics that you want to send to the remote endpoint.The following sample shows how to forward a single metric called
my_metric:apiVersion: v1 kind: ConfigMap metadata: name: user-workload-monitoring-config namespace: openshift-user-workload-monitoring data: config.yaml: | prometheus: remoteWrite: - url: "https://remote-write-endpoint.example.com" writeRelabelConfigs: - sourceLabels: [__name__] regex: 'my_metric' action: keepSee the Prometheus relabel_config documentation for information about write relabel configuration options.
Save the file to apply the changes. The pods affected by the new configuration restart automatically.
WarningSaving changes to a monitoring
ConfigMapobject might redeploy the pods and other resources in the related project. Saving changes might also restart the running monitoring processes in that project.
3.8.1. Supported remote write authentication settings
You can use different methods to authenticate with a remote write endpoint. Currently supported authentication methods are AWS Signature Version 4, basic authentication, authorization, OAuth 2.0, and TLS client. The following table provides details about supported authentication methods for use with remote write.
| Authentication method | Config map field | Description |
|---|---|---|
| AWS Signature Version 4 |
| This method uses AWS Signature Version 4 authentication to sign requests. You cannot use this method simultaneously with authorization, OAuth 2.0, or Basic authentication. |
| Basic authentication |
| Basic authentication sets the authorization header on every remote write request with the configured username and password. |
| authorization |
|
Authorization sets the |
| OAuth 2.0 |
|
An OAuth 2.0 configuration uses the client credentials grant type. Prometheus fetches an access token from |
| TLS client |
| A TLS client configuration specifies the CA certificate, the client certificate, and the client key file information used to authenticate with the remote write endpoint server using TLS. The sample configuration assumes that you have already created a CA certificate file, a client certificate file, and a client key file. |
3.8.2. Example remote write authentication settings
The following samples show different authentication settings you can use to connect to a remote write endpoint. Each sample also shows how to configure a corresponding Secret object that contains authentication credentials and other relevant settings. Each sample configures authentication for use with monitoring user-defined projects in the openshift-user-workload-monitoring namespace.
Example 3.1. Sample YAML for AWS Signature Version 4 authentication
The following shows the settings for a sigv4 secret named sigv4-credentials in the openshift-user-workload-monitoring namespace.
apiVersion: v1
kind: Secret
metadata:
  name: sigv4-credentials
  namespace: openshift-user-workload-monitoring
stringData:
  accessKey: <AWS_access_key> 1
  secretKey: <AWS_secret_key> 2
type: Opaque
The following shows sample AWS Signature Version 4 remote write authentication settings that use a Secret object named sigv4-credentials in the openshift-user-workload-monitoring namespace:
apiVersion: v1
kind: ConfigMap
metadata:
  name: user-workload-monitoring-config
  namespace: openshift-user-workload-monitoring
data:
  config.yaml: |
    prometheus:
      remoteWrite:
      - url: "https://authorization.example.com/api/write"
        sigv4:
          region: <AWS_region> 1
          accessKey:
            name: sigv4-credentials 2
            key: accessKey 3
          secretKey:
            name: sigv4-credentials 4
            key: secretKey 5
          profile: <AWS_profile_name> 6
roleArn: <AWS_role_arn> 7- 1
- The AWS region.
- 2 4
- The name of the
Secretobject containing the AWS API access credentials. - 3
- The key that contains the AWS API access key in the specified
Secretobject. - 5
- The key that contains the AWS API secret key in the specified
Secretobject. - 6
- The name of the AWS profile that is being used to authenticate.
- 7
- The unique identifier for the Amazon Resource Name (ARN) assigned to your role.
Example 3.2. Sample YAML for basic authentication
The following shows sample basic authentication settings for a Secret object named rw-basic-auth in the openshift-user-workload-monitoring namespace:
apiVersion: v1
kind: Secret
metadata:
  name: rw-basic-auth
  namespace: openshift-user-workload-monitoring
stringData:
  user: <basic_username> 1
  password: <basic_password> 2
type: Opaque
The following sample shows a basicAuth remote write configuration that uses a Secret object named rw-basic-auth in the openshift-user-workload-monitoring namespace. It assumes that you have already set up authentication credentials for the endpoint.
apiVersion: v1
kind: ConfigMap
metadata:
  name: user-workload-monitoring-config
  namespace: openshift-user-workload-monitoring
data:
  config.yaml: |
    prometheus:
      remoteWrite:
      - url: "https://basicauth.example.com/api/write"
        basicAuth:
          username:
            name: rw-basic-auth 1
            key: user 2
          password:
            name: rw-basic-auth 3
key: password 4Example 3.3. Sample YAML for authentication with a bearer token using a Secret Object
The following shows bearer token settings for a Secret object named rw-bearer-auth in the openshift-user-workload-monitoring namespace:
apiVersion: v1
kind: Secret
metadata:
  name: rw-bearer-auth
  namespace: openshift-user-workload-monitoring
stringData:
  token: <authentication_token> 1
type: Opaque- 1
- The authentication token.
The following shows sample bearer token config map settings that use a Secret object named rw-bearer-auth in the openshift-user-workload-monitoring namespace:
apiVersion: v1
kind: ConfigMap
metadata:
  name: user-workload-monitoring-config
  namespace: openshift-user-workload-monitoring
data:
  config.yaml: |
    enableUserWorkload: true
    prometheus:
      remoteWrite:
      - url: "https://authorization.example.com/api/write"
        authorization:
          type: Bearer 1
          credentials:
            name: rw-bearer-auth 2
key: token 3Example 3.4. Sample YAML for OAuth 2.0 authentication
The following shows sample OAuth 2.0 settings for a Secret object named oauth2-credentials in the openshift-user-workload-monitoring namespace:
apiVersion: v1
kind: Secret
metadata:
  name: oauth2-credentials
  namespace: openshift-user-workload-monitoring
stringData:
  id: <oauth2_id> 1
  secret: <oauth2_secret> 2
  token: <oauth2_authentication_token> 3
type: Opaque
The following shows an oauth2 remote write authentication sample configuration that uses a Secret object named oauth2-credentials in the openshift-user-workload-monitoring namespace:
apiVersion: v1
kind: ConfigMap
metadata:
  name: user-workload-monitoring-config
  namespace: openshift-user-workload-monitoring
data:
  config.yaml: |
    prometheus:
      remoteWrite:
      - url: "https://test.example.com/api/write"
        oauth2:
          clientId:
            secret:
              name: oauth2-credentials 1
              key: id 2
          clientSecret:
            name: oauth2-credentials 3
            key: secret 4
          tokenUrl: https://example.com/oauth2/token 5
          scopes: 6
          - <scope_1>
          - <scope_2>
          endpointParams: 7
            param1: <parameter_1>
param2: <parameter_2>- 1 3
- The name of the corresponding
Secretobject. Note thatClientIdcan alternatively refer to aConfigMapobject, althoughclientSecretmust refer to aSecretobject. - 2 4
- The key that contains the OAuth 2.0 credentials in the specified
Secretobject. - 5
- The URL used to fetch a token with the specified
clientIdandclientSecret. - 6
- The OAuth 2.0 scopes for the authorization request. These scopes limit what data the tokens can access.
- 7
- The OAuth 2.0 authorization request parameters required for the authorization server.
Example 3.5. Sample YAML for TLS client authentication
The following shows sample TLS client settings for a tls Secret object named mtls-bundle in the openshift-user-workload-monitoring namespace.
apiVersion: v1
kind: Secret
metadata:
  name: mtls-bundle
  namespace: openshift-user-workload-monitoring
data:
  ca.crt: <ca_cert> 1
  client.crt: <client_cert> 2
  client.key: <client_key> 3
type: tls
The following sample shows a tlsConfig remote write authentication configuration that uses a TLS Secret object named mtls-bundle.
apiVersion: v1
kind: ConfigMap
metadata:
  name: user-workload-monitoring-config
  namespace: openshift-user-workload-monitoring
data:
  config.yaml: |
    prometheus:
      remoteWrite:
      - url: "https://remote-write-endpoint.example.com"
        tlsConfig:
          ca:
            secret:
              name: mtls-bundle 1
              key: ca.crt 2
          cert:
            secret:
              name: mtls-bundle 3
              key: client.crt 4
          keySecret:
            name: mtls-bundle 5
key: client.key 6- 1 3 5
- The name of the corresponding
Secretobject that contains the TLS authentication credentials. Note thatcaandcertcan alternatively refer to aConfigMapobject, thoughkeySecretmust refer to aSecretobject. - 2
- The key in the specified
Secretobject that contains the CA certificate for the endpoint. - 4
- The key in the specified
Secretobject that contains the client certificate for the endpoint. - 6
- The key in the specified
Secretobject that contains the client key secret.
Additional resources
- See Setting up remote write compatible endpoints for steps to create a remote write compatible endpoint (such as Thanos).
- See Tuning remote write settings for information about how to optimize remote write settings for different use cases.
3.9. Adding cluster ID labels to metrics
If you manage multiple Red Hat OpenShift Service on AWS clusters and use the remote write feature to send metrics data from these clusters to an external storage location, you can add cluster ID labels to identify the metrics data coming from different clusters. You can then query these labels to identify the source cluster for a metric and distinguish that data from similar metrics data sent by other clusters.
This way, if you manage many clusters for multiple customers and send metrics data to a single centralized storage system, you can use cluster ID labels to query metrics for a particular cluster or customer.
Creating and using cluster ID labels involves three general steps:
- Configuring the write relabel settings for remote write storage.
- Adding cluster ID labels to the metrics.
- Querying these labels to identify the source cluster or customer for a metric.
3.9.1. Creating cluster ID labels for metrics
You can create cluster ID labels for metrics by editing the settings in the user-workload-monitoring-config config map in the openshift-user-workload-monitoring namespace.
Prerequisites
-
You have access to the cluster as a user with the
dedicated-adminrole. -
The
user-workload-monitoring-configConfigMap object exists. This object is created by default when the cluster is created. -
You have installed the OpenShift CLI (
oc). - You have configured remote write storage.
Procedure
Edit the
ConfigMapobject:Edit the
user-workload-monitoring-configConfigMapobject in theopenshift-user-workload-monitoringproject:$ oc -n openshift-user-workload-monitoring edit configmap user-workload-monitoring-config
In the
writeRelabelConfigs:section underdata/config.yaml/prometheus/remoteWrite, add cluster ID relabel configuration values:apiVersion: v1 kind: ConfigMap metadata: name: user-workload-monitoring-config namespace: openshift-user-workload-monitoring data: config.yaml: | prometheus: remoteWrite: - url: "https://remote-write-endpoint.example.com" <endpoint_authentication_credentials> writeRelabelConfigs: 1 - <relabel_config> 2The following sample shows how to forward a metric with the cluster ID label
cluster_idin user-workload monitoring:apiVersion: v1 kind: ConfigMap metadata: name: user-workload-monitoring-config namespace: openshift-user-workload-monitoring data: config.yaml: | prometheus: remoteWrite: - url: "https://remote-write-endpoint.example.com" writeRelabelConfigs: - sourceLabels: - __tmp_openshift_cluster_id__ 1 targetLabel: cluster_id 2 action: replace 3- 1
- The system initially applies a temporary cluster ID source label named
__tmp_openshift_cluster_id__. This temporary label gets replaced by the cluster ID label name that you specify. - 2
- Specify the name of the cluster ID label for metrics sent to remote write storage. If you use a label name that already exists for a metric, that value is overwritten with the name of this cluster ID label. For the label name, do not use
__tmp_openshift_cluster_id__. The final relabeling step removes labels that use this name. - 3
- The
replacewrite relabel action replaces the temporary label with the target label for outgoing metrics. This action is the default and is applied if no action is specified.
Save the file to apply the changes to the
ConfigMapobject. The pods affected by the updated configuration automatically restart.WarningSaving changes to a monitoring
ConfigMapobject might redeploy the pods and other resources in the related project. Saving changes might also restart the running monitoring processes in that project.
Additional resources
- For details about write relabel configuration, see Configuring remote write storage.
3.10. Controlling the impact of unbound metrics attributes in user-defined projects
Developers can create labels to define attributes for metrics in the form of key-value pairs. The number of potential key-value pairs corresponds to the number of possible values for an attribute. An attribute that has an unlimited number of potential values is called an unbound attribute. For example, a customer_id attribute is unbound because it has an infinite number of possible values.
Every assigned key-value pair has a unique time series. The use of many unbound attributes in labels can result in an exponential increase in the number of time series created. This can impact Prometheus performance and can consume a lot of disk space.
A dedicated-admin can use the following measures to control the impact of unbound metrics attributes in user-defined projects:
- Limit the number of samples that can be accepted per target scrape in user-defined projects
- Limit the number of scraped labels, the length of label names, and the length of label values
- Create alerts that fire when a scrape sample threshold is reached or when the target cannot be scraped
Limiting scrape samples can help prevent the issues caused by adding many unbound attributes to labels. Developers can also prevent the underlying cause by limiting the number of unbound attributes that they define for metrics. Using attributes that are bound to a limited set of possible values reduces the number of potential key-value pair combinations.
3.10.1. Setting scrape sample and label limits for user-defined projects
You can limit the number of samples that can be accepted per target scrape in user-defined projects. You can also limit the number of scraped labels, the length of label names, and the length of label values.
If you set sample or label limits, no further sample data is ingested for that target scrape after the limit is reached.
Prerequisites
-
You have access to the cluster as a user with the
dedicated-adminrole. -
The
user-workload-monitoring-configConfigMapobject exists. This object is created by default when the cluster is created. -
You have installed the OpenShift CLI (
oc).
Procedure
Edit the
user-workload-monitoring-configConfigMapobject in theopenshift-user-workload-monitoringproject:$ oc -n openshift-user-workload-monitoring edit configmap user-workload-monitoring-config
Add the
enforcedSampleLimitconfiguration todata/config.yamlto limit the number of samples that can be accepted per target scrape in user-defined projects:apiVersion: v1 kind: ConfigMap metadata: name: user-workload-monitoring-config namespace: openshift-user-workload-monitoring data: config.yaml: | prometheus: enforcedSampleLimit: 50000 1- 1
- A value is required if this parameter is specified. This
enforcedSampleLimitexample limits the number of samples that can be accepted per target scrape in user-defined projects to 50,000.
Add the
enforcedLabelLimit,enforcedLabelNameLengthLimit, andenforcedLabelValueLengthLimitconfigurations todata/config.yamlto limit the number of scraped labels, the length of label names, and the length of label values in user-defined projects:apiVersion: v1 kind: ConfigMap metadata: name: user-workload-monitoring-config namespace: openshift-user-workload-monitoring data: config.yaml: | prometheus: enforcedLabelLimit: 500 1 enforcedLabelNameLengthLimit: 50 2 enforcedLabelValueLengthLimit: 600 3- 1
- Specifies the maximum number of labels per scrape. The default value is
0, which specifies no limit. - 2
- Specifies the maximum length in characters of a label name. The default value is
0, which specifies no limit. - 3
- Specifies the maximum length in characters of a label value. The default value is
0, which specifies no limit.
Save the file to apply the changes. The limits are applied automatically.
WarningWhen changes are saved to the
user-workload-monitoring-configConfigMapobject, the pods and other resources in theopenshift-user-workload-monitoringproject might be redeployed. The running monitoring processes in that project might also be restarted.
Chapter 4. Configuring external Alertmanager instances
The Red Hat OpenShift Service on AWS monitoring stack includes a local Alertmanager instance that routes alerts from Prometheus. You can add external Alertmanager instances to route alerts for user-defined projects.
If you add the same external Alertmanager configuration for multiple clusters and disable the local instance for each cluster, you can then manage alert routing for multiple clusters by using a single external Alertmanager instance.
Prerequisites
-
You have access to the cluster as a user with the
dedicated-adminrole. -
The
user-workload-monitoring-configConfigMapobject exists. This object is created by default when the cluster is created. -
You have installed the OpenShift CLI (
oc).
Procedure
Edit the
ConfigMapobject.Edit the
user-workload-monitoring-configconfig map in theopenshift-user-workload-monitoringproject:$ oc -n openshift-user-workload-monitoring edit configmap user-workload-monitoring-config
-
Add a
<component>/additionalAlertmanagerConfigs:section underdata/config.yaml/. Add the configuration details for additional Alertmanagers in this section:
apiVersion: v1
kind: ConfigMap
metadata:
  name: user-workload-monitoring-config
  namespace: openshift-user-workload-monitoring
data:
  config.yaml: |
    <component>:
      additionalAlertmanagerConfigs:
      - <alertmanager_specification>
For
<component>, substitute one of two supported external Alertmanager components:prometheusorthanosRuler.For
<alertmanager_specification>, substitute authentication and other configuration details for additional Alertmanager instances. Currently supported authentication methods are bearer token (bearerToken) and client TLS (tlsConfig). The following sample config map configures an additional Alertmanager using Thanos Ruler with a bearer token and client TLS authentication:apiVersion: v1 kind: ConfigMap metadata: name: user-workload-monitoring-config namespace: openshift-user-workload-monitoring data: config.yaml: | thanosRuler: additionalAlertmanagerConfigs: - scheme: https pathPrefix: / timeout: "30s" apiVersion: v1 bearerToken: name: alertmanager-bearer-token key: token tlsConfig: key: name: alertmanager-tls key: tls.key cert: name: alertmanager-tls key: tls.crt ca: name: alertmanager-tls key: tls.ca staticConfigs: - external-alertmanager1-remote.com - external-alertmanager1-remote2.com
-
Save the file to apply the changes to the
ConfigMapobject. The new component placement configuration is applied automatically. -
Save the file to apply the changes to the
ConfigMapobject. The new component placement configuration is applied automatically.
Chapter 5. Configuring secrets for Alertmanager
The Red Hat OpenShift Service on AWS monitoring stack includes Alertmanager, which routes alerts from Prometheus to endpoint receivers. If you need to authenticate with a receiver so that Alertmanager can send alerts to it, you can configure Alertmanager to use a secret that contains authentication credentials for the receiver.
For example, you can configure Alertmanager to use a secret to authenticate with an endpoint receiver that requires a certificate issued by a private Certificate Authority (CA). You can also configure Alertmanager to use a secret to authenticate with a receiver that requires a password file for Basic HTTP authentication. In either case, authentication details are contained in the Secret object rather than in the ConfigMap object.
5.1. Adding a secret to the Alertmanager configuration
You can add secrets to the Alertmanager configuration for user-defined projects by editing the user-workload-monitoring-config config map in the openshift-user-workload-monitoring project.
After you add a secret to the config map, the secret is mounted as a volume at /etc/alertmanager/secrets/<secret_name> within the alertmanager container for the Alertmanager pods.
Prerequisites
-
You have access to the cluster as a user with the
dedicated-adminrole. -
The
user-workload-monitoring-configConfigMapobject exists. This object is created by default when the cluster is created. -
You have created the secret to be configured in Alertmanager in the
openshift-user-workload-monitoringproject. -
You have installed the OpenShift CLI (
oc).
Procedure
Edit the
ConfigMapobject.Edit the
user-workload-monitoring-configconfig map in theopenshift-user-workload-monitoringproject:$ oc -n openshift-user-workload-monitoring edit configmap user-workload-monitoring-config
Add a
secrets:section underdata/config.yaml/alertmanager/secretswith the following configuration:apiVersion: v1 kind: ConfigMap metadata: name: user-workload-monitoring-config namespace: openshift-user-workload-monitoring data: config.yaml: | alertmanager: secrets: 1 - <secret_name_1> 2 - <secret_name_2>- 1
- This section contains the secrets to be mounted into Alertmanager. The secrets must be located within the same namespace as the Alertmanager object.
- 2
- The name of the
Secretobject that contains authentication credentials for the receiver. If you add multiple secrets, place each one on a new line.
The following sample config map settings configure Alertmanager to use two
Secretobjects namedtest-secretandtest-secret-api-token:apiVersion: v1 kind: ConfigMap metadata: name: user-workload-monitoring-config namespace: openshift-user-workload-monitoring data: config.yaml: | alertmanager: enabled: true secrets: - test-secret - test-api-receiver-token
-
Save the file to apply the changes to the
ConfigMapobject. The new configuration is applied automatically.
5.2. Attaching additional labels to your time series and alerts
You can attach custom labels to all time series and alerts leaving Prometheus by using the external labels feature of Prometheus.
Prerequisites
-
You have access to the cluster as a user with the
dedicated-adminrole. -
The
user-workload-monitoring-configConfigMapobject exists. This object is created by default when the cluster is created. -
You have installed the OpenShift CLI (
oc).
Procedure
Edit the
ConfigMapobject:Edit the
user-workload-monitoring-configConfigMapobject in theopenshift-user-workload-monitoringproject:$ oc -n openshift-user-workload-monitoring edit configmap user-workload-monitoring-config
Define a map of labels you want to add for every metric under
data/config.yaml:apiVersion: v1 kind: ConfigMap metadata: name: user-workload-monitoring-config namespace: openshift-user-workload-monitoring data: config.yaml: | prometheus: externalLabels: <key>: <value> 1- 1
- Substitute
<key>: <value>with a map of key-value pairs where<key>is a unique name for the new label and<value>is its value.
Warning-
Do not use
prometheusorprometheus_replicaas key names, because they are reserved and will be overwritten. -
Do not use
clusterormanaged_clusteras key names. Using them can cause issues where you are unable to see data in the developer dashboards.
NoteIn the
openshift-user-workload-monitoringproject, Prometheus handles metrics and Thanos Ruler handles alerting and recording rules. SettingexternalLabelsforprometheusin theuser-workload-monitoring-configConfigMapobject will only configure external labels for metrics and not for any rules.For example, to add metadata about the region and environment to all time series and alerts related to user-defined projects, use the following example:
apiVersion: v1
kind: ConfigMap
metadata:
  name: user-workload-monitoring-config
  namespace: openshift-user-workload-monitoring
data:
  config.yaml: |
    prometheus:
      externalLabels:
        region: eu
        environment: prod
Save the file to apply the changes. The new configuration is applied automatically.
WarningWhen changes are saved to a monitoring config map, the pods and other resources in the related project might be redeployed. The running monitoring processes in that project might also be restarted.
Chapter 6. Configuring pod topology spread constraints for monitoring
You can use pod topology spread constraints to control how Thanos Ruler pods are spread across a network topology when Red Hat OpenShift Service on AWS pods are deployed in multiple availability zones.
Pod topology spread constraints are suitable for controlling pod scheduling within hierarchical topologies in which nodes are spread across different infrastructure levels, such as regions and zones within those regions. Additionally, by being able to schedule pods in different zones, you can improve network latency in certain scenarios.
Additional resources
6.1. Setting up pod topology spread constraints for Thanos Ruler
For user-defined monitoring, you can set up pod topology spread constraints for Thanos Ruler to fine tune how pod replicas are scheduled to nodes across zones. Doing so helps ensure that Thanos Ruler pods are highly available and run more efficiently, because workloads are spread across nodes in different data centers or hierarchical infrastructure zones.
You configure pod topology spread constraints for Thanos Ruler in the user-workload-monitoring-config config map.
Prerequisites
-
You have access to the cluster as a user with the
dedicated-adminrole. -
The
user-workload-monitoring-configConfigMapobject exists. This object is created by default when the cluster is created. -
You have installed the OpenShift CLI (
oc).
Procedure
Edit the
user-workload-monitoring-configconfig map in theopenshift-user-workload-monitoringnamespace:$ oc -n openshift-user-workload-monitoring edit configmap user-workload-monitoring-config
Add values for the following settings under
data/config.yaml/thanosRulerto configure pod topology spread constraints:apiVersion: v1 kind: ConfigMap metadata: name: user-workload-monitoring-config namespace: openshift-user-workload-monitoring data: config.yaml: | thanosRuler: topologySpreadConstraints: - maxSkew: 1 1 topologyKey: monitoring 2 whenUnsatisfiable: ScheduleAnyway 3 labelSelector: matchLabels: 4 app.kubernetes.io/name: thanos-ruler- 1
- Specify a numeric value for
maxSkew, which defines the degree to which pods are allowed to be unevenly distributed. This field is required, and the value must be greater than zero. The value specified has a different effect depending on what value you specify forwhenUnsatisfiable. - 2
- Specify a key of node labels for
topologyKey. This field is required. Nodes that have a label with this key and identical values are considered to be in the same topology. The scheduler will try to put a balanced number of pods into each domain. - 3
- Specify a value for
whenUnsatisfiable. This field is required. Available options areDoNotScheduleandScheduleAnyway. SpecifyDoNotScheduleif you want themaxSkewvalue to define the maximum difference allowed between the number of matching pods in the target topology and the global minimum. SpecifyScheduleAnywayif you want the scheduler to still schedule the pod but to give higher priority to nodes that might reduce the skew. - 4
- Specify a value for
matchLabels. This value is used to identify the set of matching pods to which to apply the constraints.
Save the file to apply the changes automatically.
WarningWhen you save changes to the
user-workload-monitoring-configconfig map, the pods and other resources in theopenshift-user-workload-monitoringproject might be redeployed. The running monitoring processes in that project might also restart.
6.2. Setting log levels for monitoring components
You can configure the log level for Alertmanager, Prometheus Operator, Prometheus, and Thanos Ruler.
The following log levels can be applied to the relevant component in the user-workload-monitoring-config ConfigMap objects:
-
debug. Log debug, informational, warning, and error messages. -
info. Log informational, warning, and error messages. -
warn. Log warning and error messages only. -
error. Log error messages only.
The default log level is info.
Prerequisites
-
You have access to the cluster as a user with the
dedicated-adminrole. -
The
user-workload-monitoring-configConfigMapobject exists. This object is created by default when the cluster is created. -
You have installed the OpenShift CLI (
oc).
Procedure
Edit the
ConfigMapobject:Edit the
user-workload-monitoring-configConfigMapobject in theopenshift-user-workload-monitoringproject:$ oc -n openshift-user-workload-monitoring edit configmap user-workload-monitoring-config
Add
logLevel: <log_level>for a component underdata/config.yaml:apiVersion: v1 kind: ConfigMap metadata: name: user-workload-monitoring-config namespace: openshift-user-workload-monitoring data: config.yaml: | <component>: 1 logLevel: <log_level> 2- 1
- The monitoring stack component for which you are setting a log level. For user workload monitoring, available component values are
alertmanager,prometheus,prometheusOperator, andthanosRuler. - 2
- The log level to apply to the component. The available values are
error,warn,info, anddebug. The default value isinfo.
Save the file to apply the changes. The pods for the component restart automatically when you apply the log-level change.
WarningWhen changes are saved to a monitoring config map, the pods and other resources in the related project might be redeployed. The running monitoring processes in that project might also be restarted.
Confirm that the log-level has been applied by reviewing the deployment or pod configuration in the related project. The following example checks the log level in the
prometheus-operatordeployment in theopenshift-user-workload-monitoringproject:$ oc -n openshift-user-workload-monitoring get deploy prometheus-operator -o yaml | grep "log-level"
Example output
- --log-level=debug
Check that the pods for the component are running. The following example lists the status of pods in the
openshift-user-workload-monitoringproject:$ oc -n openshift-user-workload-monitoring get pods
NoteIf an unrecognized
logLevelvalue is included in theConfigMapobject, the pods for the component might not restart successfully.
6.3. Enabling the query log file for Prometheus
You can configure Prometheus to write all queries that have been run by the engine to a log file.
Because log rotation is not supported, only enable this feature temporarily when you need to troubleshoot an issue. After you finish troubleshooting, disable query logging by reverting the changes you made to the ConfigMap object to enable the feature.
Prerequisites
-
You have access to the cluster as a user with the
dedicated-adminrole. -
The
user-workload-monitoring-configConfigMap object exists. This object is created by default when the cluster is created. -
You have installed the OpenShift CLI (
oc).
Procedure
Edit the
user-workload-monitoring-configConfigMapobject in theopenshift-user-workload-monitoringproject:$ oc -n openshift-user-workload-monitoring edit configmap user-workload-monitoring-config
Add
queryLogFile: <path>forprometheusunderdata/config.yaml:apiVersion: v1 kind: ConfigMap metadata: name: user-workload-monitoring-config namespace: openshift-user-workload-monitoring data: config.yaml: | prometheus: queryLogFile: <path> 1- 1
- The full path to the file in which queries will be logged.
Save the file to apply the changes.
WarningWhen you save changes to a monitoring config map, pods and other resources in the related project might be redeployed. The running monitoring processes in that project might also be restarted.
Verify that the pods for the component are running. The following example command lists the status of pods in the
openshift-user-workload-monitoringproject:$ oc -n openshift-user-workload-monitoring get pods
Read the query log:
$ oc -n openshift-user-workload-monitoring exec prometheus-user-workload-0 -- cat <path>
ImportantRevert the setting in the config map after you have examined the logged query information.
Chapter 7. Disabling monitoring for user-defined projects
As a dedicated-admin, you can disable monitoring for user-defined projects. You can also exclude individual projects from user workload monitoring.
7.1. Disabling monitoring for user-defined projects
By default, monitoring for user-defined projects is enabled. If you do not want to use the built-in monitoring stack to monitor user-defined projects, you can disable it.
Prerequisites
- You logged in to OpenShift Cluster Manager.
Procedure
- From the OpenShift Cluster Manager Hybrid Cloud Console, select a cluster.
- Click the Settings tab.
Click the Enable user workload monitoring check box to unselect the option, and then click Save.
User workload monitoring is disabled. The Prometheus, Prometheus Operator, and Thanos Ruler components are stopped in the
openshift-user-workload-monitoringproject.
7.2. Excluding a user-defined project from monitoring
Individual user-defined projects can be excluded from user workload monitoring. To do so, add the openshift.io/user-monitoring label to the project’s namespace with a value of false.
Procedure
Add the label to the project namespace:
$ oc label namespace my-project 'openshift.io/user-monitoring=false'
To re-enable monitoring, remove the label from the namespace:
$ oc label namespace my-project 'openshift.io/user-monitoring-'
NoteIf there were any active monitoring targets for the project, it may take a few minutes for Prometheus to stop scraping them after adding the label.
Chapter 8. Enabling alert routing for user-defined projects
In Red Hat OpenShift Service on AWS, a dedicated-admin can enable alert routing for user-defined projects. This process consists of two general steps:
- Enable alert routing for user-defined projects to use a separate Alertmanager instance.
- Grant users permission to configure alert routing for user-defined projects.
After you complete these steps, developers and other users can configure custom alerts and alert routing for their user-defined projects.
8.1. Understanding alert routing for user-defined projects
As a dedicated-admin, you can enable alert routing for user-defined projects. With this feature, you can allow users with the alert-routing-edit role to configure alert notification routing and receivers for user-defined projects. These notifications are routed by an Alertmanager instance dedicated to user-defined monitoring.
Users can then create and configure user-defined alert routing by creating or editing the AlertmanagerConfig objects for their user-defined projects without the help of an administrator.
After a user has defined alert routing for a user-defined project, user-defined alert notifications are routed to the alertmanager-user-workload pods in the openshift-user-workload-monitoring namespace.
The following are limitations of alert routing for user-defined projects:
-
For user-defined alerting rules, user-defined routing is scoped to the namespace in which the resource is defined. For example, a routing configuration in namespace
ns1only applies toPrometheusRulesresources in the same namespace. -
When a namespace is excluded from user-defined monitoring,
AlertmanagerConfigresources in the namespace cease to be part of the Alertmanager configuration.
8.2. Enabling a separate Alertmanager instance for user-defined alert routing
In Red Hat OpenShift Service on AWS, you may want to deploy a dedicated Alertmanager instance for user-defined projects, which provides user-defined alerts separate from default platform alerts. In these cases, you can optionally enable a separate instance of Alertmanager to send alerts for user-defined projects only.
Prerequisites
-
You have access to the cluster as a user with the
dedicated-adminrole. -
The
user-workload-monitoring-configConfigMapobject exists. This object is created by default when the cluster is created. -
You have installed the OpenShift CLI (
oc).
Procedure
Edit the
user-workload-monitoring-configConfigMapobject:$ oc -n openshift-user-workload-monitoring edit configmap user-workload-monitoring-config
Add
enabled: trueandenableAlertmanagerConfig: truein thealertmanagersection underdata/config.yaml:apiVersion: v1 kind: ConfigMap metadata: name: user-workload-monitoring-config namespace: openshift-user-workload-monitoring data: config.yaml: | alertmanager: enabled: true 1 enableAlertmanagerConfig: true 2- 1
- Set the
enabledvalue totrueto enable a dedicated instance of the Alertmanager for user-defined projects in a cluster. Set the value tofalseor omit the key entirely to disable the Alertmanager for user-defined projects. If you set this value tofalseor if the key is omitted, user-defined alerts are routed to the default platform Alertmanager instance. - 2
- Set the
enableAlertmanagerConfigvalue totrueto enable users to define their own alert routing configurations withAlertmanagerConfigobjects.
- Save the file to apply the changes. The dedicated instance of Alertmanager for user-defined projects starts automatically.
Verification
Verify that the
alert-manager-user-workloadpods are running:# oc -n openshift-user-workload-monitoring get pods
Example output
NAME                                   READY   STATUS    RESTARTS   AGE
alertmanager-user-workload-0           6/6     Running   0          38s
alertmanager-user-workload-1           6/6     Running   0          38s
...
8.3. Granting users permission to configure alert routing for user-defined projects
You can grant users permission to configure alert routing for user-defined projects.
Prerequisites
-
You have access to the cluster as a user with the
dedicated-adminrole. -
The
user-workload-monitoring-configConfigMapobject exists. This object is created by default when the cluster is created. - The user account that you are assigning the role to already exists.
-
You have installed the OpenShift CLI (
oc).
Procedure
Assign the
alert-routing-editcluster role to a user in the user-defined project:$ oc -n <namespace> adm policy add-role-to-user alert-routing-edit <user> 1- 1
- For
<namespace>, substitute the namespace for the user-defined project, such asns1. For<user>, substitute the username for the account to which you want to assign the role.
Additional resources
8.4. Next steps
Chapter 9. Managing metrics
You can collect metrics to monitor how cluster components and your own workloads are performing.
9.1. Understanding metrics
In Red Hat OpenShift Service on AWS, cluster components are monitored by scraping metrics exposed through service endpoints. You can also configure metrics collection for user-defined projects. Metrics enable you to monitor how cluster components and your own workloads are performing.
You can define the metrics that you want to provide for your own workloads by using Prometheus client libraries at the application level.
In Red Hat OpenShift Service on AWS, metrics are exposed through an HTTP service endpoint under the /metrics canonical name. You can list all available metrics for a service by running a curl query against http://<endpoint>/metrics. For instance, you can expose a route to the prometheus-example-app example application and then run the following to view all of its available metrics:
$ curl http://<example_app_endpoint>/metrics
Example output
# HELP http_requests_total Count of all HTTP requests
# TYPE http_requests_total counter
http_requests_total{code="200",method="get"} 4
http_requests_total{code="404",method="get"} 2
# HELP version Version information about this binary
# TYPE version gauge
version{version="v0.1.0"} 1
Additional resources
9.2. Setting up metrics collection for user-defined projects
You can create a ServiceMonitor resource to scrape metrics from a service endpoint in a user-defined project. This assumes that your application uses a Prometheus client library to expose metrics to the /metrics canonical name.
This section describes how to deploy a sample service in a user-defined project and then create a ServiceMonitor resource that defines how that service should be monitored.
9.2.1. Deploying a sample service
To test monitoring of a service in a user-defined project, you can deploy a sample service.
Procedure
-
Create a YAML file for the service configuration. In this example, it is called
prometheus-example-app.yaml. Add the following deployment and service configuration details to the file:
apiVersion: v1
kind: Namespace
metadata:
  name: ns1
---
apiVersion: apps/v1
kind: Deployment
metadata:
  labels:
    app: prometheus-example-app
  name: prometheus-example-app
  namespace: ns1
spec:
  replicas: 1
  selector:
    matchLabels:
      app: prometheus-example-app
  template:
    metadata:
      labels:
        app: prometheus-example-app
    spec:
      containers:
      - image: ghcr.io/rhobs/prometheus-example-app:0.4.2
        imagePullPolicy: IfNotPresent
        name: prometheus-example-app
---
apiVersion: v1
kind: Service
metadata:
  labels:
    app: prometheus-example-app
  name: prometheus-example-app
  namespace: ns1
spec:
  ports:
  - port: 8080
    protocol: TCP
    targetPort: 8080
    name: web
  selector:
    app: prometheus-example-app
  type: ClusterIP
This configuration deploys a service named
prometheus-example-appin the user-definedns1project. This service exposes the customversionmetric.Apply the configuration to the cluster:
$ oc apply -f prometheus-example-app.yaml
It takes some time to deploy the service.
You can check that the pod is running:
$ oc -n ns1 get pod
Example output
NAME                                      READY     STATUS    RESTARTS   AGE
prometheus-example-app-7857545cb7-sbgwq   1/1       Running   0          81m
9.2.2. Specifying how a service is monitored
To use the metrics exposed by your service, you must configure Red Hat OpenShift Service on AWS monitoring to scrape metrics from the /metrics endpoint. You can do this using a ServiceMonitor custom resource definition (CRD) that specifies how a service should be monitored, or a PodMonitor CRD that specifies how a pod should be monitored. The former requires a Service object, while the latter does not, allowing Prometheus to directly scrape metrics from the metrics endpoint exposed by a pod.
This procedure shows you how to create a ServiceMonitor resource for a service in a user-defined project.
Prerequisites
-
You have access to the cluster as a user with the
dedicated-adminrole or themonitoring-editrole. For this example, you have deployed the
prometheus-example-appsample service in thens1project.NoteThe
prometheus-example-appsample service does not support TLS authentication.
Procedure
-
Create a YAML file for the
ServiceMonitorresource configuration. In this example, the file is calledexample-app-service-monitor.yaml. Add the following
ServiceMonitorresource configuration details:apiVersion: monitoring.coreos.com/v1 kind: ServiceMonitor metadata: labels: k8s-app: prometheus-example-monitor name: prometheus-example-monitor namespace: ns1 spec: endpoints: - interval: 30s port: web scheme: http selector: matchLabels: app: prometheus-example-appThis defines a
ServiceMonitorresource that scrapes the metrics exposed by theprometheus-example-appsample service, which includes theversionmetric.NoteA
ServiceMonitorresource in a user-defined namespace can only discover services in the same namespace. That is, thenamespaceSelectorfield of theServiceMonitorresource is always ignored.Apply the configuration to the cluster:
$ oc apply -f example-app-service-monitor.yaml
It takes some time to deploy the
ServiceMonitorresource.You can check that the
ServiceMonitorresource is running:$ oc -n ns1 get servicemonitor
Example output
NAME                         AGE
prometheus-example-monitor   81m
9.3. Querying metrics
The Red Hat OpenShift Service on AWS monitoring dashboard enables you to run Prometheus Query Language (PromQL) queries to examine metrics visualized on a plot. This functionality provides information about the state of a cluster and any user-defined workloads that you are monitoring.
As a dedicated-admin, you can query one or more namespaces at a time for metrics about user-defined projects.
As a developer, you must specify a project name when querying metrics. You must have the required privileges to view metrics for the selected project.
9.3.1. Querying metrics for all projects as a cluster administrator
As a dedicated-admin or as a user with view permissions for all projects, you can access metrics for all default Red Hat OpenShift Service on AWS and user-defined projects in the Metrics UI.
Only dedicated administrators have access to the third-party UIs provided with Red Hat OpenShift Service on AWS monitoring.
Prerequisites
-
You have access to the cluster as a user with the
dedicated-adminrole or with view permissions for all projects. -
You have installed the OpenShift CLI (
oc).
Procedure
- From the Administrator perspective in the Red Hat OpenShift Service on AWS web console, select Observe → Metrics.
To add one or more queries, do any of the following:
Option Description Create a custom query.
Add your Prometheus Query Language (PromQL) query to the Expression field.
As you type a PromQL expression, autocomplete suggestions appear in a drop-down list. These suggestions include functions, metrics, labels, and time tokens. You can use the keyboard arrows to select one of these suggested items and then press Enter to add the item to your expression. You can also move your mouse pointer over a suggested item to view a brief description of that item.
Add multiple queries.
Select Add query.
Duplicate an existing query.
Select the Options menu
 next to the query, then choose Duplicate query.
Disable a query from being run.
Select the Options menu
next to the query and choose Disable query.
To run queries that you created, select Run queries. The metrics from the queries are visualized on the plot. If a query is invalid, the UI shows an error message.
NoteQueries that operate on large amounts of data might time out or overload the browser when drawing time series graphs. To avoid this, select Hide graph and calibrate your query using only the metrics table. Then, after finding a feasible query, enable the plot to draw the graphs.
NoteBy default, the query table shows an expanded view that lists every metric and its current value. You can select ˅ to minimize the expanded view for a query.
- Optional: The page URL now contains the queries you ran. To use this set of queries again in the future, save this URL.
Explore the visualized metrics. Initially, all metrics from all enabled queries are shown on the plot. You can select which metrics are shown by doing any of the following:
Option Description Hide all metrics from a query.
Click the Options menu
for the query and click Hide all series.
Hide a specific metric.
Go to the query table and click the colored square near the metric name.
Zoom into the plot and change the time range.
Either:
- Visually select the time range by clicking and dragging on the plot horizontally.
- Use the menu in the left upper corner to select the time range.
Reset the time range.
Select Reset zoom.
Display outputs for all queries at a specific point in time.
Hold the mouse cursor on the plot at that point. The query outputs will appear in a pop-up box.
Hide the plot.
Select Hide graph.
Additional resources
- For more information about creating PromQL queries, see the Prometheus query documentation.
9.3.2. Querying metrics for user-defined projects as a developer
You can access metrics for a user-defined project as a developer or as a user with view permissions for the project.
In the Developer perspective, the Metrics UI includes some predefined CPU, memory, bandwidth, and network packet queries for the selected project. You can also run custom Prometheus Query Language (PromQL) queries for CPU, memory, bandwidth, network packet and application metrics for the project.
Developers can only use the Developer perspective and not the Administrator perspective. As a developer, you can only query metrics for one project at a time. Developers cannot access the third-party UIs provided with Red Hat OpenShift Service on AWS monitoring.
Prerequisites
- You have access to the cluster as a developer or as a user with view permissions for the project that you are viewing metrics for.
- You have enabled monitoring for user-defined projects.
- You have deployed a service in a user-defined project.
-
You have created a
ServiceMonitorcustom resource definition (CRD) for the service to define how the service is monitored.
Procedure
- From the Developer perspective in the Red Hat OpenShift Service on AWS web console, select Observe → Metrics.
- Select the project that you want to view metrics for in the Project: list.
Select a query from the Select query list, or create a custom PromQL query based on the selected query by selecting Show PromQL. The metrics from the queries are visualized on the plot.
NoteIn the Developer perspective, you can only run one query at a time.
Explore the visualized metrics by doing any of the following:
Option Description Zoom into the plot and change the time range.
Either:
- Visually select the time range by clicking and dragging on the plot horizontally.
- Use the menu in the left upper corner to select the time range.
Reset the time range.
Select Reset zoom.
Display outputs for all queries at a specific point in time.
Hold the mouse cursor on the plot at that point. The query outputs appear in a pop-up box.
Additional resources
- For more information about creating PromQL queries, see the Prometheus query documentation.
9.4. Getting detailed information about a metrics target
In the Administrator perspective in the Red Hat OpenShift Service on AWS web console, you can use the Metrics targets page to view, search, and filter the endpoints that are currently targeted for scraping, which helps you to identify and troubleshoot problems. For example, you can view the current status of targeted endpoints to see when Red Hat OpenShift Service on AWS Monitoring is not able to scrape metrics from a targeted component.
The Metrics targets page shows targets for user-defined projects.
Prerequisites
-
You have access to the cluster as a user with the
dedicated-adminrole.
Procedure
In the Administrator perspective, select Observe → Targets. The Metrics targets page opens with a list of all service endpoint targets that are being scraped for metrics.
This page shows details about targets for default Red Hat OpenShift Service on AWS and user-defined projects. This page lists the following information for each target:
- Service endpoint URL being scraped
- ServiceMonitor component being monitored
- The up or down status of the target
- Namespace
- Last scrape time
- Duration of the last scrape
Optional: The list of metrics targets can be long. To find a specific target, do any of the following:
Option Description Filter the targets by status and source.
Select filters in the Filter list.
The following filtering options are available:
Status filters:
- Up. The target is currently up and being actively scraped for metrics.
- Down. The target is currently down and not being scraped for metrics.
Source filters:
- Platform. Platform-level targets relate only to default Red Hat OpenShift Service on AWS projects. These projects provide core Red Hat OpenShift Service on AWS functionality.
- User. User targets relate to user-defined projects. These projects are user-created and can be customized.
Search for a target by name or label.
Enter a search term in the Text or Label field next to the search box.
Sort the targets.
Click one or more of the Endpoint Status, Namespace, Last Scrape, and Scrape Duration column headers.
Click the URL in the Endpoint column for a target to navigate to its Target details page. This page provides information about the target, including the following:
- The endpoint URL being scraped for metrics
- The current Up or Down status of the target
- A link to the namespace
- A link to the ServiceMonitor details
- Labels attached to the target
- The most recent time that the target was scraped for metrics
Chapter 10. Managing alerts
In Red Hat OpenShift Service on AWS 4, the Alerting UI enables you to manage alerts, silences, and alerting rules.
- Alerting rules. Alerting rules contain a set of conditions that outline a particular state within a cluster. Alerts are triggered when those conditions are true. An alerting rule can be assigned a severity that defines how the alerts are routed.
- Alerts. An alert is fired when the conditions defined in an alerting rule are true. Alerts provide a notification that a set of circumstances are apparent within an Red Hat OpenShift Service on AWS cluster.
- Silences. A silence can be applied to an alert to prevent notifications from being sent when the conditions for an alert are true. You can mute an alert after the initial notification, while you work on resolving the underlying issue.
The alerts, silences, and alerting rules that are available in the Alerting UI relate to the projects that you have access to. For example, if you are logged in as a user with the cluster-admin role, you can access all alerts, silences, and alerting rules.
If you are a non-administrator user, you can create and silence alerts if you are assigned the following user roles:
-
The
cluster-monitoring-viewcluster role, which allows you to access Alertmanager -
The
monitoring-alertmanager-editrole, which permits you to create and silence alerts in the Administrator perspective in the web console -
The
monitoring-rules-editcluster role, which permits you to create and silence alerts in the Developer perspective in the web console
10.1. Accessing the Alerting UI in the Administrator and Developer perspectives
The Alerting UI is accessible through the Administrator perspective and the Developer perspective of the Red Hat OpenShift Service on AWS web console.
- In the Administrator perspective, go to Observe → Alerting. The three main pages in the Alerting UI in this perspective are the Alerts, Silences, and Alerting rules pages.
- In the Developer perspective, go to Observe → <project_name> → Alerts. In this perspective, alerts, silences, and alerting rules are all managed from the Alerts page. The results shown in the Alerts page are specific to the selected project.
In the Developer perspective, you can select from core Red Hat OpenShift Service on AWS and user-defined projects that you have access to in the Project: <project_name> list. However, alerts, silences, and alerting rules relating to core Red Hat OpenShift Service on AWS projects are not displayed if you are not logged in as a cluster administrator.
10.2. Searching and filtering alerts, silences, and alerting rules
You can filter the alerts, silences, and alerting rules that are displayed in the Alerting UI. This section provides a description of each of the available filtering options.
Understanding alert filters
In the Administrator perspective, the Alerts page in the Alerting UI provides details about alerts relating to default Red Hat OpenShift Service on AWS and user-defined projects. The page includes a summary of severity, state, and source for each alert. The time at which an alert went into its current state is also shown.
You can filter by alert state, severity, and source. By default, only Platform alerts that are Firing are displayed. The following describes each alert filtering option:
State filters:
-
Firing. The alert is firing because the alert condition is true and the optional
forduration has passed. The alert continues to fire while the condition remains true. - Pending. The alert is active but is waiting for the duration that is specified in the alerting rule before it fires.
- Silenced. The alert is now silenced for a defined time period. Silences temporarily mute alerts based on a set of label selectors that you define. Notifications are not sent for alerts that match all the listed values or regular expressions.
-
Firing. The alert is firing because the alert condition is true and the optional
Severity filters:
- Critical. The condition that triggered the alert could have a critical impact. The alert requires immediate attention when fired and is typically paged to an individual or to a critical response team.
- Warning. The alert provides a warning notification about something that might require attention to prevent a problem from occurring. Warnings are typically routed to a ticketing system for non-immediate review.
- Info. The alert is provided for informational purposes only.
- None. The alert has no defined severity.
- You can also create custom severity definitions for alerts relating to user-defined projects.
Source filters:
- Platform. Platform-level alerts relate only to default Red Hat OpenShift Service on AWS projects. These projects provide core Red Hat OpenShift Service on AWS functionality.
- User. User alerts relate to user-defined projects. These alerts are user-created and are customizable. User-defined workload monitoring can be enabled postinstallation to provide observability into your own workloads.
Understanding silence filters
In the Administrator perspective, the Silences page in the Alerting UI provides details about silences applied to alerts in default Red Hat OpenShift Service on AWS and user-defined projects. The page includes a summary of the state of each silence and the time at which a silence ends.
You can filter by silence state. By default, only Active and Pending silences are displayed. The following describes each silence state filter option:
State filters:
- Active. The silence is active and the alert will be muted until the silence is expired.
- Pending. The silence has been scheduled and it is not yet active.
- Expired. The silence has expired and notifications will be sent if the conditions for an alert are true.
Understanding alerting rule filters
In the Administrator perspective, the Alerting rules page in the Alerting UI provides details about alerting rules relating to default Red Hat OpenShift Service on AWS and user-defined projects. The page includes a summary of the state, severity, and source for each alerting rule.
You can filter alerting rules by alert state, severity, and source. By default, only Platform alerting rules are displayed. The following describes each alerting rule filtering option:
Alert state filters:
-
Firing. The alert is firing because the alert condition is true and the optional
forduration has passed. The alert continues to fire while the condition remains true. - Pending. The alert is active but is waiting for the duration that is specified in the alerting rule before it fires.
- Silenced. The alert is now silenced for a defined time period. Silences temporarily mute alerts based on a set of label selectors that you define. Notifications are not sent for alerts that match all the listed values or regular expressions.
- Not Firing. The alert is not firing.
-
Firing. The alert is firing because the alert condition is true and the optional
Severity filters:
- Critical. The conditions defined in the alerting rule could have a critical impact. When true, these conditions require immediate attention. Alerts relating to the rule are typically paged to an individual or to a critical response team.
- Warning. The conditions defined in the alerting rule might require attention to prevent a problem from occurring. Alerts relating to the rule are typically routed to a ticketing system for non-immediate review.
- Info. The alerting rule provides informational alerts only.
- None. The alerting rule has no defined severity.
- You can also create custom severity definitions for alerting rules relating to user-defined projects.
Source filters:
- Platform. Platform-level alerting rules relate only to default Red Hat OpenShift Service on AWS projects. These projects provide core Red Hat OpenShift Service on AWS functionality.
- User. User-defined workload alerting rules relate to user-defined projects. These alerting rules are user-created and are customizable. User-defined workload monitoring can be enabled postinstallation to provide observability into your own workloads.
Searching and filtering alerts, silences, and alerting rules in the Developer perspective
In the Developer perspective, the Alerts page in the Alerting UI provides a combined view of alerts and silences relating to the selected project. A link to the governing alerting rule is provided for each displayed alert.
In this view, you can filter by alert state and severity. By default, all alerts in the selected project are displayed if you have permission to access the project. These filters are the same as those described for the Administrator perspective.
10.3. Getting information about alerts, silences, and alerting rules
The Alerting UI provides detailed information about alerts and their governing alerting rules and silences.
Prerequisites
- You have access to the cluster as a developer or as a user with view permissions for the project that you are viewing alerts for.
Procedure
To obtain information about alerts in the Administrator perspective:
- Open the Red Hat OpenShift Service on AWS web console and go to the Observe → Alerting → Alerts page.
- Optional: Search for alerts by name by using the Name field in the search list.
- Optional: Filter alerts by state, severity, and source by selecting filters in the Filter list.
- Optional: Sort the alerts by clicking one or more of the Name, Severity, State, and Source column headers.
Click the name of an alert to view its Alert details page. The page includes a graph that illustrates alert time series data. It also provides the following information about the alert:
- A description of the alert
- Messages associated with the alert
- Labels attached to the alert
- A link to its governing alerting rule
- Silences for the alert, if any exist
To obtain information about silences in the Administrator perspective:
- Go to the Observe → Alerting → Silences page.
- Optional: Filter the silences by name using the Search by name field.
- Optional: Filter silences by state by selecting filters in the Filter list. By default, Active and Pending filters are applied.
- Optional: Sort the silences by clicking one or more of the Name, Firing alerts, State, and Creator column headers.
Select the name of a silence to view its Silence details page. The page includes the following details:
- Alert specification
- Start time
- End time
- Silence state
- Number and list of firing alerts
To obtain information about alerting rules in the Administrator perspective:
- Go to the Observe → Alerting → Alerting rules page.
- Optional: Filter alerting rules by state, severity, and source by selecting filters in the Filter list.
- Optional: Sort the alerting rules by clicking one or more of the Name, Severity, Alert state, and Source column headers.
Select the name of an alerting rule to view its Alerting rule details page. The page provides the following details about the alerting rule:
- Alerting rule name, severity, and description.
- The expression that defines the condition for firing the alert.
- The time for which the condition should be true for an alert to fire.
- A graph for each alert governed by the alerting rule, showing the value with which the alert is firing.
- A table of all alerts governed by the alerting rule.
To obtain information about alerts, silences, and alerting rules in the Developer perspective:
- Go to the Observe → <project_name> → Alerts page.
View details for an alert, silence, or an alerting rule:
- Alert details can be viewed by clicking a greater than symbol (>) next to an alert name and then selecting the alert from the list.
Silence details can be viewed by clicking a silence in the Silenced by section of the Alert details page. The Silence details page includes the following information:
- Alert specification
- Start time
- End time
- Silence state
- Number and list of firing alerts
-
Alerting rule details can be viewed by clicking the
menu next to an alert in the Alerts page and then clicking View Alerting Rule.
Only alerts, silences, and alerting rules relating to the selected project are displayed in the Developer perspective.
Additional resources
- See the Cluster Monitoring Operator runbooks to help diagnose and resolve issues that trigger specific Red Hat OpenShift Service on AWS monitoring alerts.
10.4. Managing silences
You can create a silence for an alert in the Red Hat OpenShift Service on AWS web console in both the Administrator and Developer perspectives. After you create a silence, you will not receive notifications about an alert when the alert fires.
Creating silences is useful in scenarios where you have received an initial alert notification, and you do not want to receive further notifications during the time in which you resolve the underlying issue causing the alert to fire.
When creating a silence, you must specify whether it becomes active immediately or at a later time. You must also set a duration period after which the silence expires.
After you create silences, you can view, edit, and expire them.
10.4.1. Silencing alerts
You can silence a specific alert or silence alerts that match a specification that you define.
Prerequisites
-
If you are a cluster administrator, you have access to the cluster as a user with the
dedicated-adminrole. If you are a non-administrator user, you have access to the cluster as a user with the following user roles:
-
The
cluster-monitoring-viewcluster role, which allows you to access Alertmanager. -
The
monitoring-alertmanager-editrole, which permits you to create and silence alerts in the Administrator perspective in the web console. -
The
monitoring-rules-editcluster role, which permits you to create and silence alerts in the Developer perspective in the web console.
-
The
Procedure
To silence a specific alert in the Administrator perspective:
- Go to Observe → Alerting → Alerts in the Red Hat OpenShift Service on AWS web console.
-
For the alert that you want to silence, click
and select Silence alert to open the Silence alert page with a default configuration for the chosen alert.
Optional: Change the default configuration details for the silence.
NoteYou must add a comment before saving a silence.
- To save the silence, click Silence.
To silence a specific alert in the Developer perspective:
- Go to Observe → <project_name> → Alerts in the Red Hat OpenShift Service on AWS web console.
- If necessary, expand the details for the alert by selecting a greater than symbol (>) next to the alert name.
- Click the alert message in the expanded view to open the Alert details page for the alert.
- Click Silence alert to open the Silence alert page with a default configuration for the alert.
Optional: Change the default configuration details for the silence.
NoteYou must add a comment before saving a silence.
- To save the silence, click Silence.
To silence a set of alerts by creating a silence configuration in the Administrator perspective:
- Go to Observe → Alerting → Silences in the Red Hat OpenShift Service on AWS web console.
- Click Create silence.
On the Create silence page, set the schedule, duration, and label details for an alert.
NoteYou must add a comment before saving a silence.
- To create silences for alerts that match the labels that you entered, click Silence.
To silence a set of alerts by creating a silence configuration in the Developer perspective:
- Go to Observe → <project_name> → Silences in the Red Hat OpenShift Service on AWS web console.
- Click Create silence.
On the Create silence page, set the duration and label details for an alert.
NoteYou must add a comment before saving a silence.
- To create silences for alerts that match the labels that you entered, click Silence.
10.4.2. Editing silences
You can edit a silence, which expires the existing silence and creates a new one with the changed configuration.
Prerequisites
-
If you are a cluster administrator, you have access to the cluster as a user with the
dedicated-adminrole. If you are a non-administrator user, you have access to the cluster as a user with the following user roles:
-
The
cluster-monitoring-viewcluster role, which allows you to access Alertmanager. -
The
monitoring-alertmanager-editrole, which permits you to create and silence alerts in the Administrator perspective in the web console. -
The
monitoring-rules-editcluster role, which permits you to create and silence alerts in the Developer perspective in the web console.
-
The
Procedure
To edit a silence in the Administrator perspective:
- Go to Observe → Alerting → Silences.
For the silence you want to modify, click
and select Edit silence.
Alternatively, you can click Actions and select Edit silence on the Silence details page for a silence.
- On the Edit silence page, make changes and click Silence. Doing so expires the existing silence and creates one with the updated configuration.
To edit a silence in the Developer perspective:
- Go to Observe → <project_name> → Silences.
For the silence you want to modify, click
and select Edit silence.
Alternatively, you can click Actions and select Edit silence on the Silence details page for a silence.
- On the Edit silence page, make changes and click Silence. Doing so expires the existing silence and creates one with the updated configuration.
10.4.3. Expiring silences
You can expire a single silence or multiple silences. Expiring a silence deactivates it permanently.
You cannot delete expired, silenced alerts. Expired silences older than 120 hours are garbage collected.
Prerequisites
-
If you are a cluster administrator, you have access to the cluster as a user with the
dedicated-adminrole. If you are a non-administrator user, you have access to the cluster as a user with the following user roles:
-
The
cluster-monitoring-viewcluster role, which allows you to access Alertmanager. -
The
monitoring-alertmanager-editrole, which permits you to create and silence alerts in the Administrator perspective in the web console. -
The
monitoring-rules-editcluster role, which permits you to create and silence alerts in the Developer perspective in the web console.
-
The
Procedure
To expire a silence or silences in the Administrator perspective:
- Go to Observe → Alerting → Silences.
- For the silence or silences you want to expire, select the checkbox in the corresponding row.
Click Expire 1 silence to expire a single selected silence or Expire <n> silences to expire multiple selected silences, where <n> is the number of silences you selected.
Alternatively, to expire a single silence you can click Actions and select Expire silence on the Silence details page for a silence.
To expire a silence in the Developer perspective:
- Go to Observe → <project_name> → Silences.
- For the silence or silences you want to expire, select the checkbox in the corresponding row.
Click Expire 1 silence to expire a single selected silence or Expire <n> silences to expire multiple selected silences, where <n> is the number of silences you selected.
Alternatively, to expire a single silence you can click Actions and select Expire silence on the Silence details page for a silence.
10.5. Managing alerting rules for user-defined projects
Red Hat OpenShift Service on AWS monitoring ships with a set of default alerting rules. As a cluster administrator, you can view the default alerting rules.
In Red Hat OpenShift Service on AWS 4, you can create, view, edit, and remove alerting rules in user-defined projects.
Managing alerting rules for user-defined projects is only available in Red Hat OpenShift Service on AWS version 4.11 and later.
Alerting rule considerations
- The default alerting rules are used specifically for the Red Hat OpenShift Service on AWS cluster.
- Some alerting rules intentionally have identical names. They send alerts about the same event with different thresholds, different severity, or both.
- Inhibition rules prevent notifications for lower severity alerts that are firing when a higher severity alert is also firing.
10.5.1. Optimizing alerting for user-defined projects
You can optimize alerting for your own projects by considering the following recommendations when creating alerting rules:
- Minimize the number of alerting rules that you create for your project. Create alerting rules that notify you of conditions that impact you. It is more difficult to notice relevant alerts if you generate many alerts for conditions that do not impact you.
- Create alerting rules for symptoms instead of causes. Create alerting rules that notify you of conditions regardless of the underlying cause. The cause can then be investigated. You will need many more alerting rules if each relates only to a specific cause. Some causes are then likely to be missed.
- Plan before you write your alerting rules. Determine what symptoms are important to you and what actions you want to take if they occur. Then build an alerting rule for each symptom.
- Provide clear alert messaging. State the symptom and recommended actions in the alert message.
- Include severity levels in your alerting rules. The severity of an alert depends on how you need to react if the reported symptom occurs. For example, a critical alert should be triggered if a symptom requires immediate attention by an individual or a critical response team.
Additional resources
- See the Prometheus alerting documentation for further guidelines on optimizing alerts
10.5.2. About creating alerting rules for user-defined projects
If you create alerting rules for a user-defined project, consider the following key behaviors and important limitations when you define the new rules:
A user-defined alerting rule can include metrics exposed by its own project in addition to the default metrics from core platform monitoring. You cannot include metrics from another user-defined project.
For example, an alerting rule for the
ns1user-defined project can use metrics exposed by thens1project in addition to core platform metrics, such as CPU and memory metrics. However, the rule cannot include metrics from a differentns2user-defined project.To reduce latency and to minimize the load on core platform monitoring components, you can add the
openshift.io/prometheus-rule-evaluation-scope: leaf-prometheuslabel to a rule. This label forces only the Prometheus instance deployed in theopenshift-user-workload-monitoringproject to evaluate the alerting rule and prevents the Thanos Ruler instance from doing so.ImportantIf an alerting rule has this label, your alerting rule can use only those metrics exposed by your user-defined project. Alerting rules you create based on default platform metrics might not trigger alerts.
10.5.3. Creating alerting rules for user-defined projects
You can create alerting rules for user-defined projects. Those alerting rules will trigger alerts based on the values of the chosen metrics.
- When you create an alerting rule, a project label is enforced on it even if a rule with the same name exists in another project.
- To help users understand the impact and cause of the alert, ensure that your alerting rule contains an alert message and severity value.
Prerequisites
- You have enabled monitoring for user-defined projects.
-
You are logged in as a user that has the
monitoring-rules-editcluster role for the project where you want to create an alerting rule. -
You have installed the OpenShift CLI (
oc).
Procedure
-
Create a YAML file for alerting rules. In this example, it is called
example-app-alerting-rule.yaml. Add an alerting rule configuration to the YAML file. The following example creates a new alerting rule named
example-alert. The alerting rule fires an alert when theversionmetric exposed by the sample service becomes0:apiVersion: monitoring.coreos.com/v1 kind: PrometheusRule metadata: name: example-alert namespace: ns1 spec: groups: - name: example rules: - alert: VersionAlert 1 expr: version{job="prometheus-example-app"} == 0 2 labels: severity: warning 3 annotations: message: This is an example alert. 4Apply the configuration file to the cluster:
$ oc apply -f example-app-alerting-rule.yaml
Additional resources
- See Monitoring overview for details about Red Hat OpenShift Service on AWS 4 monitoring architecture.
10.5.4. Accessing alerting rules for user-defined projects
To list alerting rules for a user-defined project, you must have been assigned the monitoring-rules-view cluster role for the project.
Prerequisites
- You have enabled monitoring for user-defined projects.
-
You are logged in as a user that has the
monitoring-rules-viewcluster role for your project. -
You have installed the OpenShift CLI (
oc).
Procedure
To list alerting rules in
<project>:$ oc -n <project> get prometheusrule
To list the configuration of an alerting rule, run the following:
$ oc -n <project> get prometheusrule <rule> -o yaml
10.5.5. Listing alerting rules for all projects in a single view
As a dedicated-admin, you can list alerting rules for core Red Hat OpenShift Service on AWS and user-defined projects together in a single view.
Prerequisites
-
You have access to the cluster as a user with the
dedicated-adminrole. -
You have installed the OpenShift CLI (
oc).
Procedure
- In the Administrator perspective, navigate to Observe → Alerting → Alerting rules.
Select the Platform and User sources in the Filter drop-down menu.
NoteThe Platform source is selected by default.
10.5.6. Removing alerting rules for user-defined projects
You can remove alerting rules for user-defined projects.
Prerequisites
- You have enabled monitoring for user-defined projects.
-
You are logged in as a user that has the
monitoring-rules-editcluster role for the project where you want to create an alerting rule. -
You have installed the OpenShift CLI (
oc).
Procedure
To remove rule
<foo>in<namespace>, run the following:$ oc -n <namespace> delete prometheusrule <foo>
Additional resources
- See the Alertmanager documentation
10.6. Sending notifications to external systems
In Red Hat OpenShift Service on AWS 4, firing alerts can be viewed in the Alerting UI. Alerts are not configured by default to be sent to any notification systems. You can configure Red Hat OpenShift Service on AWS to send alerts to the following receiver types:
- PagerDuty
- Webhook
- Slack
Routing alerts to receivers enables you to send timely notifications to the appropriate teams when failures occur. For example, critical alerts require immediate attention and are typically paged to an individual or a critical response team. Alerts that provide non-critical warning notifications might instead be routed to a ticketing system for non-immediate review.
Checking that alerting is operational by using the watchdog alert
Red Hat OpenShift Service on AWS monitoring includes a watchdog alert that fires continuously. Alertmanager repeatedly sends watchdog alert notifications to configured notification providers. The provider is usually configured to notify an administrator when it stops receiving the watchdog alert. This mechanism helps you quickly identify any communication issues between Alertmanager and the notification provider.
10.6.1. Creating alert routing for user-defined projects
If you are a non-administrator user who has been given the alert-routing-edit cluster role, you can create or edit alert routing for user-defined projects.
Prerequisites
- Alert routing has been enabled for user-defined projects.
-
You are logged in as a user that has the
alert-routing-editcluster role for the project for which you want to create alert routing. -
You have installed the OpenShift CLI (
oc).
Procedure
-
Create a YAML file for alert routing. The example in this procedure uses a file called
example-app-alert-routing.yaml. Add an
AlertmanagerConfigYAML definition to the file. For example:apiVersion: monitoring.coreos.com/v1beta1 kind: AlertmanagerConfig metadata: name: example-routing namespace: ns1 spec: route: receiver: default groupBy: [job] receivers: - name: default webhookConfigs: - url: https://example.org/postNoteFor user-defined alerting rules, user-defined routing is scoped to the namespace in which the resource is defined. For example, a routing configuration defined in the
AlertmanagerConfigobject for namespacens1only applies toPrometheusRulesresources in the same namespace.- Save the file.
Apply the resource to the cluster:
$ oc apply -f example-app-alert-routing.yaml
The configuration is automatically applied to the Alertmanager pods.
10.7. Applying a custom configuration to Alertmanager for user-defined alert routing
If you have enabled a separate instance of Alertmanager dedicated to user-defined alert routing, you can overwrite the configuration for this instance of Alertmanager by editing the alertmanager-user-workload secret in the openshift-user-workload-monitoring namespace.
Prerequisites
-
You have access to the cluster as a user with the
dedicated-adminrole. -
You have installed the OpenShift CLI (
oc).
Procedure
Print the currently active Alertmanager configuration into the file
alertmanager.yaml:$ oc -n openshift-user-workload-monitoring get secret alertmanager-user-workload --template='{{ index .data "alertmanager.yaml" }}' | base64 --decode > alertmanager.yamlEdit the configuration in
alertmanager.yaml:route: receiver: Default group_by: - name: Default routes: - matchers: - "service = prometheus-example-monitor" 1 receiver: <receiver> 2 receivers: - name: Default - name: <receiver> # <receiver_configuration>Apply the new configuration in the file:
$ oc -n openshift-user-workload-monitoring create secret generic alertmanager-user-workload --from-file=alertmanager.yaml --dry-run=client -o=yaml | oc -n openshift-user-workload-monitoring replace secret --filename=-
Additional resources
- See the PagerDuty official site for more information on PagerDuty.
-
See the PagerDuty Prometheus Integration Guide to learn how to retrieve the
service_key. - See Alertmanager configuration for configuring alerting through different alert receivers.
Chapter 11. Reviewing monitoring dashboards
Red Hat OpenShift Service on AWS provides monitoring dashboards that help you understand the state of user-defined projects.
Use the Administrator perspective to access dashboards for the core Red Hat OpenShift Service on AWS components, including the following items:
- API performance
- etcd
- Kubernetes compute resources
- Kubernetes network resources
- Prometheus
- USE method dashboards relating to cluster and node performance
- Node performance metrics
Figure 11.1. Example dashboard in the Administrator perspective
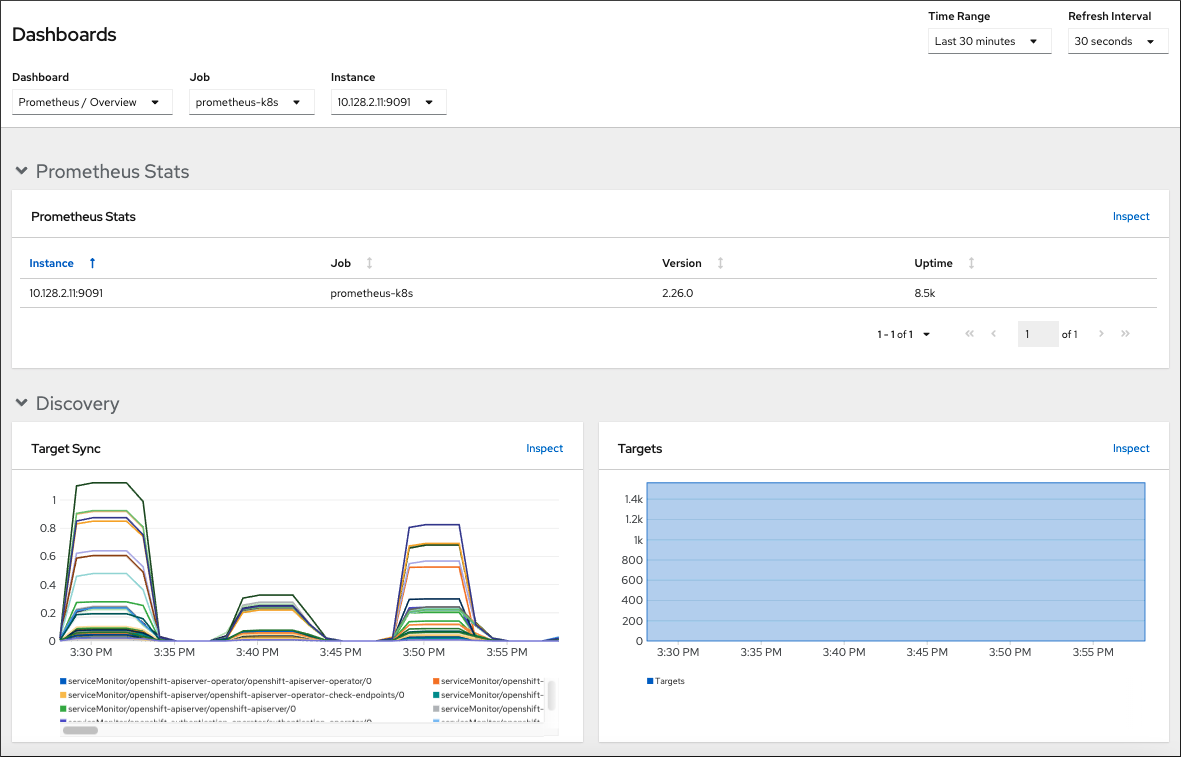
Use the Developer perspective to access Kubernetes compute resources dashboards that provide the following application metrics for a selected project:
- CPU usage
- Memory usage
- Bandwidth information
- Packet rate information
Figure 11.2. Example dashboard in the Developer perspective
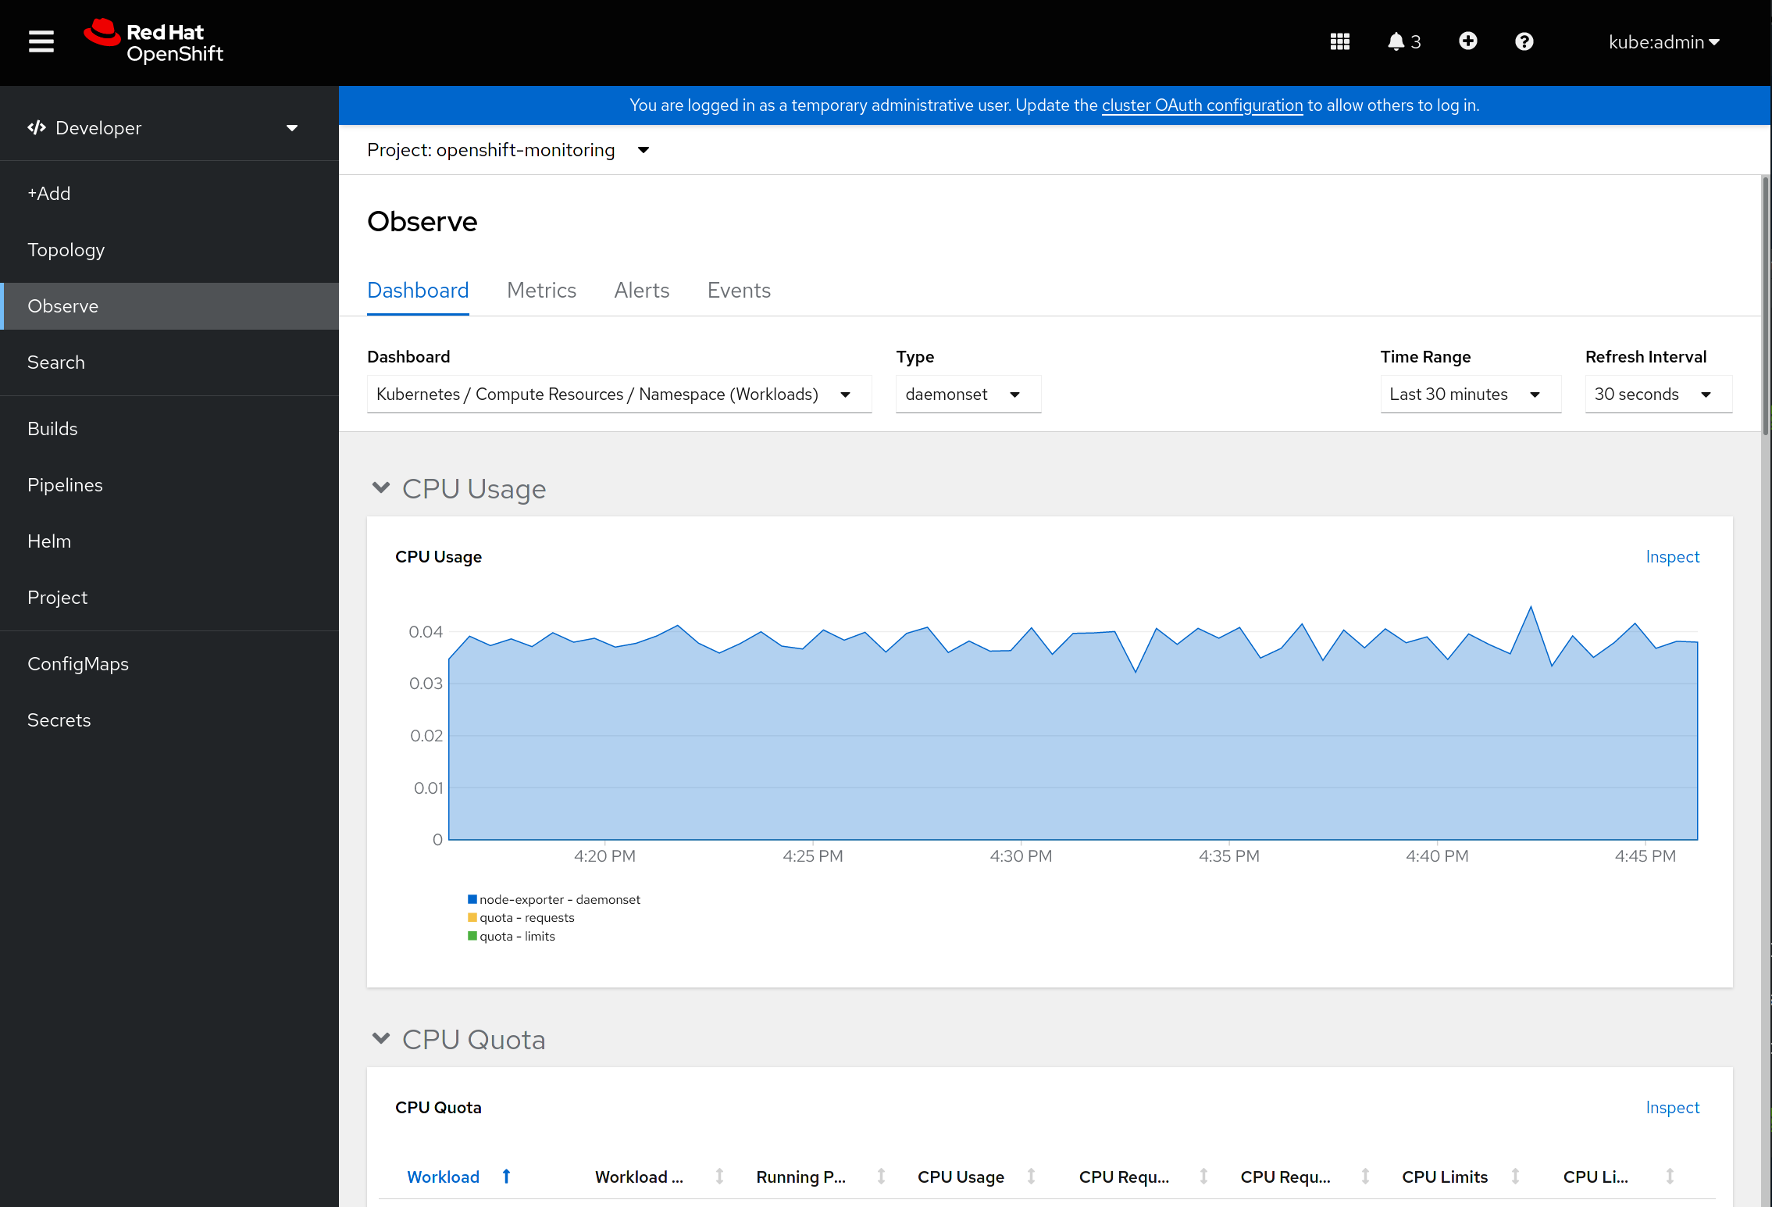
In the Developer perspective, you can view dashboards for only one project at a time.
11.1. Reviewing monitoring dashboards as a cluster administrator
In the Administrator perspective, you can view dashboards relating to core Red Hat OpenShift Service on AWS cluster components.
Prerequisites
-
You have access to the cluster as a user with the
dedicated-adminrole.
Procedure
- In the Administrator perspective in the Red Hat OpenShift Service on AWS web console, navigate to Observe → Dashboards.
- Choose a dashboard in the Dashboard list. Some dashboards, such as etcd and Prometheus dashboards, produce additional sub-menus when selected.
Optional: Select a time range for the graphs in the Time Range list.
- Select a pre-defined time period.
Set a custom time range by selecting Custom time range in the Time Range list.
- Input or select the From and To dates and times.
- Click Save to save the custom time range.
- Optional: Select a Refresh Interval.
- Hover over each of the graphs within a dashboard to display detailed information about specific items.
11.2. Reviewing monitoring dashboards as a developer
In the Developer perspective, you can view dashboards relating to a selected project. You must have access to monitor a project to view dashboard information for it.
Prerequisites
- You have access to the cluster as a developer or as a user.
- You have view permissions for the project that you are viewing the dashboard for.
Procedure
- In the Developer perspective in the Red Hat OpenShift Service on AWS web console, navigate to Observe → Dashboard.
- Select a project from the Project: drop-down list.
Select a dashboard from the Dashboard drop-down list to see the filtered metrics.
NoteAll dashboards produce additional sub-menus when selected, except Kubernetes / Compute Resources / Namespace (Pods).
Optional: Select a time range for the graphs in the Time Range list.
- Select a pre-defined time period.
Set a custom time range by selecting Custom time range in the Time Range list.
- Input or select the From and To dates and times.
- Click Save to save the custom time range.
- Optional: Select a Refresh Interval.
- Hover over each of the graphs within a dashboard to display detailed information about specific items.
11.3. Next steps
Chapter 12. Accessing monitoring APIs by using the CLI
In Red Hat OpenShift Service on AWS 4, you can access web service APIs for some monitoring components from the command line interface (CLI).
In certain situations, accessing API endpoints can degrade the performance and scalability of your cluster, especially if you use endpoints to retrieve, send, or query large amounts of metrics data.
To avoid these issues, follow these recommendations:
- Avoid querying endpoints frequently. Limit queries to a maximum of one every 30 seconds.
-
Do not try to retrieve all metrics data via the
/federateendpoint for Prometheus. Query it only when you want to retrieve a limited, aggregated data set. For example, retrieving fewer than 1,000 samples for each request helps minimize the risk of performance degradation.
12.1. About accessing monitoring web service APIs
You can directly access web service API endpoints from the command line for the following monitoring stack components:
- Prometheus
- Alertmanager
- Thanos Ruler
- Thanos Querier
To access Thanos Ruler and Thanos Querier service APIs, the requesting account must have get permission on the namespaces resource, which can be granted by binding the cluster-monitoring-view cluster role to the account.
When you access web service API endpoints for monitoring components, be aware of the following limitations:
- You can only use Bearer Token authentication to access API endpoints.
-
You can only access endpoints in the
/apipath for a route. If you try to access an API endpoint in a web browser, anApplication is not availableerror occurs. To access monitoring features in a web browser, use the Red Hat OpenShift Service on AWS web console to review monitoring dashboards.
Additional resources
12.2. Accessing a monitoring web service API
The following example shows how to query the service API receivers for the Alertmanager service used in core platform monitoring. You can use a similar method to access the prometheus-k8s service for core platform Prometheus and the thanos-ruler service for Thanos Ruler.
Prerequisites
-
You are logged in to an account that is bound against the
monitoring-alertmanager-editrole in theopenshift-monitoringnamespace. You are logged in to an account that has permission to get the Alertmanager API route.
NoteIf your account does not have permission to get the Alertmanager API route, a cluster administrator can provide the URL for the route.
Procedure
Extract an authentication token by running the following command:
$ TOKEN=$(oc whoami -t)
Extract the
alertmanager-mainAPI route URL by running the following command:$ HOST=$(oc -n openshift-monitoring get route alertmanager-main -ojsonpath={.spec.host})Query the service API receivers for Alertmanager by running the following command:
$ curl -H "Authorization: Bearer $TOKEN" -k "https://$HOST/api/v2/receivers"
12.3. Querying metrics by using the federation endpoint for Prometheus
You can use the federation endpoint for Prometheus to scrape platform and user-defined metrics from a network location outside the cluster. To do so, access the Prometheus /federate endpoint for the cluster via an Red Hat OpenShift Service on AWS route.
A delay in retrieving metrics data occurs when you use federation. This delay can affect the accuracy and timeliness of the scraped metrics.
Using the federation endpoint can also degrade the performance and scalability of your cluster, especially if you use the federation endpoint to retrieve large amounts of metrics data. To avoid these issues, follow these recommendations:
- Do not try to retrieve all metrics data via the federation endpoint for Prometheus. Query it only when you want to retrieve a limited, aggregated data set. For example, retrieving fewer than 1,000 samples for each request helps minimize the risk of performance degradation.
- Avoid frequent querying of the federation endpoint for Prometheus. Limit queries to a maximum of one every 30 seconds.
If you need to forward large amounts of data outside the cluster, use remote write instead. For more information, see the Configuring remote write storage section.
Prerequisites
-
You have installed the OpenShift CLI (
oc). You have access to the cluster as a user with the
cluster-monitoring-viewcluster role or have obtained a bearer token withgetpermission on thenamespacesresource.NoteYou can only use bearer token authentication to access the Prometheus federation endpoint.
You are logged in to an account that has permission to get the Prometheus federation route.
NoteIf your account does not have permission to get the Prometheus federation route, a cluster administrator can provide the URL for the route.
Procedure
Retrieve the bearer token by running the following the command:
$ TOKEN=$(oc whoami -t)
Get the Prometheus federation route URL by running the following command:
$ HOST=$(oc -n openshift-monitoring get route prometheus-k8s-federate -ojsonpath={.spec.host})Query metrics from the
/federateroute. The following example command queriesupmetrics:$ curl -G -k -H "Authorization: Bearer $TOKEN" https://$HOST/federate --data-urlencode 'match[]=up'
Example output
# TYPE up untyped
up{apiserver="kube-apiserver",endpoint="https",instance="10.0.143.148:6443",job="apiserver",namespace="default",service="kubernetes",prometheus="openshift-monitoring/k8s",prometheus_replica="prometheus-k8s-0"} 1 1657035322214
up{apiserver="kube-apiserver",endpoint="https",instance="10.0.148.166:6443",job="apiserver",namespace="default",service="kubernetes",prometheus="openshift-monitoring/k8s",prometheus_replica="prometheus-k8s-0"} 1 1657035338597
up{apiserver="kube-apiserver",endpoint="https",instance="10.0.173.16:6443",job="apiserver",namespace="default",service="kubernetes",prometheus="openshift-monitoring/k8s",prometheus_replica="prometheus-k8s-0"} 1 1657035343834
...
12.4. Accessing metrics from outside the cluster for custom applications
You can query Prometheus metrics from outside the cluster when monitoring your own services with user-defined projects. Access this data from outside the cluster by using the thanos-querier route.
This access only supports using a Bearer Token for authentication.
Prerequisites
- You have deployed your own service, following the "Enabling monitoring for user-defined projects" procedure.
-
You are logged in to an account with the
cluster-monitoring-viewcluster role, which provides permission to access the Thanos Querier API. You are logged in to an account that has permission to get the Thanos Querier API route.
NoteIf your account does not have permission to get the Thanos Querier API route, a cluster administrator can provide the URL for the route.
Procedure
Extract an authentication token to connect to Prometheus by running the following command:
$ TOKEN=$(oc whoami -t)
Extract the
thanos-querierAPI route URL by running the following command:$ HOST=$(oc -n openshift-monitoring get route thanos-querier -ojsonpath={.spec.host})Set the namespace to the namespace in which your service is running by using the following command:
$ NAMESPACE=ns1
Query the metrics of your own services in the command line by running the following command:
$ curl -H "Authorization: Bearer $TOKEN" -k "https://$HOST/api/v1/query?" --data-urlencode "query=up{namespace='$NAMESPACE'}"The output shows the status for each application pod that Prometheus is scraping:
Example output
{"status":"success","data":{"resultType":"vector","result":[{"metric":{"__name__":"up","endpoint":"web","instance":"10.129.0.46:8080","job":"prometheus-example-app","namespace":"ns1","pod":"prometheus-example-app-68d47c4fb6-jztp2","service":"prometheus-example-app"},"value":[1591881154.748,"1"]}]}}
12.5. Additional resources
Chapter 13. Troubleshooting monitoring issues
Find troubleshooting steps for common issues with user-defined project monitoring.
13.1. Determining why user-defined project metrics are unavailable
If metrics are not displaying when monitoring user-defined projects, follow these steps to troubleshoot the issue.
Procedure
Query the metric name and verify that the project is correct:
- From the Developer perspective in the web console, select Observe → Metrics.
- Select the project that you want to view metrics for in the Project: list.
Choose a query from the Select query list, or run a custom PromQL query by selecting Show PromQL.
The metrics are displayed in a chart.
Queries must be done on a per-project basis. The metrics that are shown relate to the project that you have selected.
Verify that the pod that you want metrics from is actively serving metrics. Run the following
oc execcommand into a pod to target thepodIP,port, and/metrics.$ oc exec <sample_pod> -n <sample_namespace> -- curl <target_pod_IP>:<port>/metrics
NoteYou must run the command on a pod that has
curlinstalled.The following example output shows a result with a valid version metric.
Example output
  % Total    % Received % Xferd  Average Speed   Time    Time     Time  Current
                                 Dload  Upload   Total   Spent    Left  Speed
# HELP version Version information about this binary-- --:--:-- --:--:--     0
# TYPE version gauge
version{version="v0.1.0"} 1
100   102  100   102    0     0  51000      0 --:--:-- --:--:-- --:--:-- 51000
An invalid output indicates that there is a problem with the corresponding application.
-
If you are using a
PodMonitorCRD, verify that thePodMonitorCRD is configured to point to the correct pods using label matching. For more information, see the Prometheus Operator documentation. If you are using a
ServiceMonitorCRD, and if the/metricsendpoint of the pod is showing metric data, follow these steps to verify the configuration:Verify that the service is pointed to the correct
/metricsendpoint. The servicelabelsin this output must match the services monitorlabelsand the/metricsendpoint defined by the service in the subsequent steps.$ oc get service
Example output
apiVersion: v1
kind: Service 1
metadata:
  labels: 2
    app: prometheus-example-app
  name: prometheus-example-app
  namespace: ns1
spec:
  ports:
  - port: 8080
    protocol: TCP
    targetPort: 8080
    name: web
  selector:
    app: prometheus-example-app
  type: ClusterIP
Query the
serviceIP,port, and/metricsendpoints to see if the same metrics from thecurlcommand you ran on the pod previously:Run the following command to find the service IP:
$ oc get service -n <target_namespace>
Query the
/metricsendpoint:$ oc exec <sample_pod> -n <sample_namespace> -- curl <service_IP>:<port>/metrics
Valid metrics are returned in the following example.
Example output
% Total    % Received % Xferd  Average Speed   Time    Time     Time  Current
                               Dload  Upload   Total   Spent    Left  Speed
100   102  100   102    0     0  51000      0 --:--:-- --:--:-- --:--:--   99k
# HELP version Version information about this binary
# TYPE version gauge
version{version="v0.1.0"} 1
Use label matching to verify that the
ServiceMonitorobject is configured to point to the desired service. To do this, compare theServiceobject from theoc get serviceoutput to theServiceMonitorobject from theoc get servicemonitoroutput. The labels must match for the metrics to be displayed.For example, from the previous steps, notice how the
Serviceobject has theapp: prometheus-example-applabel and theServiceMonitorobject has the sameapp: prometheus-example-appmatch label.
- If everything looks valid and the metrics are still unavailable, please contact the support team for further help.
13.2. Determining why Prometheus is consuming a lot of disk space
Developers can create labels to define attributes for metrics in the form of key-value pairs. The number of potential key-value pairs corresponds to the number of possible values for an attribute. An attribute that has an unlimited number of potential values is called an unbound attribute. For example, a customer_id attribute is unbound because it has an infinite number of possible values.
Every assigned key-value pair has a unique time series. The use of many unbound attributes in labels can result in an exponential increase in the number of time series created. This can impact Prometheus performance and can consume a lot of disk space.
You can use the following measures when Prometheus consumes a lot of disk:
- Check the time series database (TSDB) status using the Prometheus HTTP API for more information about which labels are creating the most time series data. Doing so requires cluster administrator privileges.
- Check the number of scrape samples that are being collected.
Reduce the number of unique time series that are created by reducing the number of unbound attributes that are assigned to user-defined metrics.
NoteUsing attributes that are bound to a limited set of possible values reduces the number of potential key-value pair combinations.
- Enforce limits on the number of samples that can be scraped across user-defined projects. This requires cluster administrator privileges.
Prerequisites
-
You have access to the cluster as a user with the
dedicated-adminrole. -
You have installed the OpenShift CLI (
oc).
Procedure
- In the Administrator perspective, navigate to Observe → Metrics.
Enter a Prometheus Query Language (PromQL) query in the Expression field. The following example queries help to identify high cardinality metrics that might result in high disk space consumption:
By running the following query, you can identify the ten jobs that have the highest number of scrape samples:
topk(10, max by(namespace, job) (topk by(namespace, job) (1, scrape_samples_post_metric_relabeling)))
By running the following query, you can pinpoint time series churn by identifying the ten jobs that have created the most time series data in the last hour:
topk(10, sum by(namespace, job) (sum_over_time(scrape_series_added[1h])))
Investigate the number of unbound label values assigned to metrics with higher than expected scrape sample counts:
- If the metrics relate to a user-defined project, review the metrics key-value pairs assigned to your workload. These are implemented through Prometheus client libraries at the application level. Try to limit the number of unbound attributes referenced in your labels.
- If the metrics relate to a core Red Hat OpenShift Service on AWS project, create a Red Hat support case on the Red Hat Customer Portal.
Review the TSDB status using the Prometheus HTTP API by following these steps when logged in as a
dedicated-admin:Get the Prometheus API route URL by running the following command:
$ HOST=$(oc -n openshift-monitoring get route prometheus-k8s -ojsonpath={.spec.host})Extract an authentication token by running the following command:
$ TOKEN=$(oc whoami -t)
Query the TSDB status for Prometheus by running the following command:
$ curl -H "Authorization: Bearer $TOKEN" -k "https://$HOST/api/v1/status/tsdb"
Example output
"status": "success","data":{"headStats":{"numSeries":507473,
"numLabelPairs":19832,"chunkCount":946298,"minTime":1712253600010,
"maxTime":1712257935346},"seriesCountByMetricName":
[{"name":"etcd_request_duration_seconds_bucket","value":51840},
{"name":"apiserver_request_sli_duration_seconds_bucket","value":47718},
...
Chapter 14. Config map reference for the Cluster Monitoring Operator
14.1. Cluster Monitoring Operator configuration reference
Parts of Red Hat OpenShift Service on AWS cluster monitoring are configurable. The API is accessible by setting parameters defined in various config maps.
-
To configure monitoring components, edit the
ConfigMapobject namedcluster-monitoring-configin theopenshift-monitoringnamespace. These configurations are defined by ClusterMonitoringConfiguration. -
To configure monitoring components that monitor user-defined projects, edit the
ConfigMapobject nameduser-workload-monitoring-configin theopenshift-user-workload-monitoringnamespace. These configurations are defined by UserWorkloadConfiguration.
The configuration file is always defined under the config.yaml key in the config map data.
- Not all configuration parameters for the monitoring stack are exposed. Only the parameters and fields listed in this reference are supported for configuration. For more information about supported configurations, see Maintenance and support for monitoring.
- Configuring cluster monitoring is optional.
- If a configuration does not exist or is empty, default values are used.
-
If the configuration is invalid YAML data, the Cluster Monitoring Operator stops reconciling the resources and reports
Degraded=Truein the status conditions of the Operator.
14.2. AdditionalAlertmanagerConfig
14.2.1. Description
The AdditionalAlertmanagerConfig resource defines settings for how a component communicates with additional Alertmanager instances.
14.2.2. Required
-
apiVersion
Appears in: PrometheusK8sConfig, PrometheusRestrictedConfig, ThanosRulerConfig
| Property | Type | Description |
|---|---|---|
| apiVersion | string |
Defines the API version of Alertmanager. Possible values are |
| bearerToken | *v1.SecretKeySelector | Defines the secret key reference containing the bearer token to use when authenticating to Alertmanager. |
| pathPrefix | string | Defines the path prefix to add in front of the push endpoint path. |
| scheme | string |
Defines the URL scheme to use when communicating with Alertmanager instances. Possible values are |
| staticConfigs | []string |
A list of statically configured Alertmanager endpoints in the form of |
| timeout | *string | Defines the timeout value used when sending alerts. |
| tlsConfig | Defines the TLS settings to use for Alertmanager connections. |
14.3. AlertmanagerMainConfig
14.3.1. Description
The AlertmanagerMainConfig resource defines settings for the Alertmanager component in the openshift-monitoring namespace.
Appears in: ClusterMonitoringConfiguration
| Property | Type | Description |
|---|---|---|
| enabled | *bool |
A Boolean flag that enables or disables the main Alertmanager instance in the |
| enableUserAlertmanagerConfig | bool |
A Boolean flag that enables or disables user-defined namespaces to be selected for |
| logLevel | string |
Defines the log level setting for Alertmanager. The possible values are: |
| nodeSelector | map[string]string | Defines the nodes on which the Pods are scheduled. |
| resources | *v1.ResourceRequirements | Defines resource requests and limits for the Alertmanager container. |
| secrets | []string |
Defines a list of secrets to be mounted into Alertmanager. The secrets must reside within the same namespace as the Alertmanager object. They are added as volumes named |
| tolerations | []v1.Toleration | Defines tolerations for the pods. |
| topologySpreadConstraints | []v1.TopologySpreadConstraint | Defines a pod’s topology spread constraints. |
| volumeClaimTemplate | *monv1.EmbeddedPersistentVolumeClaim | Defines persistent storage for Alertmanager. Use this setting to configure the persistent volume claim, including storage class, volume size, and name. |
14.4. AlertmanagerUserWorkloadConfig
14.4.1. Description
The AlertmanagerUserWorkloadConfig resource defines the settings for the Alertmanager instance used for user-defined projects.
Appears in: UserWorkloadConfiguration
| Property | Type | Description |
|---|---|---|
| enabled | bool |
A Boolean flag that enables or disables a dedicated instance of Alertmanager for user-defined alerts in the |
| enableAlertmanagerConfig | bool |
A Boolean flag to enable or disable user-defined namespaces to be selected for |
| logLevel | string |
Defines the log level setting for Alertmanager for user workload monitoring. The possible values are |
| resources | *v1.ResourceRequirements | Defines resource requests and limits for the Alertmanager container. |
| secrets | []string |
Defines a list of secrets to be mounted into Alertmanager. The secrets must be located within the same namespace as the Alertmanager object. They are added as volumes named |
| nodeSelector | map[string]string | Defines the nodes on which the pods are scheduled. |
| tolerations | []v1.Toleration | Defines tolerations for the pods. |
| topologySpreadConstraints | []v1.TopologySpreadConstraint | Defines a pod’s topology spread constraints. |
| volumeClaimTemplate | *monv1.EmbeddedPersistentVolumeClaim | Defines persistent storage for Alertmanager. Use this setting to configure the persistent volume claim, including storage class, volume size and name. |
14.5. ClusterMonitoringConfiguration
14.5.1. Description
The ClusterMonitoringConfiguration resource defines settings that customize the default platform monitoring stack through the cluster-monitoring-config config map in the openshift-monitoring namespace.
| Property | Type | Description |
|---|---|---|
| alertmanagerMain |
| |
| enableUserWorkload | *bool |
|
| k8sPrometheusAdapter |
| |
| kubeStateMetrics |
| |
| metricsServer |
| |
| prometheusK8s |
| |
| prometheusOperator |
| |
| prometheusOperatorAdmissionWebhook |
| |
| openshiftStateMetrics |
| |
| telemeterClient |
| |
| thanosQuerier |
| |
| nodeExporter |
| |
| monitoringPlugin |
|
14.6. DedicatedServiceMonitors
14.6.1. Description
This setting is deprecated and is planned to be removed in a future Red Hat OpenShift Service on AWS version. In the current version, this setting still exists but has no effect.
You can use the DedicatedServiceMonitors resource to configure dedicated Service Monitors for the Prometheus Adapter
Appears in: K8sPrometheusAdapter
| Property | Type | Description |
|---|---|---|
| enabled | bool |
When |
14.7. K8sPrometheusAdapter
14.7.1. Description
The K8sPrometheusAdapter resource defines settings for the Prometheus Adapter component.
Appears in: ClusterMonitoringConfiguration
| Property | Type | Description |
|---|---|---|
| audit | *Audit |
Defines the audit configuration used by the Prometheus Adapter instance. Possible profile values are: |
| nodeSelector | map[string]string | Defines the nodes on which the pods are scheduled. |
| resources | *v1.ResourceRequirements |
Defines resource requests and limits for the |
| tolerations | []v1.Toleration | Defines tolerations for the pods. |
| topologySpreadConstraints | []v1.TopologySpreadConstraint | Defines a pod’s topology spread constraints. |
| dedicatedServiceMonitors | Defines dedicated service monitors. |
14.8. KubeStateMetricsConfig
14.8.1. Description
The KubeStateMetricsConfig resource defines settings for the kube-state-metrics agent.
Appears in: ClusterMonitoringConfiguration
| Property | Type | Description |
|---|---|---|
| nodeSelector | map[string]string | Defines the nodes on which the pods are scheduled. |
| resources | *v1.ResourceRequirements |
Defines resource requests and limits for the |
| tolerations | []v1.Toleration | Defines tolerations for the pods. |
| topologySpreadConstraints | []v1.TopologySpreadConstraint | Defines a pod’s topology spread constraints. |
14.9. MetricsServerConfig
14.9.1. Description
Metrics Server is a Technology Preview feature only. Technology Preview features are not supported with Red Hat production service level agreements (SLAs) and might not be functionally complete. Red Hat does not recommend using them in production. These features provide early access to upcoming product features, enabling customers to test functionality and provide feedback during the development process.
For more information about the support scope of Red Hat Technology Preview features, see Technology Preview Features Support Scope.
The MetricsServerConfig resource defines settings for the Metrics Server component. Note that this setting only applies when the TechPreviewNoUpgrade feature gate is enabled.
Appears in: ClusterMonitoringConfiguration
| Property | Type | Description |
|---|---|---|
| nodeSelector | map[string]string | Defines the nodes on which the pods are scheduled. |
| tolerations | []v1.Toleration | Defines tolerations for the pods. |
| resources | *v1.ResourceRequirements | Defines resource requests and limits for the Metrics Server container. |
| topologySpreadConstraints | []v1.TopologySpreadConstraint | Defines a pod’s topology spread constraints. |
14.10. PrometheusOperatorAdmissionWebhookConfig
14.10.1. Description
The PrometheusOperatorAdmissionWebhookConfig resource defines settings for the admission webhook workload for Prometheus Operator.
Appears in: ClusterMonitoringConfiguration
| Property | Type | Description |
|---|---|---|
| resources | *v1.ResourceRequirements |
Defines resource requests and limits for the |
| topologySpreadConstraints | []v1.TopologySpreadConstraint | Defines a pod’s topology spread constraints. |
14.11. MonitoringPluginConfig
14.11.1. Description
The MonitoringPluginConfig resource defines settings for the web console plugin component in the openshift-monitoring namespace.
Appears in: ClusterMonitoringConfiguration
| Property | Type | Description |
|---|---|---|
| nodeSelector | map[string]string | Defines the nodes on which the pods are scheduled. |
| resources | *v1.ResourceRequirements |
Defines resource requests and limits for the |
| tolerations | []v1.Toleration | Defines tolerations for the pods. |
| topologySpreadConstraints | []v1.TopologySpreadConstraint | Defines a pod’s topology spread constraints. |
14.12. NodeExporterCollectorBuddyInfoConfig
14.12.1. Description
The NodeExporterCollectorBuddyInfoConfig resource works as an on/off switch for the buddyinfo collector of the node-exporter agent. By default, the buddyinfo collector is disabled.
Appears in: NodeExporterCollectorConfig
| Property | Type | Description |
|---|---|---|
| enabled | bool |
A Boolean flag that enables or disables the |
14.13. NodeExporterCollectorConfig
14.13.1. Description
The NodeExporterCollectorConfig resource defines settings for individual collectors of the node-exporter agent.
Appears in: NodeExporterConfig
| Property | Type | Description |
|---|---|---|
| cpufreq |
Defines the configuration of the | |
| tcpstat |
Defines the configuration of the | |
| netdev |
Defines the configuration of the | |
| netclass |
Defines the configuration of the | |
| buddyinfo |
Defines the configuration of the | |
| mountstats |
Defines the configuration of the | |
| ksmd |
Defines the configuration of the | |
| processes |
Defines the configuration of the | |
| systemd |
Defines the configuration of the |
14.14. NodeExporterCollectorCpufreqConfig
14.14.1. Description
Use the NodeExporterCollectorCpufreqConfig resource to enable or disable the cpufreq collector of the node-exporter agent. By default, the cpufreq collector is disabled. Under certain circumstances, enabling the cpufreq collector increases CPU usage on machines with many cores. If you enable this collector and have machines with many cores, monitor your systems closely for excessive CPU usage.
Appears in: NodeExporterCollectorConfig
| Property | Type | Description |
|---|---|---|
| enabled | bool |
A Boolean flag that enables or disables the |
14.15. NodeExporterCollectorKSMDConfig
14.15.1. Description
Use the NodeExporterCollectorKSMDConfig resource to enable or disable the ksmd collector of the node-exporter agent. By default, the ksmd collector is disabled.
Appears in: NodeExporterCollectorConfig
| Property | Type | Description |
|---|---|---|
| enabled | bool |
A Boolean flag that enables or disables the |
14.16. NodeExporterCollectorMountStatsConfig
14.16.1. Description
Use the NodeExporterCollectorMountStatsConfig resource to enable or disable the mountstats collector of the node-exporter agent. By default, the mountstats collector is disabled. If you enable the collector, the following metrics become available: node_mountstats_nfs_read_bytes_total, node_mountstats_nfs_write_bytes_total, and node_mountstats_nfs_operations_requests_total. Be aware that these metrics can have a high cardinality. If you enable this collector, closely monitor any increases in memory usage for the prometheus-k8s pods.
Appears in: NodeExporterCollectorConfig
| Property | Type | Description |
|---|---|---|
| enabled | bool |
A Boolean flag that enables or disables the |
14.17. NodeExporterCollectorNetClassConfig
14.17.1. Description
Use the NodeExporterCollectorNetClassConfig resource to enable or disable the netclass collector of the node-exporter agent. By default, the netclass collector is enabled. If you disable this collector, these metrics become unavailable: node_network_info, node_network_address_assign_type, node_network_carrier, node_network_carrier_changes_total, node_network_carrier_up_changes_total, node_network_carrier_down_changes_total, node_network_device_id, node_network_dormant, node_network_flags, node_network_iface_id, node_network_iface_link, node_network_iface_link_mode, node_network_mtu_bytes, node_network_name_assign_type, node_network_net_dev_group, node_network_speed_bytes, node_network_transmit_queue_length, and node_network_protocol_type.
Appears in: NodeExporterCollectorConfig
| Property | Type | Description |
|---|---|---|
| enabled | bool |
A Boolean flag that enables or disables the |
| useNetlink | bool |
A Boolean flag that activates the |
14.18. NodeExporterCollectorNetDevConfig
14.18.1. Description
Use the NodeExporterCollectorNetDevConfig resource to enable or disable the netdev collector of the node-exporter agent. By default, the netdev collector is enabled. If disabled, these metrics become unavailable: node_network_receive_bytes_total, node_network_receive_compressed_total, node_network_receive_drop_total, node_network_receive_errs_total, node_network_receive_fifo_total, node_network_receive_frame_total, node_network_receive_multicast_total, node_network_receive_nohandler_total, node_network_receive_packets_total, node_network_transmit_bytes_total, node_network_transmit_carrier_total, node_network_transmit_colls_total, node_network_transmit_compressed_total, node_network_transmit_drop_total, node_network_transmit_errs_total, node_network_transmit_fifo_total, and node_network_transmit_packets_total.
Appears in: NodeExporterCollectorConfig
| Property | Type | Description |
|---|---|---|
| enabled | bool |
A Boolean flag that enables or disables the |
14.19. NodeExporterCollectorProcessesConfig
14.19.1. Description
Use the NodeExporterCollectorProcessesConfig resource to enable or disable the processes collector of the node-exporter agent. If the collector is enabled, the following metrics become available: node_processes_max_processes, node_processes_pids, node_processes_state, node_processes_threads, node_processes_threads_state. The metric node_processes_state and node_processes_threads_state can have up to five series each, depending on the state of the processes and threads. The possible states of a process or a thread are: D (UNINTERRUPTABLE_SLEEP), R (RUNNING & RUNNABLE), S (INTERRUPTABLE_SLEEP), T (STOPPED), or Z (ZOMBIE). By default, the processes collector is disabled.
Appears in: NodeExporterCollectorConfig
| Property | Type | Description |
|---|---|---|
| enabled | bool |
A Boolean flag that enables or disables the |
14.20. NodeExporterCollectorSystemdConfig
14.20.1. Description
Use the NodeExporterCollectorSystemdConfig resource to enable or disable the systemd collector of the node-exporter agent. By default, the systemd collector is disabled. If enabled, the following metrics become available: node_systemd_system_running, node_systemd_units, node_systemd_version. If the unit uses a socket, it also generates the following metrics: node_systemd_socket_accepted_connections_total, node_systemd_socket_current_connections, node_systemd_socket_refused_connections_total. You can use the units parameter to select the systemd units to be included by the systemd collector. The selected units are used to generate the node_systemd_unit_state metric, which shows the state of each systemd unit. However, this metric’s cardinality might be high (at least five series per unit per node). If you enable this collector with a long list of selected units, closely monitor the prometheus-k8s deployment for excessive memory usage. Note that the node_systemd_timer_last_trigger_seconds metric is only shown if you have configured the value of the units parameter as logrotate.timer.
Appears in: NodeExporterCollectorConfig
| Property | Type | Description |
|---|---|---|
| enabled | bool |
A Boolean flag that enables or disables the |
| units | []string |
A list of regular expression (regex) patterns that match systemd units to be included by the |
14.21. NodeExporterCollectorTcpStatConfig
14.21.1. Description
The NodeExporterCollectorTcpStatConfig resource works as an on/off switch for the tcpstat collector of the node-exporter agent. By default, the tcpstat collector is disabled.
Appears in: NodeExporterCollectorConfig
| Property | Type | Description |
|---|---|---|
| enabled | bool |
A Boolean flag that enables or disables the |
14.22. NodeExporterConfig
14.22.1. Description
The NodeExporterConfig resource defines settings for the node-exporter agent.
Appears in: ClusterMonitoringConfiguration
| Property | Type | Description |
|---|---|---|
| collectors | Defines which collectors are enabled and their additional configuration parameters. | |
| maxProcs | uint32 |
The target number of CPUs on which the node-exporter’s process will run. The default value is |
| ignoredNetworkDevices | *[]string |
A list of network devices, defined as regular expressions, that you want to exclude from the relevant collector configuration such as |
| resources | *v1.ResourceRequirements |
Defines resource requests and limits for the |
14.23. OpenShiftStateMetricsConfig
14.23.1. Description
The OpenShiftStateMetricsConfig resource defines settings for the openshift-state-metrics agent.
Appears in: ClusterMonitoringConfiguration
| Property | Type | Description |
|---|---|---|
| nodeSelector | map[string]string | Defines the nodes on which the pods are scheduled. |
| resources | *v1.ResourceRequirements |
Defines resource requests and limits for the |
| tolerations | []v1.Toleration | Defines tolerations for the pods. |
| topologySpreadConstraints | []v1.TopologySpreadConstraint | Defines the pod’s topology spread constraints. |
14.24. PrometheusK8sConfig
14.24.1. Description
The PrometheusK8sConfig resource defines settings for the Prometheus component.
Appears in: ClusterMonitoringConfiguration
| Property | Type | Description |
|---|---|---|
| additionalAlertmanagerConfigs | Configures additional Alertmanager instances that receive alerts from the Prometheus component. By default, no additional Alertmanager instances are configured. | |
| enforcedBodySizeLimit | string |
Enforces a body size limit for Prometheus scraped metrics. If a scraped target’s body response is larger than the limit, the scrape will fail. The following values are valid: an empty value to specify no limit, a numeric value in Prometheus size format (such as |
| externalLabels | map[string]string | Defines labels to be added to any time series or alerts when communicating with external systems such as federation, remote storage, and Alertmanager. By default, no labels are added. |
| logLevel | string |
Defines the log level setting for Prometheus. The possible values are: |
| nodeSelector | map[string]string | Defines the nodes on which the pods are scheduled. |
| queryLogFile | string |
Specifies the file to which PromQL queries are logged. This setting can be either a filename, in which case the queries are saved to an |
| remoteWrite | Defines the remote write configuration, including URL, authentication, and relabeling settings. | |
| resources | *v1.ResourceRequirements |
Defines resource requests and limits for the |
| retention | string |
Defines the duration for which Prometheus retains data. This definition must be specified using the following regular expression pattern: |
| retentionSize | string |
Defines the maximum amount of disk space used by data blocks plus the write-ahead log (WAL). Supported values are |
| tolerations | []v1.Toleration | Defines tolerations for the pods. |
| topologySpreadConstraints | []v1.TopologySpreadConstraint | Defines the pod’s topology spread constraints. |
| collectionProfile | CollectionProfile |
Defines the metrics collection profile that Prometheus uses to collect metrics from the platform components. Supported values are |
| volumeClaimTemplate | *monv1.EmbeddedPersistentVolumeClaim | Defines persistent storage for Prometheus. Use this setting to configure the persistent volume claim, including storage class, volume size and name. |
14.25. PrometheusOperatorConfig
14.25.1. Description
The PrometheusOperatorConfig resource defines settings for the Prometheus Operator component.
Appears in: ClusterMonitoringConfiguration, UserWorkloadConfiguration
| Property | Type | Description |
|---|---|---|
| logLevel | string |
Defines the log level settings for Prometheus Operator. The possible values are |
| nodeSelector | map[string]string | Defines the nodes on which the pods are scheduled. |
| resources | *v1.ResourceRequirements |
Defines resource requests and limits for the |
| tolerations | []v1.Toleration | Defines tolerations for the pods. |
| topologySpreadConstraints | []v1.TopologySpreadConstraint | Defines the pod’s topology spread constraints. |
14.26. PrometheusRestrictedConfig
14.26.1. Description
The PrometheusRestrictedConfig resource defines the settings for the Prometheus component that monitors user-defined projects.
Appears in: UserWorkloadConfiguration
| Property | Type | Description |
|---|---|---|
| additionalAlertmanagerConfigs | Configures additional Alertmanager instances that receive alerts from the Prometheus component. By default, no additional Alertmanager instances are configured. | |
| enforcedLabelLimit | *uint64 |
Specifies a per-scrape limit on the number of labels accepted for a sample. If the number of labels exceeds this limit after metric relabeling, the entire scrape is treated as failed. The default value is |
| enforcedLabelNameLengthLimit | *uint64 |
Specifies a per-scrape limit on the length of a label name for a sample. If the length of a label name exceeds this limit after metric relabeling, the entire scrape is treated as failed. The default value is |
| enforcedLabelValueLengthLimit | *uint64 |
Specifies a per-scrape limit on the length of a label value for a sample. If the length of a label value exceeds this limit after metric relabeling, the entire scrape is treated as failed. The default value is |
| enforcedSampleLimit | *uint64 |
Specifies a global limit on the number of scraped samples that will be accepted. This setting overrides the |
| enforcedTargetLimit | *uint64 |
Specifies a global limit on the number of scraped targets. This setting overrides the |
| externalLabels | map[string]string | Defines labels to be added to any time series or alerts when communicating with external systems such as federation, remote storage, and Alertmanager. By default, no labels are added. |
| logLevel | string |
Defines the log level setting for Prometheus. The possible values are |
| nodeSelector | map[string]string | Defines the nodes on which the pods are scheduled. |
| queryLogFile | string |
Specifies the file to which PromQL queries are logged. This setting can be either a filename, in which case the queries are saved to an |
| remoteWrite | Defines the remote write configuration, including URL, authentication, and relabeling settings. | |
| resources | *v1.ResourceRequirements | Defines resource requests and limits for the Prometheus container. |
| retention | string |
Defines the duration for which Prometheus retains data. This definition must be specified using the following regular expression pattern: |
| retentionSize | string |
Defines the maximum amount of disk space used by data blocks plus the write-ahead log (WAL). Supported values are |
| tolerations | []v1.Toleration | Defines tolerations for the pods. |
| topologySpreadConstraints | []v1.TopologySpreadConstraint | Defines the pod’s topology spread constraints. |
| volumeClaimTemplate | *monv1.EmbeddedPersistentVolumeClaim | Defines persistent storage for Prometheus. Use this setting to configure the storage class and size of a volume. |
14.27. RemoteWriteSpec
14.27.1. Description
The RemoteWriteSpec resource defines the settings for remote write storage.
14.27.2. Required
-
url
Appears in: PrometheusK8sConfig, PrometheusRestrictedConfig
| Property | Type | Description |
|---|---|---|
| authorization | *monv1.SafeAuthorization | Defines the authorization settings for remote write storage. |
| basicAuth | *monv1.BasicAuth | Defines Basic authentication settings for the remote write endpoint URL. |
| bearerTokenFile | string | Defines the file that contains the bearer token for the remote write endpoint. However, because you cannot mount secrets in a pod, in practice you can only reference the token of the service account. |
| headers | map[string]string | Specifies the custom HTTP headers to be sent along with each remote write request. Headers set by Prometheus cannot be overwritten. |
| metadataConfig | *monv1.MetadataConfig | Defines settings for sending series metadata to remote write storage. |
| name | string | Defines the name of the remote write queue. This name is used in metrics and logging to differentiate queues. If specified, this name must be unique. |
| oauth2 | *monv1.OAuth2 | Defines OAuth2 authentication settings for the remote write endpoint. |
| proxyUrl | string | Defines an optional proxy URL. |
| queueConfig | *monv1.QueueConfig | Allows tuning configuration for remote write queue parameters. |
| remoteTimeout | string | Defines the timeout value for requests to the remote write endpoint. |
| sendExemplars | *bool | Enables sending exemplars via remote write. When enabled, this setting configures Prometheus to store a maximum of 100,000 exemplars in memory. This setting only applies to user-defined monitoring and is not applicable to core platform monitoring. |
| sigv4 | *monv1.Sigv4 | Defines AWS Signature Version 4 authentication settings. |
| tlsConfig | *monv1.SafeTLSConfig | Defines TLS authentication settings for the remote write endpoint. |
| url | string | Defines the URL of the remote write endpoint to which samples will be sent. |
| writeRelabelConfigs | []monv1.RelabelConfig | Defines the list of remote write relabel configurations. |
14.28. TLSConfig
14.28.1. Description
The TLSConfig resource configures the settings for TLS connections.
14.28.2. Required
-
insecureSkipVerify
Appears in: AdditionalAlertmanagerConfig
| Property | Type | Description |
|---|---|---|
| ca | *v1.SecretKeySelector | Defines the secret key reference containing the Certificate Authority (CA) to use for the remote host. |
| cert | *v1.SecretKeySelector | Defines the secret key reference containing the public certificate to use for the remote host. |
| key | *v1.SecretKeySelector | Defines the secret key reference containing the private key to use for the remote host. |
| serverName | string | Used to verify the hostname on the returned certificate. |
| insecureSkipVerify | bool |
When set to |
14.29. TelemeterClientConfig
14.29.1. Description
TelemeterClientConfig defines settings for the Telemeter Client component.
14.29.2. Required
-
nodeSelector -
tolerations
Appears in: ClusterMonitoringConfiguration
| Property | Type | Description |
|---|---|---|
| nodeSelector | map[string]string | Defines the nodes on which the pods are scheduled. |
| resources | *v1.ResourceRequirements |
Defines resource requests and limits for the |
| tolerations | []v1.Toleration | Defines tolerations for the pods. |
| topologySpreadConstraints | []v1.TopologySpreadConstraint | Defines the pod’s topology spread constraints. |
14.30. ThanosQuerierConfig
14.30.1. Description
The ThanosQuerierConfig resource defines settings for the Thanos Querier component.
Appears in: ClusterMonitoringConfiguration
| Property | Type | Description |
|---|---|---|
| enableRequestLogging | bool |
A Boolean flag that enables or disables request logging. The default value is |
| logLevel | string |
Defines the log level setting for Thanos Querier. The possible values are |
| enableCORS | bool |
A Boolean flag that enables setting CORS headers. The headers allow access from any origin. The default value is |
| nodeSelector | map[string]string | Defines the nodes on which the pods are scheduled. |
| resources | *v1.ResourceRequirements | Defines resource requests and limits for the Thanos Querier container. |
| tolerations | []v1.Toleration | Defines tolerations for the pods. |
| topologySpreadConstraints | []v1.TopologySpreadConstraint | Defines the pod’s topology spread constraints. |
14.31. ThanosRulerConfig
14.31.1. Description
The ThanosRulerConfig resource defines configuration for the Thanos Ruler instance for user-defined projects.
Appears in: UserWorkloadConfiguration
| Property | Type | Description |
|---|---|---|
| additionalAlertmanagerConfigs |
Configures how the Thanos Ruler component communicates with additional Alertmanager instances. The default value is | |
| logLevel | string |
Defines the log level setting for Thanos Ruler. The possible values are |
| nodeSelector | map[string]string | Defines the nodes on which the Pods are scheduled. |
| resources | *v1.ResourceRequirements | Defines resource requests and limits for the Alertmanager container. |
| retention | string |
Defines the duration for which Prometheus retains data. This definition must be specified using the following regular expression pattern: |
| tolerations | []v1.Toleration | Defines tolerations for the pods. |
| topologySpreadConstraints | []v1.TopologySpreadConstraint | Defines the pod’s topology spread constraints. |
| volumeClaimTemplate | *monv1.EmbeddedPersistentVolumeClaim | Defines persistent storage for Thanos Ruler. Use this setting to configure the storage class and size of a volume. |
14.32. UserWorkloadConfiguration
14.32.1. Description
The UserWorkloadConfiguration resource defines the settings responsible for user-defined projects in the user-workload-monitoring-config config map in the openshift-user-workload-monitoring namespace. You can only enable UserWorkloadConfiguration after you have set enableUserWorkload to true in the cluster-monitoring-config config map under the openshift-monitoring namespace.
| Property | Type | Description |
|---|---|---|
| alertmanager | Defines the settings for the Alertmanager component in user workload monitoring. | |
| prometheus | Defines the settings for the Prometheus component in user workload monitoring. | |
| prometheusOperator | Defines the settings for the Prometheus Operator component in user workload monitoring. | |
| thanosRuler | Defines the settings for the Thanos Ruler component in user workload monitoring. |