
Network Observability
Configuring and using the Network Observability Operator in OpenShift Container Platform
Abstract
Chapter 1. Network Observability Operator release notes
The Network Observability Operator enables administrators to observe and analyze network traffic flows for OpenShift Container Platform clusters.
These release notes track the development of the Network Observability Operator in the OpenShift Container Platform.
For an overview of the Network Observability Operator, see About Network Observability Operator.
1.1. Network Observability Operator 1.5.0
The following advisory is available for the Network Observability Operator 1.5.0:
1.1.1. New features and enhancements
1.1.1.1. DNS tracking enhancements
In 1.5, the TCP protocol is now supported in addition to UDP. New dashboards are also added to the Overview view of the Network Traffic page. For more information, see Configuring DNS tracking and Working with DNS tracking.
1.1.1.2. Round-trip time (RTT)
You can use TCP handshake Round-Trip Time (RTT) captured from the fentry/tcp_rcv_established Extended Berkeley Packet Filter (eBPF) hookpoint to read smoothed round-trip time (SRTT) and analyze network flows. In the Overview, Network Traffic, and Topology pages in web console, you can monitor network traffic and troubleshoot with RTT metrics, filtering, and edge labeling. For more information, see RTT Overview and Working with RTT.
1.1.1.3. Metrics, dashboards, and alerts enhancements
The Network Observability metrics dashboards in Observe → Dashboards → NetObserv have new metrics types you can use to create Prometheus alerts. You can now define available metrics in the includeList specification. In previous releases, these metrics were defined in the ignoreTags specification. For a complete list of these metrics, see Network Observability Metrics.
1.1.1.4. Improvements for Network Observability without Loki
You can create Prometheus alerts for the Netobserv dashboard using DNS, Packet drop, and RTT metrics, even if you don’t use Loki. In the previous version of Network Observability, 1.4, these metrics were only available for querying and analysis in the Network Traffic, Overview, and Topology views, which are not available without Loki. For more information, see Network Observability Metrics.
1.1.1.5. Availability zones
You can configure the FlowCollector resource to collect information about the cluster availability zones. This configuration enriches the network flow data with the topology.kubernetes.io/zone label value applied to the nodes. For more information, see Working with availability zones.
1.1.1.6. Notable enhancements
The 1.5 release of the Network Observability Operator adds improvements and new capabilities to the OpenShift Container Platform web console plugin and the Operator configuration.
Performance enhancements
The
spec.agent.ebpf.kafkaBatchSizedefault is changed from10MBto1MBto enhance eBPF performance when using Kafka.ImportantWhen upgrading from an existing installation, this new value is not set automatically in the configuration. If you monitor a performance regression with the eBPF Agent memory consumption after upgrading, you might consider reducing the
kafkaBatchSizeto the new value.
Web console enhancements:
- There are new panels added to the Overview view for DNS and RTT: Min, Max, P90, P99.
There are new panel display options added:
- Focus on one panel while keeping others viewable but with smaller focus.
- Switch graph type.
- Show Top and Overall.
- A collection latency warning is shown in the Custom time range pop-up window.
- There is enhanced visibility for the contents of the Manage panels and Manage columns pop-up windows.
- The Differentiated Services Code Point (DSCP) field for egress QoS is available for filtering QoS DSCP in the web console Network Traffic page.
Configuration enhancements:
-
The
LokiStackmode in thespec.loki.modespecification simplifies installation by automatically setting URLs, TLS, cluster roles and a cluster role binding, as well as theauthTokenvalue. TheManualmode allows more control over configuration of these settings. -
The API version changes from
flows.netobserv.io/v1beta1toflows.netobserv.io/v1beta2.
1.1.2. Bug fixes
-
Previously, it was not possible to register the console plugin manually in the web console interface if the automatic registration of the console plugin was disabled. If the
spec.console.registervalue was set tofalsein theFlowCollectorresource, the Operator would override and erase the plugin registration. With this fix, setting thespec.console.registervalue tofalsedoes not impact the console plugin registration or registration removal. As a result, the plugin can be safely registered manually. (NETOBSERV-1134) -
Previously, using the default metrics settings, the NetObserv/Health dashboard was showing an empty graph named Flows Overhead. This metric was only available by removing "namespaces-flows" and "namespaces" from the
ignoreTagslist. With this fix, this metric is visible when you use the default metrics setting. (NETOBSERV-1351) - Previously, the node on which the eBPF Agent was running would not resolve with a specific cluster configuration. This resulted in cascading consequences that culminated in a failure to provide some of the traffic metrics. With this fix, the eBPF agent’s node IP is safely provided by the Operator, inferred from the pod status. Now, the missing metrics are restored. (NETOBSERV-1430)
- Previously, the Loki error 'Input size too long' error for the Loki Operator did not include additional information to troubleshoot the problem. With this fix, help is directly displayed in the web console next to the error with a direct link for more guidance. (NETOBSERV-1464)
-
Previously, the console plugin read timeout was forced to 30s. With the
FlowCollectorv1beta2API update, you can configure thespec.loki.readTimeoutspecification to update this value according to the Loki OperatorqueryTimeoutlimit. (NETOBSERV-1443) -
Previously, the Operator bundle did not display some of the supported features by CSV annotations as expected, such as
features.operators.openshift.io/…With this fix, these annotations are set in the CSV as expected. (NETOBSERV-1305) -
Previously, the
FlowCollectorstatus sometimes oscillated betweenDeploymentInProgressandReadystates during reconciliation. With this fix, the status only becomesReadywhen all the underlying components are fully ready.(NETOBSERV-1293)
1.1.3. Known issues
-
When trying to access the web console, cache issues on OCP 4.14.10 prevent access to the Observe view. The web console shows the error message:
Failed to get a valid plugin manifest from /api/plugins/monitoring-plugin/. The recommended workaround is to update the cluster to the latest minor version. If this does not work, you need to apply the workarounds described in this Red Hat Knowledgebase article.(NETOBSERV-1493) -
Since the 1.3.0 release of the Network Observability Operator, installing the Operator causes a warning kernel taint to appear. The reason for this error is that the Network Observability eBPF agent has memory constraints that prevent preallocating the entire hashmap table. The Operator eBPF agent sets the
BPF_F_NO_PREALLOCflag so that pre-allocation is disabled when the hashmap is too memory expansive.
1.2. Network Observability Operator 1.4.2
The following advisory is available for the Network Observability Operator 1.4.2:
1.2.1. CVEs
1.3. Network Observability Operator 1.4.1
The following advisory is available for the Network Observability Operator 1.4.1:
1.3.1. CVEs
1.3.2. Bug fixes
- In 1.4, there was a known issue when sending network flow data to Kafka. The Kafka message key was ignored, causing an error with connection tracking. Now the key is used for partitioning, so each flow from the same connection is sent to the same processor. (NETOBSERV-926)
-
In 1.4, the
Innerflow direction was introduced to account for flows between pods running on the same node. Flows with theInnerdirection were not taken into account in the generated Prometheus metrics derived from flows, resulting in under-evaluated bytes and packets rates. Now, derived metrics are including flows with theInnerdirection, providing correct bytes and packets rates. (NETOBSERV-1344)
1.4. Network Observability Operator 1.4.0
The following advisory is available for the Network Observability Operator 1.4.0:
1.4.1. Channel removal
You must switch your channel from v1.0.x to stable to receive the latest Operator updates. The v1.0.x channel is now removed.
1.4.2. New features and enhancements
1.4.2.1. Notable enhancements
The 1.4 release of the Network Observability Operator adds improvements and new capabilities to the OpenShift Container Platform web console plugin and the Operator configuration.
Web console enhancements:
- In the Query Options, the Duplicate flows checkbox is added to choose whether or not to show duplicated flows.
-
You can now filter source and destination traffic with
 One-way,
 Back-and-forth, and Swap filters.
The Network Observability metrics dashboards in Observe → Dashboards → NetObserv and NetObserv / Health are modified as follows:
- The NetObserv dashboard shows top bytes, packets sent, packets received per nodes, namespaces, and workloads. Flow graphs are removed from this dashboard.
- The NetObserv / Health dashboard shows flows overhead as well as top flow rates per nodes, namespaces, and workloads.
- Infrastructure and Application metrics are shown in a split-view for namespaces and workloads.
For more information, see Network Observability metrics and Quick filters.
Configuration enhancements:
- You now have the option to specify different namespaces for any configured ConfigMap or Secret reference, such as in certificates configuration.
-
The
spec.processor.clusterNameparameter is added so that the name of the cluster appears in the flows data. This is useful in a multi-cluster context. When using OpenShift Container Platform, leave empty to make it automatically determined.
For more information, see Flow Collector sample resource and Flow Collector API Reference.
1.4.2.2. Network Observability without Loki
The Network Observability Operator is now functional and usable without Loki. If Loki is not installed, it can only export flows to KAFKA or IPFIX format and provide metrics in the Network Observability metrics dashboards. For more information, see Network Observability without Loki.
1.4.2.3. DNS tracking
In 1.4, the Network Observability Operator makes use of eBPF tracepoint hooks to enable DNS tracking. You can monitor your network, conduct security analysis, and troubleshoot DNS issues in the Network Traffic and Overview pages in the web console.
For more information, see Configuring DNS tracking and Working with DNS tracking.
1.4.2.4. SR-IOV support
You can now collect traffic from a cluster with Single Root I/O Virtualization (SR-IOV) device. For more information, see Configuring the monitoring of SR-IOV interface traffic.
1.4.2.5. IPFIX exporter support
You can now export eBPF-enriched network flows to the IPFIX collector. For more information, see Export enriched network flow data.
1.4.2.6. Packet drops
In the 1.4 release of the Network Observability Operator, eBPF tracepoint hooks are used to enable packet drop tracking. You can now detect and analyze the cause for packet drops and make decisions to optimize network performance. In OpenShift Container Platform 4.14 and later, both host drops and OVS drops are detected. In OpenShift Container Platform 4.13, only host drops are detected. For more information, see Configuring packet drop tracking and Working with packet drops.
1.4.2.7. s390x architecture support
Network Observability Operator can now run on s390x architecture. Previously it ran on amd64, ppc64le, or arm64.
1.4.3. Bug fixes
- Previously, the Prometheus metrics exported by Network Observability were computed out of potentially duplicated network flows. In the related dashboards, from Observe → Dashboards, this could result in potentially doubled rates. Note that dashboards from the Network Traffic view were not affected. Now, network flows are filtered to eliminate duplicates before metrics calculation, which results in correct traffic rates displayed in the dashboards. (NETOBSERV-1131)
-
Previously, the Network Observability Operator agents were not able to capture traffic on network interfaces when configured with Multus or SR-IOV, non-default network namespaces. Now, all available network namespaces are recognized and used for capturing flows, allowing capturing traffic for SR-IOV. There are configurations needed for the
FlowCollectorandSRIOVnetworkcustom resource to collect traffic. (NETOBSERV-1283) -
Previously, in the Network Observability Operator details from Operators → Installed Operators, the
FlowCollectorStatus field might have reported incorrect information about the state of the deployment. The status field now shows the proper conditions with improved messages. The history of events is kept, ordered by event date. (NETOBSERV-1224) -
Previously, during spikes of network traffic load, certain eBPF pods were OOM-killed and went into a
CrashLoopBackOffstate. Now, theeBPFagent memory footprint is improved, so pods are not OOM-killed and entering aCrashLoopBackOffstate. (NETOBSERV-975) -
Previously when
processor.metrics.tlswas set toPROVIDEDtheinsecureSkipVerifyoption value was forced to betrue. Now you can setinsecureSkipVerifytotrueorfalse, and provide a CA certificate if needed. (NETOBSERV-1087)
1.4.4. Known issues
-
Since the 1.2.0 release of the Network Observability Operator, using Loki Operator 5.6, a Loki certificate change periodically affects the
flowlogs-pipelinepods and results in dropped flows rather than flows written to Loki. The problem self-corrects after some time, but it still causes temporary flow data loss during the Loki certificate change. This issue has only been observed in large-scale environments of 120 nodes or greater. (NETOBSERV-980) -
Currently, when
spec.agent.ebpf.featuresincludes DNSTracking, larger DNS packets require theeBPFagent to look for DNS header outside of the 1st socket buffer (SKB) segment. A neweBPFagent helper function needs to be implemented to support it. Currently, there is no workaround for this issue. (NETOBSERV-1304) -
Currently, when
spec.agent.ebpf.featuresincludes DNSTracking, DNS over TCP packets requires theeBPFagent to look for DNS header outside of the 1st SKB segment. A neweBPFagent helper function needs to be implemented to support it. Currently, there is no workaround for this issue. (NETOBSERV-1245) -
Currently, when using a
KAFKAdeployment model, if conversation tracking is configured, conversation events might be duplicated across Kafka consumers, resulting in inconsistent tracking of conversations, and incorrect volumetric data. For that reason, it is not recommended to configure conversation tracking whendeploymentModelis set toKAFKA. (NETOBSERV-926) -
Currently, when the
processor.metrics.server.tls.typeis configured to use aPROVIDEDcertificate, the operator enters an unsteady state that might affect its performance and resource consumption. It is recommended to not use aPROVIDEDcertificate until this issue is resolved, and instead using an auto-generated certificate, settingprocessor.metrics.server.tls.typetoAUTO. (NETOBSERV-1293 -
Since the 1.3.0 release of the Network Observability Operator, installing the Operator causes a warning kernel taint to appear. The reason for this error is that the Network Observability eBPF agent has memory constraints that prevent preallocating the entire hashmap table. The Operator eBPF agent sets the
BPF_F_NO_PREALLOCflag so that pre-allocation is disabled when the hashmap is too memory expansive.
1.5. Network Observability Operator 1.3.0
The following advisory is available for the Network Observability Operator 1.3.0:
1.5.1. Channel deprecation
You must switch your channel from v1.0.x to stable to receive future Operator updates. The v1.0.x channel is deprecated and planned for removal in the next release.
1.5.2. New features and enhancements
1.5.2.1. Multi-tenancy in Network Observability
- System administrators can allow and restrict individual user access, or group access, to the flows stored in Loki. For more information, see Multi-tenancy in Network Observability.
1.5.2.2. Flow-based metrics dashboard
- This release adds a new dashboard, which provides an overview of the network flows in your OpenShift Container Platform cluster. For more information, see Network Observability metrics.
1.5.2.3. Troubleshooting with the must-gather tool
- Information about the Network Observability Operator can now be included in the must-gather data for troubleshooting. For more information, see Network Observability must-gather.
1.5.2.4. Multiple architectures now supported
-
Network Observability Operator can now run on an
amd64,ppc64le, orarm64architectures. Previously, it only ran onamd64.
1.5.3. Deprecated features
1.5.3.1. Deprecated configuration parameter setting
The release of Network Observability Operator 1.3 deprecates the spec.Loki.authToken HOST setting. When using the Loki Operator, you must now only use the FORWARD setting.
1.5.4. Bug fixes
-
Previously, when the Operator was installed from the CLI, the
RoleandRoleBindingthat are necessary for the Cluster Monitoring Operator to read the metrics were not installed as expected. The issue did not occur when the operator was installed from the web console. Now, either way of installing the Operator installs the requiredRoleandRoleBinding. (NETOBSERV-1003) -
Since version 1.2, the Network Observability Operator can raise alerts when a problem occurs with the flows collection. Previously, due to a bug, the related configuration to disable alerts,
spec.processor.metrics.disableAlertswas not working as expected and sometimes ineffectual. Now, this configuration is fixed so that it is possible to disable the alerts. (NETOBSERV-976) -
Previously, when Network Observability was configured with
spec.loki.authTokenset toDISABLED, only akubeadmincluster administrator was able to view network flows. Other types of cluster administrators received authorization failure. Now, any cluster administrator is able to view network flows. (NETOBSERV-972) -
Previously, a bug prevented users from setting
spec.consolePlugin.portNaming.enabletofalse. Now, this setting can be set tofalseto disable port-to-service name translation. (NETOBSERV-971) - Previously, the metrics exposed by the console plugin were not collected by the Cluster Monitoring Operator (Prometheus), due to an incorrect configuration. Now the configuration has been fixed so that the console plugin metrics are correctly collected and accessible from the OpenShift Container Platform web console. (NETOBSERV-765)
-
Previously, when
processor.metrics.tlswas set toAUTOin theFlowCollector, theflowlogs-pipeline servicemonitordid not adapt the appropriate TLS scheme, and metrics were not visible in the web console. Now the issue is fixed for AUTO mode. (NETOBSERV-1070) -
Previously, certificate configuration, such as used for Kafka and Loki, did not allow specifying a namespace field, implying that the certificates had to be in the same namespace where Network Observability is deployed. Moreover, when using Kafka with TLS/mTLS, the user had to manually copy the certificate(s) to the privileged namespace where the
eBPFagent pods are deployed and manually manage certificate updates, such as in the case of certificate rotation. Now, Network Observability setup is simplified by adding a namespace field for certificates in theFlowCollectorresource. As a result, users can now install Loki or Kafka in different namespaces without needing to manually copy their certificates in the Network Observability namespace. The original certificates are watched so that the copies are automatically updated when needed. (NETOBSERV-773) - Previously, the SCTP, ICMPv4 and ICMPv6 protocols were not covered by the Network Observability agents, resulting in a less comprehensive network flows coverage. These protocols are now recognized to improve the flows coverage. (NETOBSERV-934)
1.5.5. Known issues
-
When
processor.metrics.tlsis set toPROVIDEDin theFlowCollector, theflowlogs-pipelineservicemonitoris not adapted to the TLS scheme. (NETOBSERV-1087) -
Since the 1.2.0 release of the Network Observability Operator, using Loki Operator 5.6, a Loki certificate change periodically affects the
flowlogs-pipelinepods and results in dropped flows rather than flows written to Loki. The problem self-corrects after some time, but it still causes temporary flow data loss during the Loki certificate change. This issue has only been observed in large-scale environments of 120 nodes or greater.(NETOBSERV-980) -
When you install the Operator, a warning kernel taint can appear. The reason for this error is that the Network Observability eBPF agent has memory constraints that prevent preallocating the entire hashmap table. The Operator eBPF agent sets the
BPF_F_NO_PREALLOCflag so that pre-allocation is disabled when the hashmap is too memory expansive.
1.6. Network Observability Operator 1.2.0
The following advisory is available for the Network Observability Operator 1.2.0:
1.6.1. Preparing for the next update
The subscription of an installed Operator specifies an update channel that tracks and receives updates for the Operator. Until the 1.2 release of the Network Observability Operator, the only channel available was v1.0.x. The 1.2 release of the Network Observability Operator introduces the stable update channel for tracking and receiving updates. You must switch your channel from v1.0.x to stable to receive future Operator updates. The v1.0.x channel is deprecated and planned for removal in a following release.
1.6.2. New features and enhancements
1.6.2.1. Histogram in Traffic Flows view
- You can now choose to show a histogram bar chart of flows over time. The histogram enables you to visualize the history of flows without hitting the Loki query limit. For more information, see Using the histogram.
1.6.2.2. Conversation tracking
- You can now query flows by Log Type, which enables grouping network flows that are part of the same conversation. For more information, see Working with conversations.
1.6.2.3. Network Observability health alerts
-
The Network Observability Operator now creates automatic alerts if the
flowlogs-pipelineis dropping flows because of errors at the write stage or if the Loki ingestion rate limit has been reached. For more information, see Viewing health information.
1.6.3. Bug fixes
-
Previously, after changing the
namespacevalue in the FlowCollector spec,eBPFagent pods running in the previous namespace were not appropriately deleted. Now, the pods running in the previous namespace are appropriately deleted. (NETOBSERV-774) -
Previously, after changing the
caCert.namevalue in the FlowCollector spec (such as in Loki section), FlowLogs-Pipeline pods and Console plug-in pods were not restarted, therefore they were unaware of the configuration change. Now, the pods are restarted, so they get the configuration change. (NETOBSERV-772) - Previously, network flows between pods running on different nodes were sometimes not correctly identified as being duplicates because they are captured by different network interfaces. This resulted in over-estimated metrics displayed in the console plug-in. Now, flows are correctly identified as duplicates, and the console plug-in displays accurate metrics. (NETOBSERV-755)
- The "reporter" option in the console plug-in is used to filter flows based on the observation point of either source node or destination node. Previously, this option mixed the flows regardless of the node observation point. This was due to network flows being incorrectly reported as Ingress or Egress at the node level. Now, the network flow direction reporting is correct. The "reporter" option filters for source observation point, or destination observation point, as expected. (NETOBSERV-696)
- Previously, for agents configured to send flows directly to the processor as gRPC+protobuf requests, the submitted payload could be too large and is rejected by the processors' GRPC server. This occurred under very-high-load scenarios and with only some configurations of the agent. The agent logged an error message, such as: grpc: received message larger than max. As a consequence, there was information loss about those flows. Now, the gRPC payload is split into several messages when the size exceeds a threshold. As a result, the server maintains connectivity. (NETOBSERV-617)
1.6.4. Known issue
-
In the 1.2.0 release of the Network Observability Operator, using Loki Operator 5.6, a Loki certificate transition periodically affects the
flowlogs-pipelinepods and results in dropped flows rather than flows written to Loki. The problem self-corrects after some time, but it still causes temporary flow data loss during the Loki certificate transition. (NETOBSERV-980)
1.6.5. Notable technical changes
-
Previously, you could install the Network Observability Operator using a custom namespace. This release introduces the
conversion webhookwhich changes theClusterServiceVersion. Because of this change, all the available namespaces are no longer listed. Additionally, to enable Operator metrics collection, namespaces that are shared with other Operators, like theopenshift-operatorsnamespace, cannot be used. Now, the Operator must be installed in theopenshift-netobserv-operatornamespace. You cannot automatically upgrade to the new Operator version if you previously installed the Network Observability Operator using a custom namespace. If you previously installed the Operator using a custom namespace, you must delete the instance of the Operator that was installed and re-install your operator in theopenshift-netobserv-operatornamespace. It is important to note that custom namespaces, such as the commonly usednetobservnamespace, are still possible for theFlowCollector, Loki, Kafka, and other plug-ins. (NETOBSERV-907)(NETOBSERV-956)
1.7. Network Observability Operator 1.1.0
The following advisory is available for the Network Observability Operator 1.1.0:
The Network Observability Operator is now stable and the release channel is upgraded to v1.1.0.
1.7.1. Bug fix
-
Previously, unless the Loki
authTokenconfiguration was set toFORWARDmode, authentication was no longer enforced, allowing any user who could connect to the OpenShift Container Platform console in an OpenShift Container Platform cluster to retrieve flows without authentication. Now, regardless of the LokiauthTokenmode, only cluster administrators can retrieve flows. (BZ#2169468)
Chapter 2. About Network Observability
Red Hat offers cluster administrators the Network Observability Operator to observe the network traffic for OpenShift Container Platform clusters. The Network Observability Operator uses the eBPF technology to create network flows. The network flows are then enriched with OpenShift Container Platform information and stored in Loki. You can view and analyze the stored network flows information in the OpenShift Container Platform console for further insight and troubleshooting.
2.1. Optional dependencies of the Network Observability Operator
- Loki Operator: Loki is the backend that is used to store all collected flows. It is recommended to install Loki to use with the Network Observability Operator. You can choose to use Network Observability without Loki, but there are some considerations for doing this, as described in the linked section. If you choose to install Loki, it is recommended to use the Loki Operator, as it is supported by Red Hat.
- Grafana Operator: You can install Grafana for creating custom dashboards and querying capabilities, by using an open source product, such as the Grafana Operator. Red Hat does not support the Grafana Operator.
- AMQ Streams Operator: Kafka provides scalability, resiliency and high availability in the OpenShift Container Platform cluster for large scale deployments. If you choose to use Kafka, it is recommended to use the AMQ Streams Operator, because it is supported by Red Hat.
2.2. Network Observability Operator
The Network Observability Operator provides the Flow Collector API custom resource definition. A Flow Collector instance is created during installation and enables configuration of network flow collection. The Flow Collector instance deploys pods and services that form a monitoring pipeline where network flows are then collected and enriched with the Kubernetes metadata before storing in Loki. The eBPF agent, which is deployed as a daemonset object, creates the network flows.
2.3. OpenShift Container Platform console integration
OpenShift Container Platform console integration offers overview, topology view and traffic flow tables.
2.3.1. Network Observability metrics dashboards
On the Overview tab in the OpenShift Container Platform console, you can view the overall aggregated metrics of the network traffic flow on the cluster. You can choose to display the information by node, namespace, owner, pod, zone, and service. Filters and display options can further refine the metrics. For more information, see Observing the network traffic from the Overview view.
In Observe → Dashboards, the Netobserv dashboard provides a quick overview of the network flows in your OpenShift Container Platform cluster. The Netobserv/Health dashboard provides metrics about the health of the Operator. For more information, see Network Observability Metrics and Viewing health information.
2.3.2. Network Observability topology views
The OpenShift Container Platform console offers the Topology tab which displays a graphical representation of the network flows and the amount of traffic. The topology view represents traffic between the OpenShift Container Platform components as a network graph. You can refine the graph by using the filters and display options. You can access the information for node, namespace, owner, pod, and service.
2.3.3. Traffic flow tables
The traffic flow table view provides a view for raw flows, non aggregated filtering options, and configurable columns. The OpenShift Container Platform console offers the Traffic flows tab which displays the data of the network flows and the amount of traffic.
Chapter 3. Installing the Network Observability Operator
Installing Loki is a recommended prerequisite for using the Network Observability Operator. You can choose to use Network Observability without Loki, but there are some considerations for doing this, described in the previously linked section.
The Loki Operator integrates a gateway that implements multi-tenancy and authentication with Loki for data flow storage. The LokiStack resource manages Loki, which is a scalable, highly-available, multi-tenant log aggregation system, and a web proxy with OpenShift Container Platform authentication. The LokiStack proxy uses OpenShift Container Platform authentication to enforce multi-tenancy and facilitate the saving and indexing of data in Loki log stores.
The Loki Operator can also be used for configuring the LokiStack log store. The Network Observability Operator requires a dedicated LokiStack separate from the logging.
3.1. Network Observability without Loki
You can use Network Observability without Loki by not performing the Loki installation steps and skipping directly to "Installing the Network Observability Operator". If you only want to export flows to a Kafka consumer or IPFIX collector, or you only need dashboard metrics, then you do not need to install Loki or provide storage for Loki. Without Loki, there won’t be a Network Traffic panel under Observe, which means there is no overview charts, flow table, or topology. The following table compares available features with and without Loki:
Table 3.1. Comparison of feature availability with and without Loki
| With Loki | Without Loki | |
|---|---|---|
| Exporters |
|
|
| Flow-based metrics and dashboards |
|
|
| Traffic Flow Overview, Table and Topology views |
|
|
| Quick Filters |
|
|
| OpenShift Container Platform console Network Traffic tab integration |
|
|
Additional resources
3.2. Installing the Loki Operator
The Loki Operator versions 5.7+ are the supported Loki Operator versions for Network Observability; these versions provide the ability to create a LokiStack instance using the openshift-network tenant configuration mode and provide fully-automatic, in-cluster authentication and authorization support for Network Observability. There are several ways you can install Loki. One way is by using the OpenShift Container Platform web console Operator Hub.
Prerequisites
- Supported Log Store (AWS S3, Google Cloud Storage, Azure, Swift, Minio, OpenShift Data Foundation)
- OpenShift Container Platform 4.10+
- Linux Kernel 4.18+
Procedure
- In the OpenShift Container Platform web console, click Operators → OperatorHub.
- Choose Loki Operator from the list of available Operators, and click Install.
- Under Installation Mode, select All namespaces on the cluster.
Verification
- Verify that you installed the Loki Operator. Visit the Operators → Installed Operators page and look for Loki Operator.
- Verify that Loki Operator is listed with Status as Succeeded in all the projects.
To uninstall Loki, refer to the uninstallation process that corresponds with the method you used to install Loki. You might have remaining ClusterRoles and ClusterRoleBindings, data stored in object store, and persistent volume that must be removed.
3.2.1. Creating a secret for Loki storage
The Loki Operator supports a few log storage options, such as AWS S3, Google Cloud Storage, Azure, Swift, Minio, OpenShift Data Foundation. The following example shows how to create a secret for AWS S3 storage. The secret created in this example, loki-s3, is referenced in "Creating a LokiStack resource". You can create this secret in the web console or CLI.
-
Using the web console, navigate to the Project → All Projects dropdown and select Create Project. Name the project
netobservand click Create. Navigate to the Import icon, +, in the top right corner. Paste your YAML file into the editor.
The following shows an example secret YAML file for S3 storage:
apiVersion: v1 kind: Secret metadata: name: loki-s3 namespace: netobserv 1 stringData: access_key_id: QUtJQUlPU0ZPRE5ON0VYQU1QTEUK access_key_secret: d0phbHJYVXRuRkVNSS9LN01ERU5HL2JQeFJmaUNZRVhBTVBMRUtFWQo= bucketnames: s3-bucket-name endpoint: https://s3.eu-central-1.amazonaws.com region: eu-central-1- 1
- The installation examples in this documentation use the same namespace,
netobserv, across all components. You can optionally use a different namespace for the different components
Verification
- Once you create the secret, you should see it listed under Workloads → Secrets in the web console.
Additional resources
3.2.2. Creating a LokiStack custom resource
You can deploy a LokiStack custom resource (CR) by using the web console or OpenShift CLI (oc) to create a namespace, or new project.
Procedure
- Navigate to Operators → Installed Operators, viewing All projects from the Project dropdown.
- Look for Loki Operator. In the details, under Provided APIs, select LokiStack.
- Click Create LokiStack.
Ensure the following fields are specified in either Form View or YAML view:
apiVersion: loki.grafana.com/v1
kind: LokiStack
metadata:
  name: loki
  namespace: netobserv 1
spec:
  size: 1x.small 2
  storage:
    schemas:
    - version: v12
      effectiveDate: '2022-06-01'
    secret:
      name: loki-s3
      type: s3
  storageClassName: gp3 3
  tenants:
    mode: openshift-network
- 1
- The installation examples in this documentation use the same namespace,
netobserv, across all components. You can optionally use a different namespace. - 2
- Specify the deployment size. In the Loki Operator 5.8 and later versions, the supported size options for production instances of Loki are
1x.extra-small,1x.small, or1x.medium.ImportantIt is not possible to change the number
1xfor the deployment size. - 3
- Use a storage class name that is available on the cluster for
ReadWriteOnceaccess mode. You can useoc get storageclassesto see what is available on your cluster.ImportantYou must not reuse the same
LokiStackCR that is used for logging.
- Click Create.
3.2.3. Creating a new group for the cluster-admin user role
Querying application logs for multiple namespaces as a cluster-admin user, where the sum total of characters of all of the namespaces in the cluster is greater than 5120, results in the error Parse error: input size too long (XXXX > 5120). For better control over access to logs in LokiStack, make the cluster-admin user a member of the cluster-admin group. If the cluster-admin group does not exist, create it and add the desired users to it.
Use the following procedure to create a new group for users with cluster-admin permissions.
Procedure
Enter the following command to create a new group:
$ oc adm groups new cluster-admin
Enter the following command to add the desired user to the
cluster-admingroup:$ oc adm groups add-users cluster-admin <username>
Enter the following command to add
cluster-adminuser role to the group:$ oc adm policy add-cluster-role-to-group cluster-admin cluster-admin
3.2.4. Custom admin group access
If you have a large deployment with a number of users who require broader permissions, you can create a custom group using the adminGroup field. Users who are members of any group specified in the adminGroups field of the LokiStack CR are considered admins. Admin users have access to all application logs in all namespaces, if they also get assigned the cluster-logging-application-view role.
Example LokiStack CR
apiVersion: loki.grafana.com/v1
kind: LokiStack
metadata:
  name: logging-loki
  namespace: openshift-logging
spec:
  tenants:
    mode: openshift-network 1
    openshift:
      adminGroups: 2
      - cluster-admin
      - custom-admin-group 3
3.2.5. Loki deployment sizing
Sizing for Loki follows the format of 1x.<size> where the value 1x is number of instances and <size> specifies performance capabilities.
It is not possible to change the number 1x for the deployment size.
Table 3.2. Loki sizing
| 1x.demo | 1x.extra-small | 1x.small | 1x.medium | |
|---|---|---|---|---|
| Data transfer | Demo use only | 100GB/day | 500GB/day | 2TB/day |
| Queries per second (QPS) | Demo use only | 1-25 QPS at 200ms | 25-50 QPS at 200ms | 25-75 QPS at 200ms |
| Replication factor | None | 2 | 2 | 2 |
| Total CPU requests | None | 14 vCPUs | 34 vCPUs | 54 vCPUs |
| Total memory requests | None | 31Gi | 67Gi | 139Gi |
| Total disk requests | 40Gi | 430Gi | 430Gi | 590Gi |
3.2.6. LokiStack ingestion limits and health alerts
The LokiStack instance comes with default settings according to the configured size. It is possible to override some of these settings, such as the ingestion and query limits. You might want to update them if you get Loki errors showing up in the Console plugin, or in flowlogs-pipeline logs. An automatic alert in the web console notifies you when these limits are reached.
Here is an example of configured limits:
spec:
  limits:
    global:
      ingestion:
        ingestionBurstSize: 40
        ingestionRate: 20
        maxGlobalStreamsPerTenant: 25000
      queries:
        maxChunksPerQuery: 2000000
        maxEntriesLimitPerQuery: 10000
        maxQuerySeries: 3000
For more information about these settings, see the LokiStack API reference.
3.2.7. Enabling multi-tenancy in Network Observability
Multi-tenancy in the Network Observability Operator allows and restricts individual user access, or group access, to the flows stored in Loki. Access is enabled for project admins. Project admins who have limited access to some namespaces can access flows for only those namespaces.
Prerequisite
- You have installed at least Loki Operator version 5.7
- You must be logged in as a project administrator
Procedure
Authorize reading permission to
user1by running the following command:$ oc adm policy add-cluster-role-to-user netobserv-reader user1
Now, the data is restricted to only allowed user namespaces. For example, a user that has access to a single namespace can see all the flows internal to this namespace, as well as flows going from and to this namespace. Project admins have access to the Administrator perspective in the OpenShift Container Platform console to access the Network Flows Traffic page.
3.3. Installing the Network Observability Operator
You can install the Network Observability Operator using the OpenShift Container Platform web console Operator Hub. When you install the Operator, it provides the FlowCollector custom resource definition (CRD). You can set specifications in the web console when you create the FlowCollector.
The actual memory consumption of the Operator depends on your cluster size and the number of resources deployed. Memory consumption might need to be adjusted accordingly. For more information refer to "Network Observability controller manager pod runs out of memory" in the "Important Flow Collector configuration considerations" section.
Prerequisites
- If you choose to use Loki, install the Loki Operator version 5.7+.
-
You must have
cluster-adminprivileges. -
One of the following supported architectures is required:
amd64,ppc64le,arm64, ors390x. - Any CPU supported by Red Hat Enterprise Linux (RHEL) 9.
- Must be configured with OVN-Kubernetes or OpenShift SDN as the main network plugin, and optionally using secondary interfaces, such as Multus and SR-IOV.
Additionally, this installation example uses the netobserv namespace, which is used across all components. You can optionally use a different namespace.
Procedure
- In the OpenShift Container Platform web console, click Operators → OperatorHub.
- Choose Network Observability Operator from the list of available Operators in the OperatorHub, and click Install.
-
Select the checkbox
Enable Operator recommended cluster monitoring on this Namespace. - Navigate to Operators → Installed Operators. Under Provided APIs for Network Observability, select the Flow Collector link.
Navigate to the Flow Collector tab, and click Create FlowCollector. Make the following selections in the form view:
-
spec.agent.ebpf.Sampling: Specify a sampling size for flows. Lower sampling sizes will have higher impact on resource utilization. For more information, see the "FlowCollector API reference",
spec.agent.ebpf. If you are using Loki, set the following specifications:
-
spec.loki.mode: Set this to the
LokiStackmode, which automatically sets URLs, TLS, cluster roles and a cluster role binding, as well as theauthTokenvalue. Alternatively, theManualmode allows more control over configuration of these settings. -
spec.loki.lokistack.name: Set this to the name of your
LokiStackresource. In this documentation,lokiis used.
-
spec.loki.mode: Set this to the
-
Optional: If you are in a large-scale environment, consider configuring the
FlowCollectorwith Kafka for forwarding data in a more resilient, scalable way. See "Configuring the Flow Collector resource with Kafka storage" in the "Important Flow Collector configuration considerations" section. -
Optional: Configure other optional settings before the next step of creating the
FlowCollector. For example, if you choose not to use Loki, then you can configure exporting flows to Kafka or IPFIX. See "Export enriched network flow data to Kafka and IPFIX" and more in the "Important Flow Collector configuration considerations" section.
-
spec.agent.ebpf.Sampling: Specify a sampling size for flows. Lower sampling sizes will have higher impact on resource utilization. For more information, see the "FlowCollector API reference",
- Click Create.
Verification
To confirm this was successful, when you navigate to Observe you should see Network Traffic listed in the options.
In the absence of Application Traffic within the OpenShift Container Platform cluster, default filters might show that there are "No results", which results in no visual flow. Beside the filter selections, select Clear all filters to see the flow.
3.4. Important Flow Collector configuration considerations
Once you create the FlowCollector instance, you can reconfigure it, but the pods are terminated and recreated again, which can be disruptive. Therefore, you can consider configuring the following options when creating the FlowCollector for the first time:
Additional resources
For more general information about Flow Collector specifications and the Network Observability Operator architecture and resource use, see the following resources:
3.5. Installing Kafka (optional)
The Kafka Operator is supported for large scale environments. Kafka provides high-throughput and low-latency data feeds for forwarding network flow data in a more resilient, scalable way. You can install the Kafka Operator as Red Hat AMQ Streams from the Operator Hub, just as the Loki Operator and Network Observability Operator were installed. Refer to "Configuring the FlowCollector resource with Kafka" to configure Kafka as a storage option.
To uninstall Kafka, refer to the uninstallation process that corresponds with the method you used to install.
Additional resources
3.6. Uninstalling the Network Observability Operator
You can uninstall the Network Observability Operator using the OpenShift Container Platform web console Operator Hub, working in the Operators → Installed Operators area.
Procedure
Remove the
FlowCollectorcustom resource.- Click Flow Collector, which is next to the Network Observability Operator in the Provided APIs column.
-
Click the options menu
 for the cluster and select Delete FlowCollector.
Uninstall the Network Observability Operator.
- Navigate back to the Operators → Installed Operators area.
-
Click the options menu
next to the Network Observability Operator and select Uninstall Operator.
-
Home → Projects and select
openshift-netobserv-operator - Navigate to Actions and select Delete Project
Remove the
FlowCollectorcustom resource definition (CRD).- Navigate to Administration → CustomResourceDefinitions.
-
Look for FlowCollector and click the options menu
.
Select Delete CustomResourceDefinition.
ImportantThe Loki Operator and Kafka remain if they were installed and must be removed separately. Additionally, you might have remaining data stored in an object store, and a persistent volume that must be removed.
Chapter 4. Network Observability Operator in OpenShift Container Platform
Network Observability is an OpenShift operator that deploys a monitoring pipeline to collect and enrich network traffic flows that are produced by the Network Observability eBPF agent.
4.1. Viewing statuses
The Network Observability Operator provides the Flow Collector API. When a Flow Collector resource is created, it deploys pods and services to create and store network flows in the Loki log store, as well as to display dashboards, metrics, and flows in the OpenShift Container Platform web console.
Procedure
Run the following command to view the state of
FlowCollector:$ oc get flowcollector/cluster
Example output
NAME      AGENT   SAMPLING (EBPF)   DEPLOYMENT MODEL   STATUS
cluster   EBPF    50                DIRECT             Ready
Check the status of pods running in the
netobservnamespace by entering the following command:$ oc get pods -n netobserv
Example output
NAME                              READY   STATUS    RESTARTS   AGE
flowlogs-pipeline-56hbp           1/1     Running   0          147m
flowlogs-pipeline-9plvv           1/1     Running   0          147m
flowlogs-pipeline-h5gkb           1/1     Running   0          147m
flowlogs-pipeline-hh6kf           1/1     Running   0          147m
flowlogs-pipeline-w7vv5           1/1     Running   0          147m
netobserv-plugin-cdd7dc6c-j8ggp   1/1     Running   0          147m
flowlogs-pipeline pods collect flows, enriches the collected flows, then send flows to the Loki storage. netobserv-plugin pods create a visualization plugin for the OpenShift Container Platform Console.
Check the status of pods running in the namespace
netobserv-privilegedby entering the following command:$ oc get pods -n netobserv-privileged
Example output
NAME                         READY   STATUS    RESTARTS   AGE
netobserv-ebpf-agent-4lpp6   1/1     Running   0          151m
netobserv-ebpf-agent-6gbrk   1/1     Running   0          151m
netobserv-ebpf-agent-klpl9   1/1     Running   0          151m
netobserv-ebpf-agent-vrcnf   1/1     Running   0          151m
netobserv-ebpf-agent-xf5jh   1/1     Running   0          151m
netobserv-ebpf-agent pods monitor network interfaces of the nodes to get flows and send them to flowlogs-pipeline pods.
If you are using the Loki Operator, check the status of pods running in the
openshift-operators-redhatnamespace by entering the following command:$ oc get pods -n openshift-operators-redhat
Example output
NAME                                                READY   STATUS    RESTARTS   AGE
loki-operator-controller-manager-5f6cff4f9d-jq25h   2/2     Running   0          18h
lokistack-compactor-0                               1/1     Running   0          18h
lokistack-distributor-654f87c5bc-qhkhv              1/1     Running   0          18h
lokistack-distributor-654f87c5bc-skxgm              1/1     Running   0          18h
lokistack-gateway-796dc6ff7-c54gz                   2/2     Running   0          18h
lokistack-index-gateway-0                           1/1     Running   0          18h
lokistack-index-gateway-1                           1/1     Running   0          18h
lokistack-ingester-0                                1/1     Running   0          18h
lokistack-ingester-1                                1/1     Running   0          18h
lokistack-ingester-2                                1/1     Running   0          18h
lokistack-querier-66747dc666-6vh5x                  1/1     Running   0          18h
lokistack-querier-66747dc666-cjr45                  1/1     Running   0          18h
lokistack-querier-66747dc666-xh8rq                  1/1     Running   0          18h
lokistack-query-frontend-85c6db4fbd-b2xfb           1/1     Running   0          18h
lokistack-query-frontend-85c6db4fbd-jm94f           1/1     Running   0          18h
4.2. Network Observablity Operator architecture
The Network Observability Operator provides the FlowCollector API, which is instantiated at installation and configured to reconcile the eBPF agent, the flowlogs-pipeline, and the netobserv-plugin components. Only a single FlowCollector per cluster is supported.
The eBPF agent runs on each cluster node with some privileges to collect network flows. The flowlogs-pipeline receives the network flows data and enriches the data with Kubernetes identifiers. If you are using Loki, the flowlogs-pipeline sends flow logs data to Loki for storing and indexing. The netobserv-plugin, which is a dynamic OpenShift Container Platform web console plugin, queries Loki to fetch network flows data. Cluster-admins can view the data in the web console.
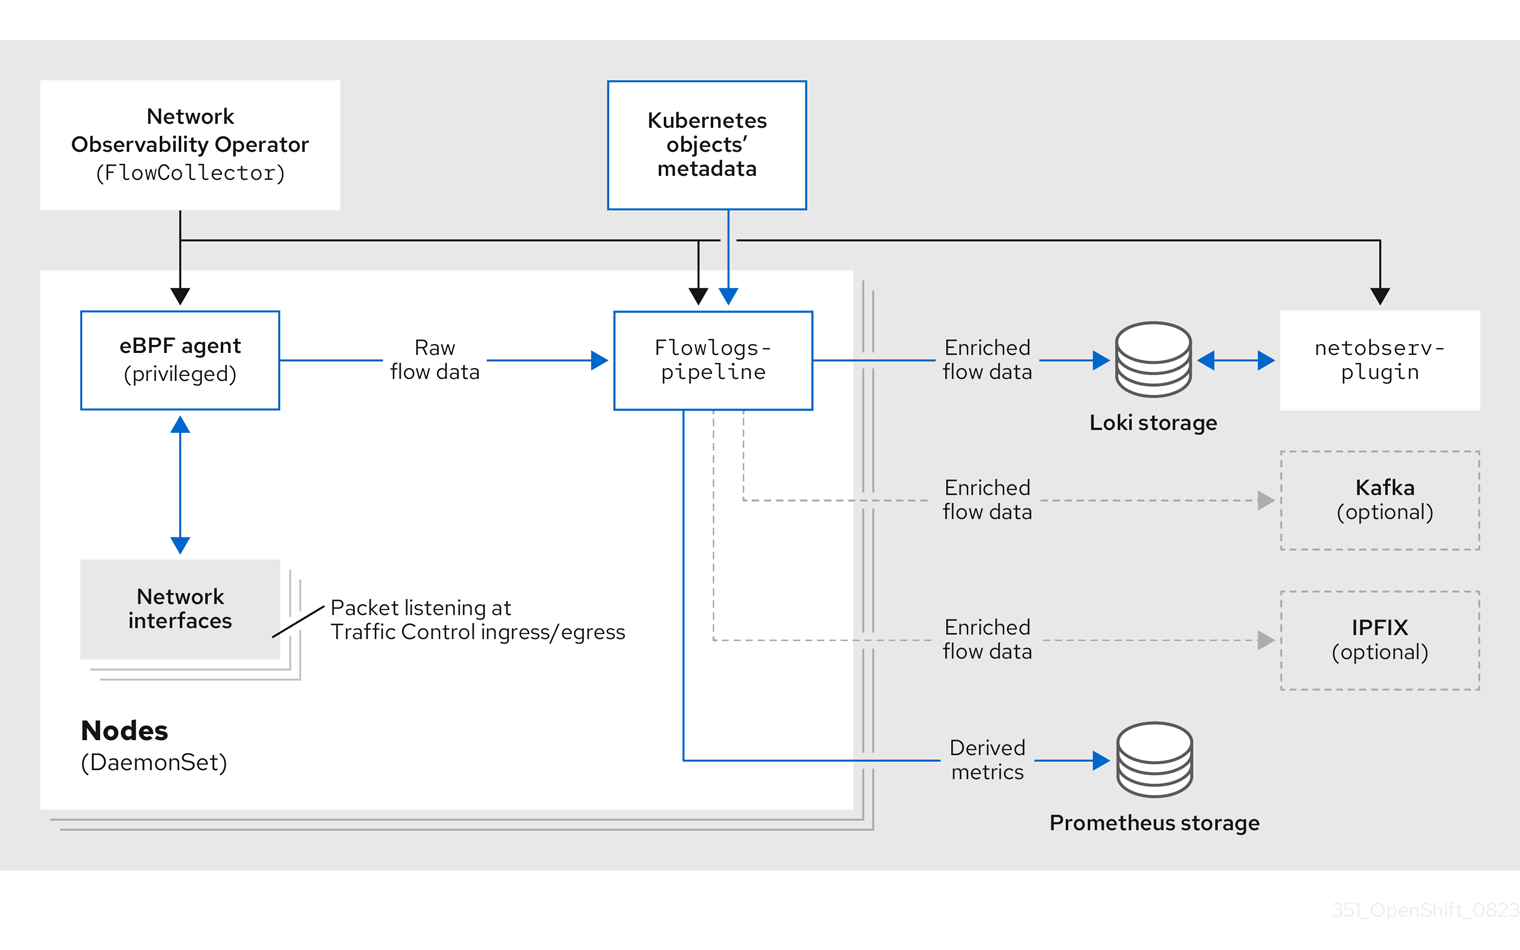
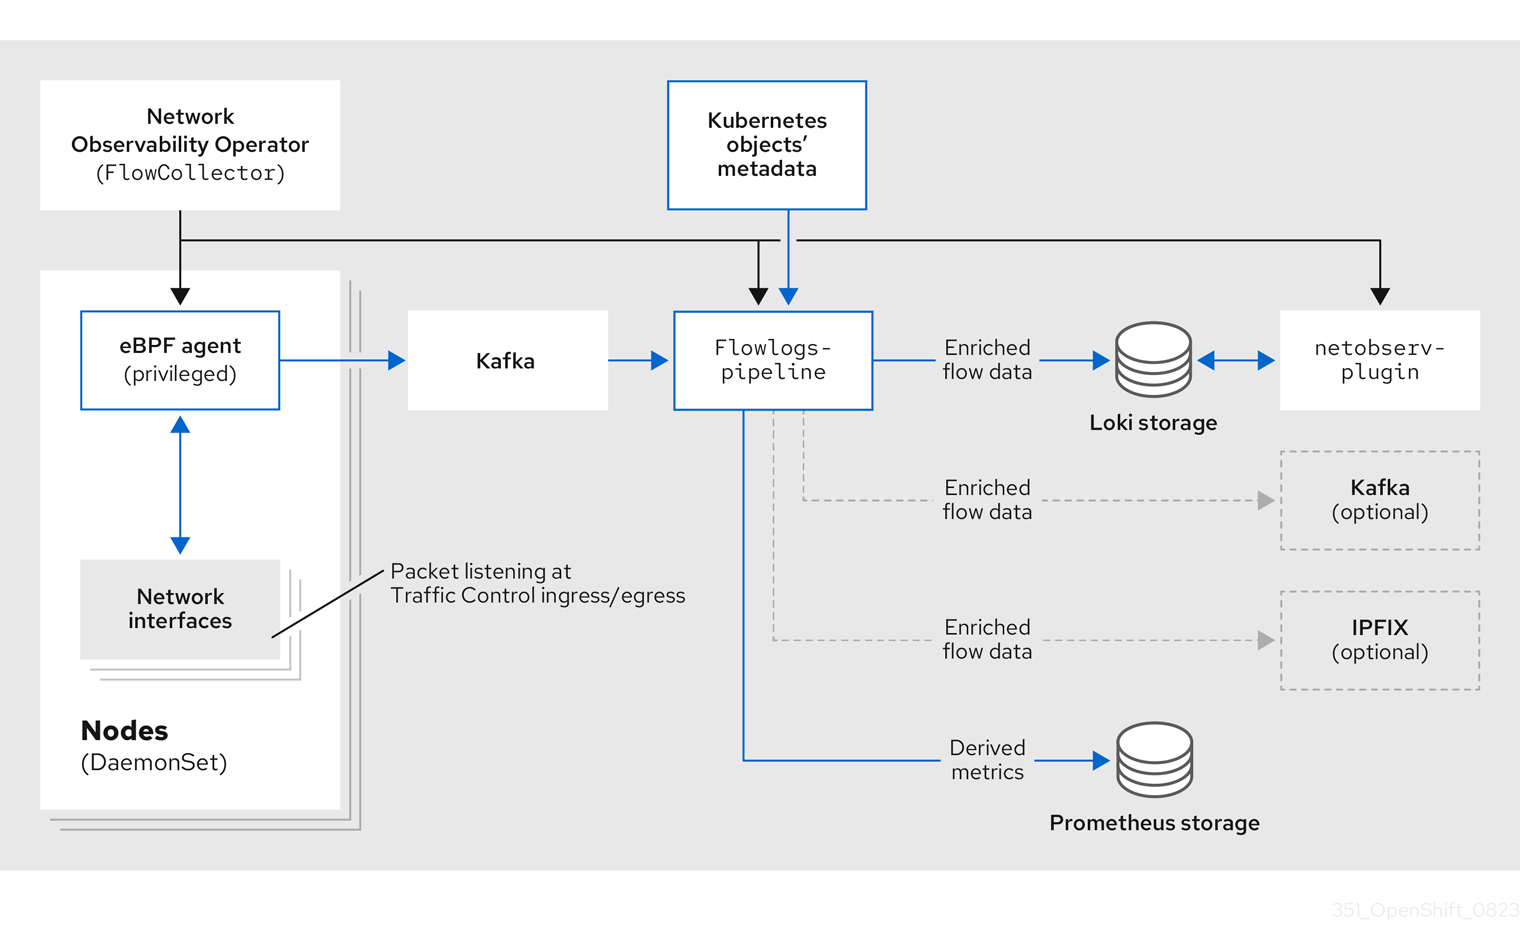
If you are using the Kafka option, the eBPF agent sends the network flow data to Kafka, and the flowlogs-pipeline reads from the Kafka topic before sending to Loki, as shown in the following diagram.
4.3. Viewing Network Observability Operator status and configuration
You can inspect the status and view the details of the FlowCollector using the oc describe command.
Procedure
Run the following command to view the status and configuration of the Network Observability Operator:
$ oc describe flowcollector/cluster
Chapter 5. Configuring the Network Observability Operator
You can update the Flow Collector API resource to configure the Network Observability Operator and its managed components. The Flow Collector is explicitly created during installation. Since this resource operates cluster-wide, only a single FlowCollector is allowed, and it has to be named cluster.
5.1. View the FlowCollector resource
You can view and edit YAML directly in the OpenShift Container Platform web console.
Procedure
- In the web console, navigate to Operators → Installed Operators.
- Under the Provided APIs heading for the NetObserv Operator, select Flow Collector.
-
Select cluster then select the YAML tab. There, you can modify the
FlowCollectorresource to configure the Network Observability operator.
The following example shows a sample FlowCollector resource for OpenShift Container Platform Network Observability operator:
Sample FlowCollector resource
apiVersion: flows.netobserv.io/v1beta2
kind: FlowCollector
metadata:
  name: cluster
spec:
  namespace: netobserv
  deploymentModel: Direct
  agent:
    type: eBPF                                1
    ebpf:
      sampling: 50                            2
      logLevel: info
      privileged: false
      resources:
        requests:
          memory: 50Mi
          cpu: 100m
        limits:
          memory: 800Mi
  processor:               3
    logLevel: info
    resources:
      requests:
        memory: 100Mi
        cpu: 100m
      limits:
        memory: 800Mi
    logTypes: Flows
    advanced:
      conversationEndTimeout: 10s
      conversationHeartbeatInterval: 30s
  loki:                     4
    mode: LokiStack         5
  consolePlugin:
    register: true
    logLevel: info
    portNaming:
      enable: true
      portNames:
        "3100": loki
    quickFilters:            6
    - name: Applications
      filter:
        src_namespace!: 'openshift-,netobserv'
        dst_namespace!: 'openshift-,netobserv'
      default: true
    - name: Infrastructure
      filter:
        src_namespace: 'openshift-,netobserv'
        dst_namespace: 'openshift-,netobserv'
    - name: Pods network
      filter:
        src_kind: 'Pod'
        dst_kind: 'Pod'
      default: true
    - name: Services network
      filter:
        dst_kind: 'Service'
- 1
- The Agent specification,
spec.agent.type, must beEBPF. eBPF is the only OpenShift Container Platform supported option. - 2
- You can set the Sampling specification,
spec.agent.ebpf.sampling, to manage resources. Lower sampling values might consume a large amount of computational, memory and storage resources. You can mitigate this by specifying a sampling ratio value. A value of 100 means 1 flow every 100 is sampled. A value of 0 or 1 means all flows are captured. The lower the value, the increase in returned flows and the accuracy of derived metrics. By default, eBPF sampling is set to a value of 50, so 1 flow every 50 is sampled. Note that more sampled flows also means more storage needed. It is recommend to start with default values and refine empirically, to determine which setting your cluster can manage. - 3
- The Processor specification
spec.processor.can be set to enable conversation tracking. When enabled, conversation events are queryable in the web console. Thespec.processor.logTypesvalue isFlows. Thespec.processor.advancedvalues areConversations,EndedConversations, orALL. Storage requirements are highest forAlland lowest forEndedConversations. - 4
- The Loki specification,
spec.loki, specifies the Loki client. The default values match the Loki install paths mentioned in the Installing the Loki Operator section. If you used another installation method for Loki, specify the appropriate client information for your install. - 5
- The
LokiStackmode automatically sets a few configurations:querierUrl,ingesterUrlandstatusUrl,tenantID, and corresponding TLS configuration. Cluster roles and a cluster role binding are created for reading and writing logs to Loki. AndauthTokenis set toForward. You can set these manually using theManualmode. - 6
- The
spec.quickFiltersspecification defines filters that show up in the web console. TheApplicationfilter keys,src_namespaceanddst_namespace, are negated (!), so theApplicationfilter shows all traffic that does not originate from, or have a destination to, anyopenshift-ornetobservnamespaces. For more information, see Configuring quick filters below.
Additional resources
For more information about conversation tracking, see Working with conversations.
5.2. Configuring the Flow Collector resource with Kafka
You can configure the FlowCollector resource to use Kafka for high-throughput and low-latency data feeds. A Kafka instance needs to be running, and a Kafka topic dedicated to OpenShift Container Platform Network Observability must be created in that instance. For more information, see Kafka documentation with AMQ Streams.
Prerequisites
- Kafka is installed. Red Hat supports Kafka with AMQ Streams Operator.
Procedure
- In the web console, navigate to Operators → Installed Operators.
- Under the Provided APIs heading for the Network Observability Operator, select Flow Collector.
- Select the cluster and then click the YAML tab.
-
Modify the
FlowCollectorresource for OpenShift Container Platform Network Observability Operator to use Kafka, as shown in the following sample YAML:
Sample Kafka configuration in FlowCollector resource
apiVersion: flows.netobserv.io/v1beta2
kind: FlowCollector
metadata:
  name: cluster
spec:
  deploymentModel: Kafka                                    1
  kafka:
    address: "kafka-cluster-kafka-bootstrap.netobserv"      2
    topic: network-flows                                    3
    tls:
      enable: false                                         4
- 1
- Set
spec.deploymentModeltoKafkainstead ofDirectto enable the Kafka deployment model. - 2
spec.kafka.addressrefers to the Kafka bootstrap server address. You can specify a port if needed, for instancekafka-cluster-kafka-bootstrap.netobserv:9093for using TLS on port 9093.- 3
spec.kafka.topicshould match the name of a topic created in Kafka.- 4
spec.kafka.tlscan be used to encrypt all communications to and from Kafka with TLS or mTLS. When enabled, the Kafka CA certificate must be available as a ConfigMap or a Secret, both in the namespace where theflowlogs-pipelineprocessor component is deployed (default:netobserv) and where the eBPF agents are deployed (default:netobserv-privileged). It must be referenced withspec.kafka.tls.caCert. When using mTLS, client secrets must be available in these namespaces as well (they can be generated for instance using the AMQ Streams User Operator) and referenced withspec.kafka.tls.userCert.
5.3. Export enriched network flow data
You can send network flows to Kafka, IPFIX, or both at the same time. Any processor or storage that supports Kafka or IPFIX input, such as Splunk, Elasticsearch, or Fluentd, can consume the enriched network flow data.
Prerequisites
-
Your Kafka or IPFIX collector endpoint(s) are available from Network Observability
flowlogs-pipelinepods.
Procedure
- In the web console, navigate to Operators → Installed Operators.
- Under the Provided APIs heading for the NetObserv Operator, select Flow Collector.
- Select cluster and then select the YAML tab.
Edit the
FlowCollectorto configurespec.exportersas follows:apiVersion: flows.netobserv.io/v1beta2 kind: FlowCollector metadata: name: cluster spec: exporters: - type: Kafka 1 kafka: address: "kafka-cluster-kafka-bootstrap.netobserv" topic: netobserv-flows-export 2 tls: enable: false 3 - type: IPFIX 4 ipfix: targetHost: "ipfix-collector.ipfix.svc.cluster.local" targetPort: 4739 transport: tcp or udp 5
- 2
- The Network Observability Operator exports all flows to the configured Kafka topic.
- 3
- You can encrypt all communications to and from Kafka with SSL/TLS or mTLS. When enabled, the Kafka CA certificate must be available as a ConfigMap or a Secret, both in the namespace where the
flowlogs-pipelineprocessor component is deployed (default: netobserv). It must be referenced withspec.exporters.tls.caCert. When using mTLS, client secrets must be available in these namespaces as well (they can be generated for instance using the AMQ Streams User Operator) and referenced withspec.exporters.tls.userCert. - 1 4
- You can export flows to IPFIX instead of or in conjunction with exporting flows to Kafka.
- 5
- You have the option to specify transport. The default value is
tcpbut you can also specifyudp.
- After configuration, network flows data can be sent to an available output in a JSON format. For more information, see Network flows format reference.
Additional resources
For more information about specifying flow format, see Network flows format reference.
5.4. Updating the Flow Collector resource
As an alternative to editing YAML in the OpenShift Container Platform web console, you can configure specifications, such as eBPF sampling, by patching the flowcollector custom resource (CR):
Procedure
Run the following command to patch the
flowcollectorCR and update thespec.agent.ebpf.samplingvalue:$ oc patch flowcollector cluster --type=json -p "[{"op": "replace", "path": "/spec/agent/ebpf/sampling", "value": <new value>}] -n netobserv"
5.5. Configuring quick filters
You can modify the filters in the FlowCollector resource. Exact matches are possible using double-quotes around values. Otherwise, partial matches are used for textual values. The bang (!) character, placed at the end of a key, means negation. See the sample FlowCollector resource for more context about modifying the YAML.
The filter matching types "all of" or "any of" is a UI setting that the users can modify from the query options. It is not part of this resource configuration.
Here is a list of all available filter keys:
Table 5.1. Filter keys
| Universal* | Source | Destination | Description |
|---|---|---|---|
| namespace |
|
| Filter traffic related to a specific namespace. |
| name |
|
| Filter traffic related to a given leaf resource name, such as a specific pod, service, or node (for host-network traffic). |
| kind |
|
| Filter traffic related to a given resource kind. The resource kinds include the leaf resource (Pod, Service or Node), or the owner resource (Deployment and StatefulSet). |
| owner_name |
|
| Filter traffic related to a given resource owner; that is, a workload or a set of pods. For example, it can be a Deployment name, a StatefulSet name, etc. |
| resource |
|
|
Filter traffic related to a specific resource that is denoted by its canonical name, that identifies it uniquely. The canonical notation is |
| address |
|
| Filter traffic related to an IP address. IPv4 and IPv6 are supported. CIDR ranges are also supported. |
| mac |
|
| Filter traffic related to a MAC address. |
| port |
|
| Filter traffic related to a specific port. |
| host_address |
|
| Filter traffic related to the host IP address where the pods are running. |
| protocol | N/A | N/A | Filter traffic related to a protocol, such as TCP or UDP. |
-
Universal keys filter for any of source or destination. For example, filtering
name: 'my-pod'means all traffic frommy-podand all traffic tomy-pod, regardless of the matching type used, whether Match all or Match any.
5.6. Configuring monitoring for SR-IOV interface traffic
In order to collect traffic from a cluster with a Single Root I/O Virtualization (SR-IOV) device, you must set the FlowCollector spec.agent.ebpf.privileged field to true. Then, the eBPF agent monitors other network namespaces in addition to the host network namespaces, which are monitored by default. When a pod with a virtual functions (VF) interface is created, a new network namespace is created. With SRIOVNetwork policy IPAM configurations specified, the VF interface is migrated from the host network namespace to the pod network namespace.
Prerequisites
- Access to an OpenShift Container Platform cluster with a SR-IOV device.
-
The
SRIOVNetworkcustom resource (CR)spec.ipamconfiguration must be set with an IP address from the range that the interface lists or from other plugins.
Procedure
- In the web console, navigate to Operators → Installed Operators.
- Under the Provided APIs heading for the NetObserv Operator, select Flow Collector.
- Select cluster and then select the YAML tab.
-
Configure the
FlowCollectorcustom resource. A sample configuration is as follows:
Configure FlowCollector for SR-IOV monitoring
apiVersion: flows.netobserv.io/v1beta2
kind: FlowCollector
metadata:
  name: cluster
spec:
  namespace: netobserv
  deploymentModel: Direct
  agent:
    type: eBPF
    ebpf:
      privileged: true   1
- 1
- The
spec.agent.ebpf.privilegedfield value must be set totrueto enable SR-IOV monitoring.
Additional resources
For more information about creating the SriovNetwork custom resource, see Creating an additional SR-IOV network attachment with the CNI VRF plugin.
5.7. Resource management and performance considerations
The amount of resources required by Network Observability depends on the size of your cluster and your requirements for the cluster to ingest and store observability data. To manage resources and set performance criteria for your cluster, consider configuring the following settings. Configuring these settings might meet your optimal setup and observability needs.
The following settings can help you manage resources and performance from the outset:
- eBPF Sampling
-
You can set the Sampling specification,
spec.agent.ebpf.sampling, to manage resources. Smaller sampling values might consume a large amount of computational, memory and storage resources. You can mitigate this by specifying a sampling ratio value. A value of100means 1 flow every 100 is sampled. A value of0or1means all flows are captured. Smaller values result in an increase in returned flows and the accuracy of derived metrics. By default, eBPF sampling is set to a value of 50, so 1 flow every 50 is sampled. Note that more sampled flows also means more storage needed. Consider starting with the default values and refine empirically, in order to determine which setting your cluster can manage. - Restricting or excluding interfaces
-
Reduce the overall observed traffic by setting the values for
spec.agent.ebpf.interfacesandspec.agent.ebpf.excludeInterfaces. By default, the agent fetches all the interfaces in the system, except the ones listed inexcludeInterfacesandlo(local interface). Note that the interface names might vary according to the Container Network Interface (CNI) used.
The following settings can be used to fine-tune performance after the Network Observability has been running for a while:
- Resource requirements and limits
-
Adapt the resource requirements and limits to the load and memory usage you expect on your cluster by using the
spec.agent.ebpf.resourcesandspec.processor.resourcesspecifications. The default limits of 800MB might be sufficient for most medium-sized clusters. - Cache max flows timeout
-
Control how often flows are reported by the agents by using the eBPF agent’s
spec.agent.ebpf.cacheMaxFlowsandspec.agent.ebpf.cacheActiveTimeoutspecifications. A larger value results in less traffic being generated by the agents, which correlates with a lower CPU load. However, a larger value leads to a slightly higher memory consumption, and might generate more latency in the flow collection.
5.7.1. Resource considerations
The following table outlines examples of resource considerations for clusters with certain workload sizes.
The examples outlined in the table demonstrate scenarios that are tailored to specific workloads. Consider each example only as a baseline from which adjustments can be made to accommodate your workload needs.
Table 5.2. Resource recommendations
| Extra small (10 nodes) | Small (25 nodes) | Medium (65 nodes) [2] | Large (120 nodes) [2] | |
|---|---|---|---|---|
| Worker Node vCPU and memory | 4 vCPUs| 16GiB mem [1] | 16 vCPUs| 64GiB mem [1] | 16 vCPUs| 64GiB mem [1] | 16 vCPUs| 64GiB Mem [1] |
| LokiStack size |
|
|
|
|
| Network Observability controller memory limit | 400Mi (default) | 400Mi (default) | 400Mi (default) | 400Mi (default) |
| eBPF sampling rate | 50 (default) | 50 (default) | 50 (default) | 50 (default) |
| eBPF memory limit | 800Mi (default) | 800Mi (default) | 800Mi (default) | 1600Mi |
| FLP memory limit | 800Mi (default) | 800Mi (default) | 800Mi (default) | 800Mi (default) |
| FLP Kafka partitions | N/A | 48 | 48 | 48 |
| Kafka consumer replicas | N/A | 24 | 24 | 24 |
| Kafka brokers | N/A | 3 (default) | 3 (default) | 3 (default) |
- Tested with AWS M6i instances.
-
In addition to this worker and its controller, 3 infra nodes (size
M6i.12xlarge) and 1 workload node (sizeM6i.8xlarge) were tested.
Chapter 6. Network Policy
As a user with the admin role, you can create a network policy for the netobserv namespace to secure inbound access to the Network Observability Operator.
6.1. Creating a network policy for Network Observability
You might need to create a network policy to secure ingress traffic to the netobserv namespace. In the web console, you can create a network policy using the form view.
Procedure
- Navigate to Networking → NetworkPolicies.
-
Select the
netobservproject from the Project dropdown menu. -
Name the policy. For this example, the policy name is
allow-ingress. - Click Add ingress rule three times to create three ingress rules.
Specify the following in the form:
Make the following specifications for the first Ingress rule:
- From the Add allowed source dropdown menu, select Allow pods from the same namespace.
Make the following specifications for the second Ingress rule:
- From the Add allowed source dropdown menu, select Allow pods from inside the cluster.
- Click + Add namespace selector.
-
Add the label,
kubernetes.io/metadata.name, and the selector,openshift-console.
Make the following specifications for the third Ingress rule:
- From the Add allowed source dropdown menu, select Allow pods from inside the cluster.
- Click + Add namespace selector.
-
Add the label,
kubernetes.io/metadata.name, and the selector,openshift-monitoring.
Verification
- Navigate to Observe → Network Traffic.
- View the Traffic Flows tab, or any tab, to verify that the data is displayed.
- Navigate to Observe → Dashboards. In the NetObserv/Health selection, verify that the flows are being ingested and sent to Loki, which is represented in the first graph.
6.2. Example network policy
The following annotates an example NetworkPolicy object for the netobserv namespace:
Sample network policy
kind: NetworkPolicy
apiVersion: networking.k8s.io/v1
metadata:
  name: allow-ingress
  namespace: netobserv
spec:
  podSelector: {}            1
  ingress:
    - from:
        - podSelector: {}    2
          namespaceSelector: 3
            matchLabels:
              kubernetes.io/metadata.name: openshift-console
        - podSelector: {}
          namespaceSelector:
            matchLabels:
              kubernetes.io/metadata.name: openshift-monitoring
  policyTypes:
    - Ingress
status: {}
- 1
- A selector that describes the pods to which the policy applies. The policy object can only select pods in the project that defines the
NetworkPolicyobject. In this documentation, it would be the project in which the Network Observability Operator is installed, which is thenetobservproject. - 2
- A selector that matches the pods from which the policy object allows ingress traffic. The default is that the selector matches pods in the same namespace as the
NetworkPolicy. - 3
- When the
namespaceSelectoris specified, the selector matches pods in the specified namespace.
Additional resources
Chapter 7. Observing the network traffic
As an administrator, you can observe the network traffic in the OpenShift Container Platform console for detailed troubleshooting and analysis. This feature helps you get insights from different graphical representations of traffic flow. There are several available views to observe the network traffic.
7.1. Observing the network traffic from the Overview view
The Overview view displays the overall aggregated metrics of the network traffic flow on the cluster. As an administrator, you can monitor the statistics with the available display options.
7.1.1. Working with the Overview view
As an administrator, you can navigate to the Overview view to see the graphical representation of the flow rate statistics.
Procedure
- Navigate to Observe → Network Traffic.
- In the Network Traffic page, click the Overview tab.
You can configure the scope of each flow rate data by clicking the menu icon.
7.1.2. Configuring advanced options for the Overview view
You can customize the graphical view by using advanced options. To access the advanced options, click Show advanced options. You can configure the details in the graph by using the Display options drop-down menu. The options available are as follows:
- Scope: Select to view the components that network traffic flows between. You can set the scope to Node, Namespace, Owner, Zones, Cluster or Resource. Owner is an aggregation of resources. Resource can be a pod, service, node, in case of host-network traffic, or an unknown IP address. The default value is Namespace.
- Truncate labels: Select the required width of the label from the drop-down list. The default value is M.
7.1.2.1. Managing panels and display
You can select the required panels to be displayed, reorder them, and focus on a specific panel. To add or remove panels, click Manage panels.
The following panels are shown by default:
- Top X average bytes rates
- Top X bytes rates stacked with total
Other panels can be added in Manage panels:
- Top X average packets rates
- Top X packets rates stacked with total
Query options allows you to choose whether to show the Top 5, Top 10, or Top 15 rates.
7.1.3. Packet drop tracking
You can configure graphical representation of network flow records with packet loss in the Overview view. By employing eBPF tracepoint hooks, you can gain valuable insights into packet drops for TCP, UDP, SCTP, ICMPv4, and ICMPv6 protocols, which can result in the following actions:
- Identification: Pinpoint the exact locations and network paths where packet drops are occurring. Determine whether specific devices, interfaces, or routes are more prone to drops.
- Root cause analysis: Examine the data collected by the eBPF program to understand the causes of packet drops. For example, are they a result of congestion, buffer issues, or specific network events?
- Performance optimization: With a clearer picture of packet drops, you can take steps to optimize network performance, such as adjust buffer sizes, reconfigure routing paths, or implement Quality of Service (QoS) measures.
When packet drop tracking is enabled, you can see the following panels in the Overview by default:
- Top X packet dropped state stacked with total
- Top X packet dropped cause stacked with total
- Top X average dropped packets rates
- Top X dropped packets rates stacked with total
Other packet drop panels are available to add in Manage panels:
- Top X average dropped bytes rates
- Top X dropped bytes rates stacked with total
7.1.3.1. Types of packet drops
Two kinds of packet drops are detected by Network Observability: host drops and OVS drops. Host drops are prefixed with SKB_DROP and OVS drops are prefixed with OVS_DROP. Dropped flows are shown in the side panel of the Traffic flows table along with a link to a description of each drop type. Examples of host drop reasons are as follows:
-
SKB_DROP_REASON_NO_SOCKET: the packet dropped due to a missing socket. -
SKB_DROP_REASON_TCP_CSUM: the packet dropped due to a TCP checksum error.
Examples of OVS drops reasons are as follows:
-
OVS_DROP_LAST_ACTION: OVS packets dropped due to an implicit drop action, for example due to a configured network policy. -
OVS_DROP_IP_TTL: OVS packets dropped due to an expired IP TTL.
See the Additional Resources of this section for more information about enabling and working with packet drop tracking.
Additional resources
7.1.4. DNS tracking
You can configure graphical representation of Domain Name System (DNS) tracking of network flows in the Overview view. Using DNS tracking with extended Berkeley Packet Filter (eBPF) tracepoint hooks can serve various purposes:
- Network Monitoring: Gain insights into DNS queries and responses, helping network administrators identify unusual patterns, potential bottlenecks, or performance issues.
- Security Analysis: Detect suspicious DNS activities, such as domain name generation algorithms (DGA) used by malware, or identify unauthorized DNS resolutions that might indicate a security breach.
- Troubleshooting: Debug DNS-related issues by tracing DNS resolution steps, tracking latency, and identifying misconfigurations.
By default, when DNS tracking is enabled, you can see the following non-empty metrics represented in a donut or line chart in the Overview:
- Top X DNS Response Code
- Top X average DNS latencies with overall
- Top X 90th percentile DNS latencies
Other DNS tracking panels can be added in Manage panels:
- Bottom X minimum DNS latencies
- Top X maximum DNS latencies
- Top X 99th percentile DNS latencies
This feature is supported for IPv4 and IPv6 UDP and TCP protocols.
See the Additional Resources in this section for more information about enabling and working with this view.
Additional resources
7.1.5. Round-Trip Time
You can use TCP handshake Round-Trip Time (RTT) to analyze network flows. You can use RTT captured from the fentry/tcp_rcv_established eBPF hookpoint to read SRTT from the TCP socket to help with the following:
- Network Monitoring: Gain insights into TCP handshakes, helping network administrators identify unusual patterns, potential bottlenecks, or performance issues.
- Troubleshooting: Debug TCP-related issues by tracking latency and identifying misconfigurations.
By default, when RTT is enabled, you can see the following TCP handshake RTT metrics represented in the Overview:
- Top X 90th percentile TCP handshake Round Trip Time with overall
- Top X average TCP handshake Round Trip Time with overall
- Bottom X minimum TCP handshake Round Trip Time with overall
Other RTT panels can be added in Manage panels:
- Top X maximum TCP handshake Round Trip Time with overall
- Top X 99th percentile TCP handshake Round Trip Time with overall
See the Additional Resources in this section for more information about enabling and working with this view.
Additional resources
7.2. Observing the network traffic from the Traffic flows view
The Traffic flows view displays the data of the network flows and the amount of traffic in a table. As an administrator, you can monitor the amount of traffic across the application by using the traffic flow table.
7.2.1. Working with the Traffic flows view
As an administrator, you can navigate to Traffic flows table to see network flow information.
Procedure
- Navigate to Observe → Network Traffic.
- In the Network Traffic page, click the Traffic flows tab.
You can click on each row to get the corresponding flow information.
7.2.2. Configuring advanced options for the Traffic flows view
You can customize and export the view by using Show advanced options. You can set the row size by using the Display options drop-down menu. The default value is Normal.
7.2.2.1. Managing columns
You can select the required columns to be displayed, and reorder them. To manage columns, click Manage columns.
7.2.2.2. Exporting the traffic flow data
You can export data from the Traffic flows view.
Procedure
- Click Export data.
- In the pop-up window, you can select the Export all data checkbox to export all the data, and clear the checkbox to select the required fields to be exported.
- Click Export.
7.2.3. Working with conversation tracking
As an administrator, you can group network flows that are part of the same conversation. A conversation is defined as a grouping of peers that are identified by their IP addresses, ports, and protocols, resulting in an unique Conversation Id. You can query conversation events in the web console. These events are represented in the web console as follows:
- Conversation start: This event happens when a connection is starting or TCP flag intercepted
-
Conversation tick: This event happens at each specified interval defined in the
FlowCollectorspec.processor.conversationHeartbeatIntervalparameter while the connection is active. -
Conversation end: This event happens when the
FlowCollectorspec.processor.conversationEndTimeoutparameter is reached or the TCP flag is intercepted. - Flow: This is the network traffic flow that occurs within the specified interval.
Procedure
- In the web console, navigate to Operators → Installed Operators.
- Under the Provided APIs heading for the NetObserv Operator, select Flow Collector.
- Select cluster then select the YAML tab.
Configure the
FlowCollectorcustom resource so thatspec.processor.logTypes,conversationEndTimeout, andconversationHeartbeatIntervalparameters are set according to your observation needs. A sample configuration is as follows:Configure
FlowCollectorfor conversation trackingapiVersion: flows.netobserv.io/v1beta2 kind: FlowCollector metadata: name: cluster spec: processor: logTypes: Flows 1 advanced: conversationEndTimeout: 10s 2 conversationHeartbeatInterval: 30s 3
- 1
- When
logTypesis set toFlows, only the Flow event is exported. If you set the value toAll, both conversation and flow events are exported and visible in the Network Traffic page. To focus only on conversation events, you can specifyConversationswhich exports the Conversation start, Conversation tick and Conversation end events; orEndedConversationsexports only the Conversation end events. Storage requirements are highest forAlland lowest forEndedConversations. - 2
- The Conversation end event represents the point when the
conversationEndTimeoutis reached or the TCP flag is intercepted. - 3
- The Conversation tick event represents each specified interval defined in the
FlowCollectorconversationHeartbeatIntervalparameter while the network connection is active.
NoteIf you update the
logTypeoption, the flows from the previous selection do not clear from the console plugin. For example, if you initially setlogTypetoConversationsfor a span of time until 10 AM and then move toEndedConversations, the console plugin shows all conversation events before 10 AM and only ended conversations after 10 AM.-
Refresh the Network Traffic page on the Traffic flows tab. Notice there are two new columns, Event/Type and Conversation Id. All the Event/Type fields are
Flowwhen Flow is the selected query option. - Select Query Options and choose the Log Type, Conversation. Now the Event/Type shows all of the desired conversation events.
- Next you can filter on a specific conversation ID or switch between the Conversation and Flow log type options from the side panel.
7.2.4. Working with packet drops
Packet loss occurs when one or more packets of network flow data fail to reach their destination. You can track these drops by editing the FlowCollector to the specifications in the following YAML example.
CPU and memory usage increases when this feature is enabled.
Procedure
- In the web console, navigate to Operators → Installed Operators.
- Under the Provided APIs heading for the NetObserv Operator, select Flow Collector.
- Select cluster, and then select the YAML tab.
Configure the
FlowCollectorcustom resource for packet drops, for example:Example
FlowCollectorconfigurationapiVersion: flows.netobserv.io/v1beta2 kind: FlowCollector metadata: name: cluster spec: namespace: netobserv deploymentModel: Direct agent: type: eBPF ebpf: features: - PacketDrop 1 privileged: true 2
Verification
When you refresh the Network Traffic page, the Overview, Traffic Flow, and Topology views display new information about packet drops:
- Select new choices in Manage panels to choose which graphical visualizations of packet drops to display in the Overview.
Select new choices in Manage columns to choose which packet drop information to display in the Traffic flows table.
-
In the Traffic Flows view, you can also expand the side panel to view more information about packet drops. Host drops are prefixed with
SKB_DROPand OVS drops are prefixed withOVS_DROP.
-
In the Traffic Flows view, you can also expand the side panel to view more information about packet drops. Host drops are prefixed with
- In the Topology view, red lines are displayed where drops are present.
7.2.5. Working with DNS tracking
Using DNS tracking, you can monitor your network, conduct security analysis, and troubleshoot DNS issues. You can track DNS by editing the FlowCollector to the specifications in the following YAML example.
CPU and memory usage increases are observed in the eBPF agent when this feature is enabled.
Procedure
- In the web console, navigate to Operators → Installed Operators.
- Under the Provided APIs heading for Network Observability, select Flow Collector.
- Select cluster then select the YAML tab.
Configure the
FlowCollectorcustom resource. A sample configuration is as follows:Configure
FlowCollectorfor DNS trackingapiVersion: flows.netobserv.io/v1beta2 kind: FlowCollector metadata: name: cluster spec: namespace: netobserv deploymentModel: Direct agent: type: eBPF ebpf: features: - DNSTracking 1 sampling: 1 2When you refresh the Network Traffic page, there are new DNS representations you can choose to view in the Overview and Traffic Flow views and new filters you can apply.
- Select new DNS choices in Manage panels to display graphical visualizations and DNS metrics in the Overview.
- Select new choices in Manage columns to add DNS columns to the Traffic Flows view.
- Filter on specific DNS metrics, such as DNS Id, DNS Error DNS Latency and DNS Response Code, and see more information from the side panel. The DNS Latency and DNS Response Code columns are shown by default.
TCP handshake packets do not have DNS headers. TCP protocol flows without DNS headers are shown in the traffic flow data with DNS Latency, ID, and Response code values of "n/a". You can filter out flow data to view only flows that have DNS headers using the Common filter "DNSError" equal to "0".
7.2.6. Working with RTT tracing
You can track RTT by editing the FlowCollector to the specifications in the following YAML example.
Procedure
- In the web console, navigate to Operators → Installed Operators.
- In the Provided APIs heading for the NetObserv Operator, select Flow Collector.
- Select cluster, and then select the YAML tab.
Configure the
FlowCollectorcustom resource for RTT tracing, for example:Example
FlowCollectorconfigurationapiVersion: flows.netobserv.io/v1beta2 kind: FlowCollector metadata: name: cluster spec: namespace: netobserv deploymentModel: Direct agent: type: eBPF ebpf: features: - FlowRTT 1- 1
- You can start tracing RTT network flows by listing the
FlowRTTparameter in thespec.agent.ebpf.featuresspecification list.
Verification
When you refresh the Network Traffic page, the Overview, Traffic Flow, and Topology views display new information about RTT:
- In the Overview, select new choices in Manage panels to choose which graphical visualizations of RTT to display.
- In the Traffic flows table, the Flow RTT column can be seen, and you can manage display in Manage columns.
In the Traffic Flows view, you can also expand the side panel to view more information about RTT.
Example filtering
- Click the Common filters → Protocol.
- Filter the network flow data based on TCP, Ingress direction, and look for FlowRTT values greater than 10,000,000 nanoseconds (10ms).
- Remove the Protocol filter.
- Filter for Flow RTT values greater than 0 in the Common filters.
- In the Topology view, click the Display option dropdown. Then click RTT in the edge labels drop-down list.
7.2.6.1. Using the histogram
You can click Show histogram to display a toolbar view for visualizing the history of flows as a bar chart. The histogram shows the number of logs over time. You can select a part of the histogram to filter the network flow data in the table that follows the toolbar.
7.2.7. Working with availability zones
You can configure the FlowCollector to collect information about the cluster availability zones. This allows you to enrich network flow data with the topology.kubernetes.io/zone label value applied to the nodes.
Procedure
- In the web console, go to Operators → Installed Operators.
- Under the Provided APIs heading for the NetObserv Operator, select Flow Collector.
- Select cluster then select the YAML tab.
Configure the
FlowCollectorcustom resource so that thespec.processor.addZoneparameter is set totrue. A sample configuration is as follows:Configure
FlowCollectorfor availability zones collectionapiVersion: flows.netobserv.io/v1beta2 kind: FlowCollector metadata: name: cluster spec: # ... processor: addZone: true # ...
Verification
When you refresh the Network Traffic page, the Overview, Traffic Flow, and Topology views display new information about availability zones:
- In the Overview tab, you can see Zones as an available Scope.
- In Network Traffic → Traffic flows, Zones are viewable under the SrcK8S_Zone and DstK8S_Zone fields.
- In the Topology view, you can set Zones as Scope or Group.
7.3. Observing the network traffic from the Topology view
The Topology view provides a graphical representation of the network flows and the amount of traffic. As an administrator, you can monitor the traffic data across the application by using the Topology view.
7.3.1. Working with the Topology view
As an administrator, you can navigate to the Topology view to see the details and metrics of the component.
Procedure
- Navigate to Observe → Network Traffic.
- In the Network Traffic page, click the Topology tab.
You can click each component in the Topology to view the details and metrics of the component.
7.3.2. Configuring the advanced options for the Topology view
You can customize and export the view by using Show advanced options. The advanced options view has the following features:
- Find in view: To search the required components in the view.
Display options: To configure the following options:
- Edge labels: To show the specified measurements as edge labels. The default is to show the Average rate in Bytes.
- Scope: To select the scope of components between which the network traffic flows. The default value is Namespace.
- Groups: To enhance the understanding of ownership by grouping the components. The default value is None.
- Layout: To select the layout of the graphical representation. The default value is ColaNoForce.
- Show: To select the details that need to be displayed. All the options are checked by default. The options available are: Edges, Edges label, and Badges.
- Truncate labels: To select the required width of the label from the drop-down list. The default value is M.
- Collapse groups: To expand or collapse the groups. The groups are expanded by default. This option is disabled if Groups has the value of None.
7.3.2.1. Exporting the topology view
To export the view, click Export topology view. The view is downloaded in PNG format.
7.4. Filtering the network traffic
By default, the Network Traffic page displays the traffic flow data in the cluster based on the default filters configured in the FlowCollector instance. You can use the filter options to observe the required data by changing the preset filter.
- Query Options
You can use Query Options to optimize the search results, as listed below:
- Log Type: The available options Conversation and Flows provide the ability to query flows by log type, such as flow log, new conversation, completed conversation, and a heartbeat, which is a periodic record with updates for long conversations. A conversation is an aggregation of flows between the same peers.
-
Duplicated flows: A flow might be reported from several interfaces, and from both source and destination nodes, making it appear in the data several times. By selecting this query option, you can choose to show duplicated flows. Duplicated flows have the same sources and destinations, including ports, and also have the same protocols, with the exception of
InterfaceandDirectionfields. Duplicates are hidden by default. Use the Direction filter in the Common section of the dropdown list to switch between ingress and egress traffic. - Match filters: You can determine the relation between different filter parameters selected in the advanced filter. The available options are Match all and Match any. Match all provides results that match all the values, and Match any provides results that match any of the values entered. The default value is Match all.
Drops filter: You can view different levels of dropped packets with the following query options:
- Fully dropped shows flow records with fully dropped packets.
- Containing drops shows flow records that contain drops but can be sent.
- Without drops shows records that contain sent packets.
- All shows all the aforementioned records.
- Limit: The data limit for internal backend queries. Depending upon the matching and the filter settings, the number of traffic flow data is displayed within the specified limit.
- Quick filters
-
The default values in Quick filters drop-down menu are defined in the
FlowCollectorconfiguration. You can modify the options from console. - Advanced filters
- You can set the advanced filters, Common, Source, or Destination, by selecting the parameter to be filtered from the dropdown list. The flow data is filtered based on the selection. To enable or disable the applied filter, you can click on the applied filter listed below the filter options.
You can toggle between
![]() One way and
One way and
![]()
![]() Back and forth filtering. The
Back and forth filtering. The
![]() One way filter shows only Source and Destination traffic according to your filter selections. You can use Swap to change the directional view of the Source and Destination traffic. The
One way filter shows only Source and Destination traffic according to your filter selections. You can use Swap to change the directional view of the Source and Destination traffic. The
![]()
![]() Back and forth filter includes return traffic with the Source and Destination filters. The directional flow of network traffic is shown in the Direction column in the Traffic flows table as
Back and forth filter includes return traffic with the Source and Destination filters. The directional flow of network traffic is shown in the Direction column in the Traffic flows table as Ingress`or `Egress for inter-node traffic and `Inner`for traffic inside a single node.
You can click Reset defaults to remove the existing filters, and apply the filter defined in FlowCollector configuration.
To understand the rules of specifying the text value, click Learn More.
Alternatively, you can access the traffic flow data in the Network Traffic tab of the Namespaces, Services, Routes, Nodes, and Workloads pages which provide the filtered data of the corresponding aggregations.
Additional resources
For more information about configuring quick filters in the FlowCollector, see Configuring Quick Filters and the Flow Collector sample resource.
Chapter 8. Using metrics with dashboards and alerts
The Network Observability Operator uses the flowlogs-pipeline to generate metrics from flow logs. You can utilize these metrics by setting custom alerts and viewing dashboards.
8.1. Viewing Network Observability metrics dashboards
On the Overview tab in the OpenShift Container Platform console, you can view the overall aggregated metrics of the network traffic flow on the cluster. You can choose to display the information by node, namespace, owner, pod, and service. You can also use filters and display options to further refine the metrics.
Procedure
- In the web console Observe → Dashboards, select the Netobserv dashboard.
View network traffic metrics in the following categories, with each having the subset per node, namespace, source, and destination:
- Byte rates
- Packet drops
- DNS
- RTT
- Select the Netobserv/Health dashboard.
View metrics about the health of the Operator in the following categories, with each having the subset per node, namespace, source, and destination.
- Flows
- Flows Overhead
- Flow rates
- Agents
- Processor
- Operator
Infrastructure and Application metrics are shown in a split-view for namespace and workloads.
8.2. Network Observability metrics
Metrics generated by the flowlogs-pipeline are configurable in the spec.processor.metrics.includeList of the FlowCollector custom resource to add or remove metrics.
You can also create alerts by using the includeList metrics in Prometheus rules, as shown in the example "Creating alerts".
When looking for these metrics in Prometheus, such as in the Console through Observe → Metrics, or when defining alerts, all the metrics names are prefixed with `netobserv_. For example, `netobserv_namespace_flows_total. Available metrics names are as follows.
8.2.1. includeList metrics names
Names followed by an asterisk * are enabled by default.
-
namespace_egress_bytes_total -
namespace_egress_packets_total -
namespace_ingress_bytes_total -
namespace_ingress_packets_total -
namespace_flows_total* -
node_egress_bytes_total -
node_egress_packets_total -
node_ingress_bytes_total* -
node_ingress_packets_total -
node_flows_total -
workload_egress_bytes_total -
workload_egress_packets_total -
workload_ingress_bytes_total* -
workload_ingress_packets_total -
workload_flows_total
8.2.1.1. PacketDrop metrics names
When the PacketDrop feature is enabled in spec.agent.ebpf.features (with privileged mode), the following additional metrics are available:
-
namespace_drop_bytes_total -
namespace_drop_packets_total* -
node_drop_bytes_total -
node_drop_packets_total -
workload_drop_bytes_total -
workload_drop_packets_total
8.2.1.2. DNS metrics names
When the DNSTracking feature is enabled in spec.agent.ebpf.features, the following additional metrics are available:
-
namespace_dns_latency_seconds* -
node_dns_latency_seconds -
workload_dns_latency_seconds
8.2.1.3. FlowRTT metrics names
When the FlowRTT feature is enabled in spec.agent.ebpf.features, the following additional metrics are available:
-
namespace_rtt_seconds* -
node_rtt_seconds -
workload_rtt_seconds
8.3. Creating alerts
You can create custom alerting rules for the Netobserv dashboard metrics to trigger alerts when some defined conditions are met.
Prerequisites
- You have access to the cluster as a user with the cluster-admin role or with view permissions for all projects.
- You have the Network Observability Operator installed.
Procedure
- Create a YAML file by clicking the import icon, +.
Add an alerting rule configuration to the YAML file. In the YAML sample that follows, an alert is created for when the cluster ingress traffic reaches a given threshold of 10 MBps per destination workload.
apiVersion: monitoring.openshift.io/v1 kind: AlertingRule metadata: name: netobserv-alerts namespace: openshift-monitoring spec: groups: - name: NetObservAlerts rules: - alert: NetObservIncomingBandwidth annotations: message: |- {{ $labels.job }}: incoming traffic exceeding 10 MBps for 30s on {{ $labels.DstK8S_OwnerType }} {{ $labels.DstK8S_OwnerName }} ({{ $labels.DstK8S_Namespace }}). summary: "High incoming traffic." expr: sum(rate(netobserv_workload_ingress_bytes_total {SrcK8S_Namespace="openshift-ingress"}[1m])) by (job, DstK8S_Namespace, DstK8S_OwnerName, DstK8S_OwnerType) > 10000000 1 for: 30s labels: severity: warning- 1
- The
netobserv_workload_ingress_bytes_totalmetric is enabled by default inspec.processor.metrics.includeList.
- Click Create to apply the configuration file to the cluster.
Additional resources
- For more information about creating alerts that you can see on the dashboard, see Creating alerting rules for user-defined projects.
Chapter 9. Monitoring the Network Observability Operator
You can use the web console to monitor alerts related to the health of the Network Observability Operator.
9.1. Viewing health information
You can access metrics about health and resource usage of the Network Observability Operator from the Dashboards page in the web console. A health alert banner that directs you to the dashboard can appear on the Network Traffic and Home pages in the event that an alert is triggered. Alerts are generated in the following cases:
-
The
NetObservLokiErroralert occurs if theflowlogs-pipelineworkload is dropping flows because of Loki errors, such as if the Loki ingestion rate limit has been reached. -
The
NetObservNoFlowsalert occurs if no flows are ingested for a certain amount of time.
You can also view metrics about the health of the Operator in the following categories:
- Flows
- Flows Overhead
- Top flow rates per source and destination nodes
- Top flow rates per source and destination namespaces
- Top flow rates per source and destination workloads
- Agents
- Processor
- Operator
Prerequisites
- You have the Network Observability Operator installed.
-
You have access to the cluster as a user with the
cluster-adminrole or with view permissions for all projects.
Procedure
- From the Administrator perspective in the web console, navigate to Observe → Dashboards.
- From the Dashboards dropdown, select Netobserv/Health.
- View the metrics about the health of the Operator that are displayed on the page.
9.1.1. Disabling health alerts
You can opt out of health alerting by editing the FlowCollector resource:
- In the web console, navigate to Operators → Installed Operators.
- Under the Provided APIs heading for the NetObserv Operator, select Flow Collector.
- Select cluster then select the YAML tab.
Add
spec.processor.metrics.disableAlertsto disable health alerts, as in the following YAML sample:apiVersion: flows.netobserv.io/v1beta2 kind: FlowCollector metadata: name: cluster spec: processor: metrics: disableAlerts: [NetObservLokiError, NetObservNoFlows] 1- 1
- You can specify one or a list with both types of alerts to disable.
9.2. Creating Loki rate limit alerts for the NetObserv dashboard
You can create custom alerting rules for the Netobserv dashboard metrics to trigger alerts when Loki rate limits have been reached.
Prerequisites
- You have access to the cluster as a user with the cluster-admin role or with view permissions for all projects.
- You have the Network Observability Operator installed.
Procedure
- Create a YAML file by clicking the import icon, +.
Add an alerting rule configuration to the YAML file. In the YAML sample that follows, an alert is created for when Loki rate limits have been reached:
apiVersion: monitoring.openshift.io/v1 kind: AlertingRule metadata: name: loki-alerts namespace: openshift-monitoring spec: groups: - name: LokiRateLimitAlerts rules: - alert: LokiTenantRateLimit annotations: message: |- {{ $labels.job }} {{ $labels.route }} is experiencing 429 errors. summary: "At any number of requests are responded with the rate limit error code." expr: sum(irate(loki_request_duration_seconds_count{status_code="429"}[1m])) by (job, namespace, route) / sum(irate(loki_request_duration_seconds_count[1m])) by (job, namespace, route) * 100 > 0 for: 10s labels: severity: warning- Click Create to apply the configuration file to the cluster.
Additional resources
- For more information about creating alerts that you can see on the dashboard, see Creating alerting rules for user-defined projects.
Chapter 10. FlowCollector configuration parameters
FlowCollector is the Schema for the network flows collection API, which pilots and configures the underlying deployments.
10.1. FlowCollector API specifications
- Description
-
FlowCollectoris the schema for the network flows collection API, which pilots and configures the underlying deployments. - Type
-
object
| Property | Type | Description |
|---|---|---|
|
|
| APIVersion defines the versioned schema of this representation of an object. Servers should convert recognized schemas to the latest internal value, and might reject unrecognized values. More info: https://git.k8s.io/community/contributors/devel/sig-architecture/api-conventions.md#resources |
|
|
| Kind is a string value representing the REST resource this object represents. Servers might infer this from the endpoint the client submits requests to. Cannot be updated. In CamelCase. More info: https://git.k8s.io/community/contributors/devel/sig-architecture/api-conventions.md#types-kinds |
|
|
| Standard object’s metadata. More info: https://git.k8s.io/community/contributors/devel/sig-architecture/api-conventions.md#metadata |
|
|
|
Defines the desired state of the FlowCollector resource. |
10.1.1. .metadata
- Description
- Standard object’s metadata. More info: https://git.k8s.io/community/contributors/devel/sig-architecture/api-conventions.md#metadata
- Type
-
object
10.1.2. .spec
- Description
-
Defines the desired state of the FlowCollector resource.
*: the mention of "unsupported", or "deprecated" for a feature throughout this document means that this feature is not officially supported by Red Hat. It might have been, for example, contributed by the community and accepted without a formal agreement for maintenance. The product maintainers might provide some support for these features as a best effort only. - Type
-
object
| Property | Type | Description |
|---|---|---|
|
|
| Agent configuration for flows extraction. |
|
|
|
|
|
|
|
|
|
|
|
|
|
|
|
Kafka configuration, allowing to use Kafka as a broker as part of the flow collection pipeline. Available when the |
|
|
|
|
|
|
| Namespace where Network Observability pods are deployed. |
|
|
|
|
10.1.3. .spec.agent
- Description
- Agent configuration for flows extraction.
- Type
-
object
| Property | Type | Description |
|---|---|---|
|
|
|
|
|
|
|
|
|
|
|
|
10.1.4. .spec.agent.ebpf
- Description
-
ebpfdescribes the settings related to the eBPF-based flow reporter whenspec.agent.typeis set toeBPF. - Type
-
object
| Property | Type | Description |
|---|---|---|
|
|
|
|
|
|
|
|
|
|
|
|
|
|
|
|
|
|
|
List of additional features to enable. They are all disabled by default. Enabling additional features might have performance impacts. Possible values are: |
|
|
|
|
|
|
|
|
|
|
|
|
|
|
|
|
|
|
|
Privileged mode for the eBPF Agent container. When ignored or set to |
|
|
|
|
|
|
| Sampling rate of the flow reporter. 100 means one flow on 100 is sent. 0 or 1 means all flows are sampled. |
10.1.5. .spec.agent.ebpf.advanced
- Description
-
advancedallows setting some aspects of the internal configuration of the eBPF agent. This section is aimed mostly for debugging and fine-grained performance optimizations, such asGOGCandGOMAXPROCSenv vars. Set these values at your own risk. - Type
-
object
| Property | Type | Description |
|---|---|---|
|
|
|
|
10.1.6. .spec.agent.ebpf.resources
- Description
-
resourcesare the compute resources required by this container. More info: https://kubernetes.io/docs/concepts/configuration/manage-resources-containers/ - Type
-
object
| Property | Type | Description |
|---|---|---|
|
|
| Limits describes the maximum amount of compute resources allowed. More info: https://kubernetes.io/docs/concepts/configuration/manage-resources-containers/ |
|
|
| Requests describes the minimum amount of compute resources required. If Requests is omitted for a container, it defaults to Limits if that is explicitly specified, otherwise to an implementation-defined value. Requests cannot exceed Limits. More info: https://kubernetes.io/docs/concepts/configuration/manage-resources-containers/ |
10.1.7. .spec.agent.ipfix
- Description
-
ipfix[deprecated (*)] - describes the settings related to the IPFIX-based flow reporter whenspec.agent.typeis set toIPFIX. - Type
-
object
| Property | Type | Description |
|---|---|---|
|
|
|
|
|
|
|
|
|
|
|
|
|
|
|
|
|
|
|
|
|
|
|
|
10.1.8. .spec.agent.ipfix.clusterNetworkOperator
- Description
-
clusterNetworkOperatordefines the settings related to the OpenShift Container Platform Cluster Network Operator, when available. - Type
-
object
| Property | Type | Description |
|---|---|---|
|
|
| Namespace where the config map is going to be deployed. |
10.1.9. .spec.agent.ipfix.ovnKubernetes
- Description
-
ovnKubernetesdefines the settings of the OVN-Kubernetes CNI, when available. This configuration is used when using OVN’s IPFIX exports, without OpenShift Container Platform. When using OpenShift Container Platform, refer to theclusterNetworkOperatorproperty instead. - Type
-
object
| Property | Type | Description |
|---|---|---|
|
|
|
|
|
|
|
|
|
|
| Namespace where OVN-Kubernetes pods are deployed. |
10.1.10. .spec.consolePlugin
- Description
-
consolePlugindefines the settings related to the OpenShift Container Platform Console plugin, when available. - Type
-
object
| Property | Type | Description |
|---|---|---|
|
|
|
|
|
|
|
|
|
|
|
Enables the console plugin deployment. |
|
|
|
|
|
|
|
|
|
|
|
|
|
|
|
|
|
|
|
|
|
|
|
|
10.1.11. .spec.consolePlugin.advanced
- Description
-
advancedallows setting some aspects of the internal configuration of the console plugin. This section is aimed mostly for debugging and fine-grained performance optimizations, such asGOGCandGOMAXPROCSenv vars. Set these values at your own risk. - Type
-
object
| Property | Type | Description |
|---|---|---|
|
|
|
|
|
|
|
|
|
|
|
|
|
|
|
|
10.1.12. .spec.consolePlugin.autoscaler
- Description
-
autoscalerspec of a horizontal pod autoscaler to set up for the plugin Deployment. Refer to HorizontalPodAutoscaler documentation (autoscaling/v2). - Type
-
object
10.1.13. .spec.consolePlugin.portNaming
- Description
-
portNamingdefines the configuration of the port-to-service name translation - Type
-
object
| Property | Type | Description |
|---|---|---|
|
|
| Enable the console plugin port-to-service name translation |
|
|
|
|
10.1.14. .spec.consolePlugin.quickFilters
- Description
-
quickFiltersconfigures quick filter presets for the Console plugin - Type
-
array
10.1.15. .spec.consolePlugin.quickFilters[]
- Description
-
QuickFilterdefines preset configuration for Console’s quick filters - Type
-
object - Required
-
filter -
name
-
| Property | Type | Description |
|---|---|---|
|
|
|
|
|
|
|
|
|
|
| Name of the filter, that is displayed in the Console |
10.1.16. .spec.consolePlugin.resources
- Description
-
resources, in terms of compute resources, required by this container. More info: https://kubernetes.io/docs/concepts/configuration/manage-resources-containers/ - Type
-
object
| Property | Type | Description |
|---|---|---|
|
|
| Limits describes the maximum amount of compute resources allowed. More info: https://kubernetes.io/docs/concepts/configuration/manage-resources-containers/ |
|
|
| Requests describes the minimum amount of compute resources required. If Requests is omitted for a container, it defaults to Limits if that is explicitly specified, otherwise to an implementation-defined value. Requests cannot exceed Limits. More info: https://kubernetes.io/docs/concepts/configuration/manage-resources-containers/ |
10.1.17. .spec.exporters
- Description
-
exportersdefine additional optional exporters for custom consumption or storage. - Type
-
array
10.1.18. .spec.exporters[]
- Description
-
FlowCollectorExporterdefines an additional exporter to send enriched flows to. - Type
-
object - Required
-
type
-
| Property | Type | Description |
|---|---|---|
|
|
| IPFIX configuration, such as the IP address and port to send enriched IPFIX flows to. |
|
|
| Kafka configuration, such as the address and topic, to send enriched flows to. |
|
|
|
|
10.1.19. .spec.exporters[].ipfix
- Description
- IPFIX configuration, such as the IP address and port to send enriched IPFIX flows to.
- Type
-
object - Required
-
targetHost -
targetPort
-
| Property | Type | Description |
|---|---|---|
|
|
| Address of the IPFIX external receiver |
|
|
| Port for the IPFIX external receiver |
|
|
|
Transport protocol ( |
10.1.20. .spec.exporters[].kafka
- Description
- Kafka configuration, such as the address and topic, to send enriched flows to.
- Type
-
object - Required
-
address -
topic
-
| Property | Type | Description |
|---|---|---|
|
|
| Address of the Kafka server |
|
|
| SASL authentication configuration. [Unsupported (*)]. |
|
|
| TLS client configuration. When using TLS, verify that the address matches the Kafka port used for TLS, generally 9093. |
|
|
| Kafka topic to use. It must exist. Network Observability does not create it. |
10.1.21. .spec.exporters[].kafka.sasl
- Description
- SASL authentication configuration. [Unsupported (*)].
- Type
-
object
| Property | Type | Description |
|---|---|---|
|
|
| Reference to the secret or config map containing the client ID |
|
|
| Reference to the secret or config map containing the client secret |
|
|
|
Type of SASL authentication to use, or |
10.1.22. .spec.exporters[].kafka.sasl.clientIDReference
- Description
- Reference to the secret or config map containing the client ID
- Type
-
object
| Property | Type | Description |
|---|---|---|
|
|
| File name within the config map or secret |
|
|
| Name of the config map or secret containing the file |
|
|
| Namespace of the config map or secret containing the file. If omitted, the default is to use the same namespace as where Network Observability is deployed. If the namespace is different, the config map or the secret is copied so that it can be mounted as required. |
|
|
| Type for the file reference: "configmap" or "secret" |
10.1.23. .spec.exporters[].kafka.sasl.clientSecretReference
- Description
- Reference to the secret or config map containing the client secret
- Type
-
object
| Property | Type | Description |
|---|---|---|
|
|
| File name within the config map or secret |
|
|
| Name of the config map or secret containing the file |
|
|
| Namespace of the config map or secret containing the file. If omitted, the default is to use the same namespace as where Network Observability is deployed. If the namespace is different, the config map or the secret is copied so that it can be mounted as required. |
|
|
| Type for the file reference: "configmap" or "secret" |
10.1.24. .spec.exporters[].kafka.tls
- Description
- TLS client configuration. When using TLS, verify that the address matches the Kafka port used for TLS, generally 9093.
- Type
-
object
| Property | Type | Description |
|---|---|---|
|
|
|
|
|
|
| Enable TLS |
|
|
|
|
|
|
|
|
10.1.25. .spec.exporters[].kafka.tls.caCert
- Description
-
caCertdefines the reference of the certificate for the Certificate Authority - Type
-
object
| Property | Type | Description |
|---|---|---|
|
|
|
|
|
|
|
|
|
|
| Name of the config map or secret containing certificates |
|
|
| Namespace of the config map or secret containing certificates. If omitted, the default is to use the same namespace as where Network Observability is deployed. If the namespace is different, the config map or the secret is copied so that it can be mounted as required. |
|
|
|
Type for the certificate reference: |
10.1.26. .spec.exporters[].kafka.tls.userCert
- Description
-
userCertdefines the user certificate reference and is used for mTLS (you can ignore it when using one-way TLS) - Type
-
object
| Property | Type | Description |
|---|---|---|
|
|
|
|
|
|
|
|
|
|
| Name of the config map or secret containing certificates |
|
|
| Namespace of the config map or secret containing certificates. If omitted, the default is to use the same namespace as where Network Observability is deployed. If the namespace is different, the config map or the secret is copied so that it can be mounted as required. |
|
|
|
Type for the certificate reference: |
10.1.27. .spec.kafka
- Description
-
Kafka configuration, allowing to use Kafka as a broker as part of the flow collection pipeline. Available when the
spec.deploymentModelisKafka. - Type
-
object - Required
-
address -
topic
-
| Property | Type | Description |
|---|---|---|
|
|
| Address of the Kafka server |
|
|
| SASL authentication configuration. [Unsupported (*)]. |
|
|
| TLS client configuration. When using TLS, verify that the address matches the Kafka port used for TLS, generally 9093. |
|
|
| Kafka topic to use. It must exist. Network Observability does not create it. |
10.1.28. .spec.kafka.sasl
- Description
- SASL authentication configuration. [Unsupported (*)].
- Type
-
object
| Property | Type | Description |
|---|---|---|
|
|
| Reference to the secret or config map containing the client ID |
|
|
| Reference to the secret or config map containing the client secret |
|
|
|
Type of SASL authentication to use, or |
10.1.29. .spec.kafka.sasl.clientIDReference
- Description
- Reference to the secret or config map containing the client ID
- Type
-
object
| Property | Type | Description |
|---|---|---|
|
|
| File name within the config map or secret |
|
|
| Name of the config map or secret containing the file |
|
|
| Namespace of the config map or secret containing the file. If omitted, the default is to use the same namespace as where Network Observability is deployed. If the namespace is different, the config map or the secret is copied so that it can be mounted as required. |
|
|
| Type for the file reference: "configmap" or "secret" |
10.1.30. .spec.kafka.sasl.clientSecretReference
- Description
- Reference to the secret or config map containing the client secret
- Type
-
object
| Property | Type | Description |
|---|---|---|
|
|
| File name within the config map or secret |
|
|
| Name of the config map or secret containing the file |
|
|
| Namespace of the config map or secret containing the file. If omitted, the default is to use the same namespace as where Network Observability is deployed. If the namespace is different, the config map or the secret is copied so that it can be mounted as required. |
|
|
| Type for the file reference: "configmap" or "secret" |
10.1.31. .spec.kafka.tls
- Description
- TLS client configuration. When using TLS, verify that the address matches the Kafka port used for TLS, generally 9093.
- Type
-
object
| Property | Type | Description |
|---|---|---|
|
|
|
|
|
|
| Enable TLS |
|
|
|
|
|
|
|
|
10.1.32. .spec.kafka.tls.caCert
- Description
-
caCertdefines the reference of the certificate for the Certificate Authority - Type
-
object
| Property | Type | Description |
|---|---|---|
|
|
|
|
|
|
|
|
|
|
| Name of the config map or secret containing certificates |
|
|
| Namespace of the config map or secret containing certificates. If omitted, the default is to use the same namespace as where Network Observability is deployed. If the namespace is different, the config map or the secret is copied so that it can be mounted as required. |
|
|
|
Type for the certificate reference: |
10.1.33. .spec.kafka.tls.userCert
- Description
-
userCertdefines the user certificate reference and is used for mTLS (you can ignore it when using one-way TLS) - Type
-
object
| Property | Type | Description |
|---|---|---|
|
|
|
|
|
|
|
|
|
|
| Name of the config map or secret containing certificates |
|
|
| Namespace of the config map or secret containing certificates. If omitted, the default is to use the same namespace as where Network Observability is deployed. If the namespace is different, the config map or the secret is copied so that it can be mounted as required. |
|
|
|
Type for the certificate reference: |
10.1.34. .spec.loki
- Description
-
loki, the flow store, client settings. - Type
-
object
| Property | Type | Description |
|---|---|---|
|
|
|
|
|
|
|
Set |
|
|
|
Loki configuration for |
|
|
|
Loki configuration for |
|
|
|
Loki configuration for |
|
|
|
|
|
|
|
Loki configuration for |
|
|
|
|
|
|
|
|
|
|
|
|
|
|
|
|
10.1.35. .spec.loki.advanced
- Description
-
advancedallows setting some aspects of the internal configuration of the Loki clients. This section is aimed mostly for debugging and fine-grained performance optimizations. - Type
-
object
| Property | Type | Description |
|---|---|---|
|
|
|
|
|
|
|
|
|
|
|
|
|
|
|
|
10.1.36. .spec.loki.lokiStack
- Description
-
Loki configuration for
LokiStackmode. This is useful for an easy loki-operator configuration. It is ignored for other modes. - Type
-
object
| Property | Type | Description |
|---|---|---|
|
|
| Name of an existing LokiStack resource to use. |
|
|
|
Namespace where this |
10.1.37. .spec.loki.manual
- Description
-
Loki configuration for
Manualmode. This is the most flexible configuration. It is ignored for other modes. - Type
-
object
| Property | Type | Description |
|---|---|---|
|
|
|
|
|
|
|
|
|
|
|
|
|
|
| TLS client configuration for Loki status URL. |
|
|
|
|
|
|
|
|
|
|
| TLS client configuration for Loki URL. |
10.1.38. .spec.loki.manual.statusTls
- Description
- TLS client configuration for Loki status URL.
- Type
-
object
| Property | Type | Description |
|---|---|---|
|
|
|
|
|
|
| Enable TLS |
|
|
|
|
|
|
|
|
10.1.39. .spec.loki.manual.statusTls.caCert
- Description
-
caCertdefines the reference of the certificate for the Certificate Authority - Type
-
object
| Property | Type | Description |
|---|---|---|
|
|
|
|
|
|
|
|
|
|
| Name of the config map or secret containing certificates |
|
|
| Namespace of the config map or secret containing certificates. If omitted, the default is to use the same namespace as where Network Observability is deployed. If the namespace is different, the config map or the secret is copied so that it can be mounted as required. |
|
|
|
Type for the certificate reference: |
10.1.40. .spec.loki.manual.statusTls.userCert
- Description
-
userCertdefines the user certificate reference and is used for mTLS (you can ignore it when using one-way TLS) - Type
-
object
| Property | Type | Description |
|---|---|---|
|
|
|
|
|
|
|
|
|
|
| Name of the config map or secret containing certificates |
|
|
| Namespace of the config map or secret containing certificates. If omitted, the default is to use the same namespace as where Network Observability is deployed. If the namespace is different, the config map or the secret is copied so that it can be mounted as required. |
|
|
|
Type for the certificate reference: |
10.1.41. .spec.loki.manual.tls
- Description
- TLS client configuration for Loki URL.
- Type
-
object
| Property | Type | Description |
|---|---|---|
|
|
|
|
|
|
| Enable TLS |
|
|
|
|
|
|
|
|
10.1.42. .spec.loki.manual.tls.caCert
- Description
-
caCertdefines the reference of the certificate for the Certificate Authority - Type
-
object
| Property | Type | Description |
|---|---|---|
|
|
|
|
|
|
|
|
|
|
| Name of the config map or secret containing certificates |
|
|
| Namespace of the config map or secret containing certificates. If omitted, the default is to use the same namespace as where Network Observability is deployed. If the namespace is different, the config map or the secret is copied so that it can be mounted as required. |
|
|
|
Type for the certificate reference: |
10.1.43. .spec.loki.manual.tls.userCert
- Description
-
userCertdefines the user certificate reference and is used for mTLS (you can ignore it when using one-way TLS) - Type
-
object
| Property | Type | Description |
|---|---|---|
|
|
|
|
|
|
|
|
|
|
| Name of the config map or secret containing certificates |
|
|
| Namespace of the config map or secret containing certificates. If omitted, the default is to use the same namespace as where Network Observability is deployed. If the namespace is different, the config map or the secret is copied so that it can be mounted as required. |
|
|
|
Type for the certificate reference: |
10.1.44. .spec.loki.microservices
- Description
-
Loki configuration for
Microservicesmode. Use this option when Loki is installed using the microservices deployment mode (https://grafana.com/docs/loki/latest/fundamentals/architecture/deployment-modes/#microservices-mode). It is ignored for other modes. - Type
-
object
| Property | Type | Description |
|---|---|---|
|
|
|
|
|
|
|
|
|
|
|
|
|
|
| TLS client configuration for Loki URL. |
10.1.45. .spec.loki.microservices.tls
- Description
- TLS client configuration for Loki URL.
- Type
-
object
| Property | Type | Description |
|---|---|---|
|
|
|
|
|
|
| Enable TLS |
|
|
|
|
|
|
|
|
10.1.46. .spec.loki.microservices.tls.caCert
- Description
-
caCertdefines the reference of the certificate for the Certificate Authority - Type
-
object
| Property | Type | Description |
|---|---|---|
|
|
|
|
|
|
|
|
|
|
| Name of the config map or secret containing certificates |
|
|
| Namespace of the config map or secret containing certificates. If omitted, the default is to use the same namespace as where Network Observability is deployed. If the namespace is different, the config map or the secret is copied so that it can be mounted as required. |
|
|
|
Type for the certificate reference: |
10.1.47. .spec.loki.microservices.tls.userCert
- Description
-
userCertdefines the user certificate reference and is used for mTLS (you can ignore it when using one-way TLS) - Type
-
object
| Property | Type | Description |
|---|---|---|
|
|
|
|
|
|
|
|
|
|
| Name of the config map or secret containing certificates |
|
|
| Namespace of the config map or secret containing certificates. If omitted, the default is to use the same namespace as where Network Observability is deployed. If the namespace is different, the config map or the secret is copied so that it can be mounted as required. |
|
|
|
Type for the certificate reference: |
10.1.48. .spec.loki.monolithic
- Description
-
Loki configuration for
Monolithicmode. Use this option when Loki is installed using the monolithic deployment mode (https://grafana.com/docs/loki/latest/fundamentals/architecture/deployment-modes/#monolithic-mode). It is ignored for other modes. - Type
-
object
| Property | Type | Description |
|---|---|---|
|
|
|
|
|
|
| TLS client configuration for Loki URL. |
|
|
|
|
10.1.49. .spec.loki.monolithic.tls
- Description
- TLS client configuration for Loki URL.
- Type
-
object
| Property | Type | Description |
|---|---|---|
|
|
|
|
|
|
| Enable TLS |
|
|
|
|
|
|
|
|
10.1.50. .spec.loki.monolithic.tls.caCert
- Description
-
caCertdefines the reference of the certificate for the Certificate Authority - Type
-
object
| Property | Type | Description |
|---|---|---|
|
|
|
|
|
|
|
|
|
|
| Name of the config map or secret containing certificates |
|
|
| Namespace of the config map or secret containing certificates. If omitted, the default is to use the same namespace as where Network Observability is deployed. If the namespace is different, the config map or the secret is copied so that it can be mounted as required. |
|
|
|
Type for the certificate reference: |
10.1.51. .spec.loki.monolithic.tls.userCert
- Description
-
userCertdefines the user certificate reference and is used for mTLS (you can ignore it when using one-way TLS) - Type
-
object
| Property | Type | Description |
|---|---|---|
|
|
|
|
|
|
|
|
|
|
| Name of the config map or secret containing certificates |
|
|
| Namespace of the config map or secret containing certificates. If omitted, the default is to use the same namespace as where Network Observability is deployed. If the namespace is different, the config map or the secret is copied so that it can be mounted as required. |
|
|
|
Type for the certificate reference: |
10.1.52. .spec.processor
- Description
-
processordefines the settings of the component that receives the flows from the agent, enriches them, generates metrics, and forwards them to the Loki persistence layer and/or any available exporter. - Type
-
object
| Property | Type | Description |
|---|---|---|
|
|
|
|
|
|
|
|
|
|
|
|
|
|
|
|
|
|
|
|
|
|
|
|
|
|
|
|
|
|
|
|
|
|
|
|
|
|
|
|
|
|
|
|
|
|
|
Set |
|
|
|
|
10.1.53. .spec.processor.advanced
- Description
-
advancedallows setting some aspects of the internal configuration of the flow processor. This section is aimed mostly for debugging and fine-grained performance optimizations, such asGOGCandGOMAXPROCSenv vars. Set these values at your own risk. - Type
-
object
| Property | Type | Description |
|---|---|---|
|
|
|
|
|
|
|
|
|
|
|
|
|
|
|
|
|
|
|
|
|
|
|
|
|
|
|
|
|
|
| Port of the flow collector (host port). By convention, some values are forbidden. It must be greater than 1024 and different from 4500, 4789 and 6081. |
|
|
|
|
10.1.54. .spec.processor.kafkaConsumerAutoscaler
- Description
-
kafkaConsumerAutoscaleris the spec of a horizontal pod autoscaler to set up forflowlogs-pipeline-transformer, which consumes Kafka messages. This setting is ignored when Kafka is disabled. Refer to HorizontalPodAutoscaler documentation (autoscaling/v2). - Type
-
object
10.1.55. .spec.processor.metrics
- Description
-
Metricsdefine the processor configuration regarding metrics - Type
-
object
| Property | Type | Description |
|---|---|---|
|
|
|
|
|
|
|
|
|
|
| Metrics server endpoint configuration for Prometheus scraper |
10.1.56. .spec.processor.metrics.server
- Description
- Metrics server endpoint configuration for Prometheus scraper
- Type
-
object
| Property | Type | Description |
|---|---|---|
|
|
| The prometheus HTTP port |
|
|
| TLS configuration. |
10.1.57. .spec.processor.metrics.server.tls
- Description
- TLS configuration.
- Type
-
object
| Property | Type | Description |
|---|---|---|
|
|
|
|
|
|
|
TLS configuration when |
|
|
|
Reference to the CA file when |
|
|
|
Select the type of TLS configuration: |
10.1.58. .spec.processor.metrics.server.tls.provided
- Description
-
TLS configuration when
typeis set toProvided. - Type
-
object
| Property | Type | Description |
|---|---|---|
|
|
|
|
|
|
|
|
|
|
| Name of the config map or secret containing certificates |
|
|
| Namespace of the config map or secret containing certificates. If omitted, the default is to use the same namespace as where Network Observability is deployed. If the namespace is different, the config map or the secret is copied so that it can be mounted as required. |
|
|
|
Type for the certificate reference: |
10.1.59. .spec.processor.metrics.server.tls.providedCaFile
- Description
-
Reference to the CA file when
typeis set toProvided. - Type
-
object
| Property | Type | Description |
|---|---|---|
|
|
| File name within the config map or secret |
|
|
| Name of the config map or secret containing the file |
|
|
| Namespace of the config map or secret containing the file. If omitted, the default is to use the same namespace as where Network Observability is deployed. If the namespace is different, the config map or the secret is copied so that it can be mounted as required. |
|
|
| Type for the file reference: "configmap" or "secret" |
10.1.60. .spec.processor.resources
- Description
-
resourcesare the compute resources required by this container. More info: https://kubernetes.io/docs/concepts/configuration/manage-resources-containers/ - Type
-
object
| Property | Type | Description |
|---|---|---|
|
|
| Limits describes the maximum amount of compute resources allowed. More info: https://kubernetes.io/docs/concepts/configuration/manage-resources-containers/ |
|
|
| Requests describes the minimum amount of compute resources required. If Requests is omitted for a container, it defaults to Limits if that is explicitly specified, otherwise to an implementation-defined value. Requests cannot exceed Limits. More info: https://kubernetes.io/docs/concepts/configuration/manage-resources-containers/ |
Chapter 11. Network flows format reference
These are the specifications for network flows format, used both internally and when exporting flows to Kafka.
11.1. Network Flows format reference
This is the specification of the network flows format. That format is used when a Kafka exporter is configured, for Prometheus metrics labels as well as internally for the Loki store.
The "Filter ID" column shows which related name to use when defining Quick Filters (see spec.consolePlugin.quickFilters in the FlowCollector specification).
The "Loki label" column is useful when querying Loki directly: label fields need to be selected using stream selectors.
| Name | Type | Description | Filter ID | Loki label |
|---|---|---|---|---|
|
| number | Number of bytes | n/a | no |
|
| number | Error number returned from DNS tracker ebpf hook function |
| no |
|
| number | DNS flags for DNS record | n/a | no |
|
| string | Parsed DNS header RCODEs name |
| no |
|
| number | DNS record id |
| no |
|
| number | Time between a DNS request and response, in milliseconds |
| no |
|
| number | Differentiated Services Code Point (DSCP) value |
| no |
|
| string | Destination IP address (ipv4 or ipv6) |
| no |
|
| string | Destination node IP |
| no |
|
| string | Destination node name |
| no |
|
| string | Name of the destination Kubernetes object, such as Pod name, Service name or Node name. |
| no |
|
| string | Destination namespace |
| yes |
|
| string | Name of the destination owner, such as Deployment name, StatefulSet name, etc. |
| yes |
|
| string | Kind of the destination owner, such as Deployment, StatefulSet, etc. |
| no |
|
| string | Kind of the destination Kubernetes object, such as Pod, Service or Node. |
| yes |
|
| string | Destination availability zone |
| yes |
|
| string | Destination MAC address |
| no |
|
| number | Destination port |
| no |
|
| boolean | Indicates if this flow was also captured from another interface on the same host | n/a | yes |
|
| number |
Logical OR combination of unique TCP flags comprised in the flow, as per RFC-9293, with additional custom flags to represent the following per-packet combinations: | n/a | no |
|
| number |
Flow direction from the node observation point. Can be one of: |
| yes |
|
| number | ICMP code |
| no |
|
| number | ICMP type |
| no |
|
| number |
Flow direction from the network interface observation point. Can be one of: | n/a | no |
|
| string | Network interface |
| no |
|
| string | Cluster name or identifier |
| yes |
|
| string | Flow layer: 'app' or 'infra' |
| no |
|
| number | Number of packets | n/a | no |
|
| number | Number of bytes dropped by the kernel | n/a | no |
|
| string | Latest drop cause |
| no |
|
| number | TCP flags on last dropped packet | n/a | no |
|
| string | TCP state on last dropped packet |
| no |
|
| number | Number of packets dropped by the kernel | n/a | no |
|
| number | L4 protocol |
| no |
|
| string | Source IP address (ipv4 or ipv6) |
| no |
|
| string | Source node IP |
| no |
|
| string | Source node name |
| no |
|
| string | Name of the source Kubernetes object, such as Pod name, Service name or Node name. |
| no |
|
| string | Source namespace |
| yes |
|
| string | Name of the source owner, such as Deployment name, StatefulSet name, etc. |
| yes |
|
| string | Kind of the source owner, such as Deployment, StatefulSet, etc. |
| no |
|
| string | Kind of the source Kubernetes object, such as Pod, Service or Node. |
| yes |
|
| string | Source availability zone |
| yes |
|
| string | Source MAC address |
| no |
|
| number | Source port |
| no |
|
| number | End timestamp of this flow, in milliseconds | n/a | no |
|
| number | TCP Smoothed Round Trip Time (SRTT), in nanoseconds |
| no |
|
| number | Start timestamp of this flow, in milliseconds | n/a | no |
|
| number | Timestamp when this flow was received and processed by the flow collector, in seconds | n/a | no |
|
| string | In conversation tracking, the conversation identifier |
| no |
|
| string | Type of record: 'flowLog' for regular flow logs, or 'newConnection', 'heartbeat', 'endConnection' for conversation tracking |
| yes |
Chapter 12. Troubleshooting Network Observability
To assist in troubleshooting Network Observability issues, you can perform some troubleshooting actions.
12.1. Using the must-gather tool
You can use the must-gather tool to collect information about the Network Observability Operator resources and cluster-wide resources, such as pod logs, FlowCollector, and webhook configurations.
Procedure
- Navigate to the directory where you want to store the must-gather data.
Run the following command to collect cluster-wide must-gather resources:
$ oc adm must-gather
 --image-stream=openshift/must-gather \
 --image=quay.io/netobserv/must-gather
12.2. Configuring network traffic menu entry in the OpenShift Container Platform console
Manually configure the network traffic menu entry in the OpenShift Container Platform console when the network traffic menu entry is not listed in Observe menu in the OpenShift Container Platform console.
Prerequisites
- You have installed OpenShift Container Platform version 4.10 or newer.
Procedure
Check if the
spec.consolePlugin.registerfield is set totrueby running the following command:$ oc -n netobserv get flowcollector cluster -o yaml
Example output
apiVersion: flows.netobserv.io/v1alpha1
kind: FlowCollector
metadata:
  name: cluster
spec:
  consolePlugin:
    register: false
Optional: Add the
netobserv-pluginplugin by manually editing the Console Operator config:$ oc edit console.operator.openshift.io cluster
Example output
...
spec:
  plugins:
  - netobserv-plugin
...
Optional: Set the
spec.consolePlugin.registerfield totrueby running the following command:$ oc -n netobserv edit flowcollector cluster -o yaml
Example output
apiVersion: flows.netobserv.io/v1alpha1
kind: FlowCollector
metadata:
  name: cluster
spec:
  consolePlugin:
    register: true
Ensure the status of console pods is
runningby running the following command:$ oc get pods -n openshift-console -l app=console
Restart the console pods by running the following command:
$ oc delete pods -n openshift-console -l app=console
- Clear your browser cache and history.
Check the status of Network Observability plugin pods by running the following command:
$ oc get pods -n netobserv -l app=netobserv-plugin
Example output
NAME                                READY   STATUS    RESTARTS   AGE
netobserv-plugin-68c7bbb9bb-b69q6   1/1     Running   0          21s
Check the logs of the Network Observability plugin pods by running the following command:
$ oc logs -n netobserv -l app=netobserv-plugin
Example output
time="2022-12-13T12:06:49Z" level=info msg="Starting netobserv-console-plugin [build version: , build date: 2022-10-21 15:15] at log level info" module=main
time="2022-12-13T12:06:49Z" level=info msg="listening on https://:9001" module=server
12.3. Flowlogs-Pipeline does not consume network flows after installing Kafka
If you deployed the flow collector first with deploymentModel: KAFKA and then deployed Kafka, the flow collector might not connect correctly to Kafka. Manually restart the flow-pipeline pods where Flowlogs-pipeline does not consume network flows from Kafka.
Procedure
Delete the flow-pipeline pods to restart them by running the following command:
$ oc delete pods -n netobserv -l app=flowlogs-pipeline-transformer
12.4. Failing to see network flows from both br-int and br-ex interfaces
br-ex` and br-int are virtual bridge devices operated at OSI layer 2. The eBPF agent works at the IP and TCP levels, layers 3 and 4 respectively. You can expect that the eBPF agent captures the network traffic passing through br-ex and br-int, when the network traffic is processed by other interfaces such as physical host or virtual pod interfaces. If you restrict the eBPF agent network interfaces to attach only to br-ex and br-int, you do not see any network flow.
Manually remove the part in the interfaces or excludeInterfaces that restricts the network interfaces to br-int and br-ex.
Procedure
Remove the
interfaces: [ 'br-int', 'br-ex' ]field. This allows the agent to fetch information from all the interfaces. Alternatively, you can specify the Layer-3 interface for example,eth0. Run the following command:$ oc edit -n netobserv flowcollector.yaml -o yaml
Example output
apiVersion: flows.netobserv.io/v1alpha1 kind: FlowCollector metadata: name: cluster spec: agent: type: EBPF ebpf: interfaces: [ 'br-int', 'br-ex' ] 1- 1
- Specifies the network interfaces.
12.5. Network Observability controller manager pod runs out of memory
You can increase memory limits for the Network Observability operator by editing the spec.config.resources.limits.memory specification in the Subscription object.
Procedure
- In the web console, navigate to Operators → Installed Operators
- Click Network Observability and then select Subscription.
From the Actions menu, click Edit Subscription.
Alternatively, you can use the CLI to open the YAML configuration for the
Subscriptionobject by running the following command:$ oc edit subscription netobserv-operator -n openshift-netobserv-operator
Edit the
Subscriptionobject to add theconfig.resources.limits.memoryspecification and set the value to account for your memory requirements. See the Additional resources for more information about resource considerations:apiVersion: operators.coreos.com/v1alpha1 kind: Subscription metadata: name: netobserv-operator namespace: openshift-netobserv-operator spec: channel: stable config: resources: limits: memory: 800Mi 1 requests: cpu: 100m memory: 100Mi installPlanApproval: Automatic name: netobserv-operator source: redhat-operators sourceNamespace: openshift-marketplace startingCSV: <network_observability_operator_latest_version> 2
12.6. Running custom queries to Loki
For troubleshooting, can run custom queries to Loki. There are two examples of ways to do this, which you can adapt according to your needs by replacing the <api_token> with your own.
These examples use the netobserv namespace for the Network Observability Operator and Loki deployments. Additionally, the examples assume that the LokiStack is named loki. You can optionally use a different namespace and naming by adapting the examples, specifically the -n netobserv or the loki-gateway URL.
Prerequisites
- Installed Loki Operator for use with Network Observability Operator
Procedure
To get all available labels, run the following:
$ oc exec deployment/netobserv-plugin -n netobserv -- curl -G -s -H 'X-Scope-OrgID:network' -H 'Authorization: Bearer <api_token>' -k https://loki-gateway-http.netobserv.svc:8080/api/logs/v1/network/loki/api/v1/labels | jq
To get all flows from the source namespace,
my-namespace, run the following:$ oc exec deployment/netobserv-plugin -n netobserv -- curl -G -s -H 'X-Scope-OrgID:network' -H 'Authorization: Bearer <api_token>' -k https://loki-gateway-http.netobserv.svc:8080/api/logs/v1/network/loki/api/v1/query --data-urlencode 'query={SrcK8S_Namespace="my-namespace"}' | jq
Additional resources
12.7. Troubleshooting Loki ResourceExhausted error
Loki may return a ResourceExhausted error when network flow data sent by Network Observability exceeds the configured maximum message size. If you are using the Red Hat Loki Operator, this maximum message size is configured to 100 MiB.
Procedure
- Navigate to Operators → Installed Operators, viewing All projects from the Project drop-down menu.
- In the Provided APIs list, select the Network Observability Operator.
Click the Flow Collector then the YAML view tab.
-
If you are using the Loki Operator, check that the
spec.loki.batchSizevalue does not exceed 98 MiB. -
If you are using a Loki installation method that is different from the Red Hat Loki Operator, such as Grafana Loki, verify that the
grpc_server_max_recv_msg_sizeGrafana Loki server setting is higher than theFlowCollectorresourcespec.loki.batchSizevalue. If it is not, you must either increase thegrpc_server_max_recv_msg_sizevalue, or decrease thespec.loki.batchSizevalue so that it is lower than the limit.
-
If you are using the Loki Operator, check that the
- Click Save if you edited the FlowCollector.
12.8. Loki empty ring error
The Loki "empty ring" error results in flows not being stored in Loki and not showing up in the web console. This error might happen in various situations. A single workaround to address them all does not exist. There are some actions you can take to investigate the logs in your Loki pods, and verify that the LokiStack is healthy and ready.
Some of the situations where this error is observed are as follows:
After a
LokiStackis uninstalled and reinstalled in the same namespace, old PVCs are not removed, which can cause this error.-
Action: You can try removing the
LokiStackagain, removing the PVC, then reinstalling theLokiStack.
-
Action: You can try removing the
After a certificate rotation, this error can prevent communication with the
flowlogs-pipelineandconsole-pluginpods.- Action: You can restart the pods to restore the connectivity.
12.9. Resource troubleshooting
12.10. LokiStack rate limit errors
A rate-limit placed on the Loki tenant can result in potential temporary loss of data and a 429 error: Per stream rate limit exceeded (limit:xMB/sec) while attempting to ingest for stream. You might consider having an alert set to notify you of this error. For more information, see "Creating Loki rate limit alerts for the NetObserv dashboard" in the Additional resources of this section.
You can update the LokiStack CRD with the perStreamRateLimit and perStreamRateLimitBurst specifications, as shown in the following procedure.
Procedure
- Navigate to Operators → Installed Operators, viewing All projects from the Project dropdown.
- Look for Loki Operator, and select the LokiStack tab.
Create or edit an existing LokiStack instance using the YAML view to add the
perStreamRateLimitandperStreamRateLimitBurstspecifications:apiVersion: loki.grafana.com/v1 kind: LokiStack metadata: name: loki namespace: netobserv spec: limits: global: ingestion: perStreamRateLimit: 6 1 perStreamRateLimitBurst: 30 2 tenants: mode: openshift-network managementState: Managed- Click Save.
Verification
Once you update the perStreamRateLimit and perStreamRateLimitBurst specifications, the pods in your cluster restart and the 429 rate-limit error no longer occurs.