
电源监控
为 OpenShift Container Platform 配置和使用电源监控
摘要
第 1 章 Red Hat OpenShift 发行注记
电源监控只是一个技术预览功能。技术预览功能不受红帽产品服务等级协议(SLA)支持,且功能可能并不完整。红帽不推荐在生产环境中使用它们。这些技术预览功能可以使用户提早试用新的功能,并有机会在开发阶段提供反馈意见。
有关红帽技术预览功能支持范围的更多信息,请参阅技术预览功能支持范围。
通过对 Red Hat OpenShift 的电源监控,您可以监控工作负载的功耗,并使用关键功耗指标(如 CPU 或 DRAM)在 OpenShift Container Platform 集群中运行的重要的电源命名空间,如 CPU 或 DRAM。
本发行注记介绍了 OpenShift Container Platform 中 Red Hat OpenShift 的电源监控的开发。
有关 Power 监控 Operator 的概述,请参阅关于电源监控。
1.1. 电源监控 0.1 (技术预览)
此发行版本为 Red Hat OpenShift 引进了电源监控的技术预览版本。以下公告可用于电源监控 0.1:
1.1.1. 功能
- 部署和删除 Kepler
- 基于 Intel 的裸机部署的电源使用指标
- 用于绘制电源使用情况的仪表板
第 2 章 电源监控概述
电源监控只是一个技术预览功能。技术预览功能不受红帽产品服务等级协议(SLA)支持,且功能可能并不完整。红帽不推荐在生产环境中使用它们。这些技术预览功能可以使用户提早试用新的功能,并有机会在开发阶段提供反馈意见。
有关红帽技术预览功能支持范围的更多信息,请参阅技术预览功能支持范围。
2.1. 关于电源监控
您可以使用 Red Hat OpenShift 的电源监控来监控电源使用情况,并确定在 OpenShift Container Platform 集群中运行的电源消耗容器。电源监控从各种组件(如 CPU 和 DRAM)收集和导出与能源相关的系统统计信息。它为 Kubernetes pod、命名空间和节点提供精细的功耗数据。
电源监控技术预览仅适用于裸机部署。大多数公共云供应商都不向虚拟机公开内核电源管理子系统。
2.2. 电源监控架构
电源监控由以下主要组件组成:
- Power monitoring Operator
- 对于管理员,Power monitoring Operator 通过简化 OpenShift Container Platform 集群中的 Kepler 的部署和管理来简化对工作负载的功耗的监控。通过添加 Kepler 自定义资源定义 (CRD) 简化了 Power monitoring Operator 的设置和配置。Operator 还管理操作,如升级、删除、配置和重新部署 Kepler。
- Kepler
- Kepler 是电源监控的关键组件。它负责监控 OpenShift Container Platform 中运行的容器的功耗。它生成与节点和容器电源使用相关的指标。
2.3. Kepler 硬件和虚拟化支持
Kepler 是电源监控的关键组件,它通过以下方法之一从节点收集实时功耗数据:
- 内核电源管理子系统(首选)
-
rapl-sysfs: 需要访问/sys/class/powercap/intel-rapl主机文件。 -
rapl-msr: 需要访问/dev/cpu/*/msr主机文件。
-
estimator电源源如果没有访问内核电源上限子系统,Kepler 使用机器学习模型来估算节点上 CPU 的功耗。
警告estimator目前只是实验性的功能,它不被支持,用户不应依赖它。
您可以使用 Power Monitoring / Overview 仪表板来识别节点的电源估算方法。
2.4. 其他资源
第 3 章 为 Red Hat OpenShift 安装电源监控
电源监控只是一个技术预览功能。技术预览功能不受红帽产品服务等级协议(SLA)支持,且功能可能并不完整。红帽不推荐在生产环境中使用它们。这些技术预览功能可以使用户提早试用新的功能,并有机会在开发阶段提供反馈意见。
有关红帽技术预览功能支持范围的更多信息,请参阅技术预览功能支持范围。
您可以通过在 OpenShift Container Platform Web 控制台中部署 Power 监控 Operator 来为 Red Hat OpenShift 安装电源监控。
3.1. 安装 Power 监控 Operator
作为集群管理员,您可以使用 OpenShift Container Platform Web 控制台从 OperatorHub 安装 Power 监控 Operator。
在安装前,您必须删除之前安装的 Power 监控 Operator 版本。
先决条件
- 访问 OpenShift Container Platform web 控制台。
-
以具有
cluster-admin角色的用户身份登录。
流程
- 在 Web 控制台的 Administrator 视角中,进入 Operators → OperatorHub。
-
搜索
power monitoring,点 Power monitoring for Red Hat OpenShift 标题,然后点 Install。 再次点 Install 来安装 Power monitoring Operator。
Red Hat OpenShift 的电源监控现在包括在 OpenShift Container Platform 集群的所有命名空间中。
验证
- 验证 Power monitoring Operator 是否列在 Operators → Installed Operators 中。Status 应变为 Succeeded。
3.2. 部署 Kepler
您可以使用 Power monitoring Operator 创建 Kepler 自定义资源定义 (CRD) 的实例来部署 Kepler。
先决条件
- 访问 OpenShift Container Platform web 控制台。
-
以具有
cluster-admin角色的用户身份登录。 - 已安装 Power monitoring Operator。
流程
- 在 Web 控制台的 Administrator 视角中,进入 Operators → Installed Operators。
- 从 Installed Operators 列表中,点 Power monitoring for Red Hat OpenShift,再进入 Kepler 选项卡。
- 点 Create Kepler。
在 Create Kepler 页面上,确保 Name 设置为
kepler。重要Kepler 实例的名称必须设置为
kepler。Power 监控 Operator 会忽略所有其他实例。- 点 Create 部署 Kepler 和电源监控仪表板。
第 4 章 配置电源监控
电源监控只是一个技术预览功能。技术预览功能不受红帽产品服务等级协议(SLA)支持,且功能可能并不完整。红帽不推荐在生产环境中使用它们。这些技术预览功能可以使用户提早试用新的功能,并有机会在开发阶段提供反馈意见。
有关红帽技术预览功能支持范围的更多信息,请参阅技术预览功能支持范围。
Kepler 资源是一个 Kubernetes 自定义资源定义 (CRD),可让您配置部署并监控 Kepler 资源的状态。
4.1. Kepler 配置
您可以使用 Kepler 资源的 spec 字段配置 Kepler。
确保 Kepler 实例的名称为 kepler。Power 监控 Operator 会忽略所有其他实例。
以下是配置选项列表:
表 4.1. Kepler 配置选项
| Name | Spec | 描述 | default |
|---|---|---|---|
|
|
| 公开 Prometheus 指标的节点上的端口。 |
|
|
|
| 调度 Kepler 导出 pod 的节点。 |
|
|
|
| Kepler 导出器的容限,允许将 pod 调度到具有特定特征的节点。 |
|
带有默认配置的 Kepler 资源示例
apiVersion: kepler.system.sustainable.computing.io/v1alpha1
kind: Kepler
metadata:
  name: kepler
spec:
  exporter:
    deployment:
      port: 9103 1
      nodeSelector:
        kubernetes.io/os: linux 2
      Tolerations: 3
      - key: ""
        operator: "Exists"
        value: ""
        effect: ""
4.2. 监控 Kepler 状态
您可以使用 Kepler 资源的 status 字段监控 Kepler 导出器的状态。
status.exporter 字段包含信息,如下所示:
- 当前运行 Kepler pod 的节点数量
- 运行 Kepler pod 的节点数量
- 代表 Kepler 资源健康状况的条件
这可让您对通过 spec 字段所做的更改进行宝贵见解。
Kepler 资源的状态示例
apiVersion: kepler.system.sustainable.computing.io/v1alpha1
kind: Kepler
metadata:
  name: kepler
status:
 exporter:
   conditions: 1
     - lastTransitionTime: '2024-01-11T11:07:39Z'
       message: Reconcile succeeded
       observedGeneration: 1
       reason: ReconcileSuccess
       status: 'True'
       type: Reconciled
     - lastTransitionTime: '2024-01-11T11:07:39Z'
       message: >-
         Kepler daemonset "kepler-operator/kepler" is deployed to all nodes and
         available; ready 2/2
       observedGeneration: 1
       reason: DaemonSetReady
       status: 'True'
       type: Available
   currentNumberScheduled: 2 2
   desiredNumberScheduled: 2 3
第 5 章 视觉化电源监控指标
电源监控只是一个技术预览功能。技术预览功能不受红帽产品服务等级协议(SLA)支持,且功能可能并不完整。红帽不推荐在生产环境中使用它们。这些技术预览功能可以使用户提早试用新的功能,并有机会在开发阶段提供反馈意见。
有关红帽技术预览功能支持范围的更多信息,请参阅技术预览功能支持范围。
您可以通过访问高级监控仪表板或浏览 Observe 选项卡下的 Metrics 来视觉化 OpenShift Container Platform web 控制台中的电源监控指标。
5.1. 电源监控仪表板概述
电源监控仪表板有两种。它们都提供有关单个集群的功耗指标的不同详情级别:
电源监控/概述仪表板
使用这个仪表板,您可以观察以下信息:
-
CPU 架构及其电源源的聚合视图 (
rapl-sysfs、rapl-msr或 estimateor) 以及这个配置的总节点 - 集群在最后 24 小时内的总能源消耗(以 kilowatt-hour 为单位)
- 在最后 24 小时内,集群中前 10 个命名空间消耗的电源量
- 详细节点信息,如其 CPU 架构和组件电源源
这些功能允许您有效地监控集群的能源消耗,而无需单独调查每个命名空间。
确保 Components Source 栏没有显示 estimator 作为电源源。
图 5.1. 带有 rapl-sysfs 作为组件电源源的详细节点信息表
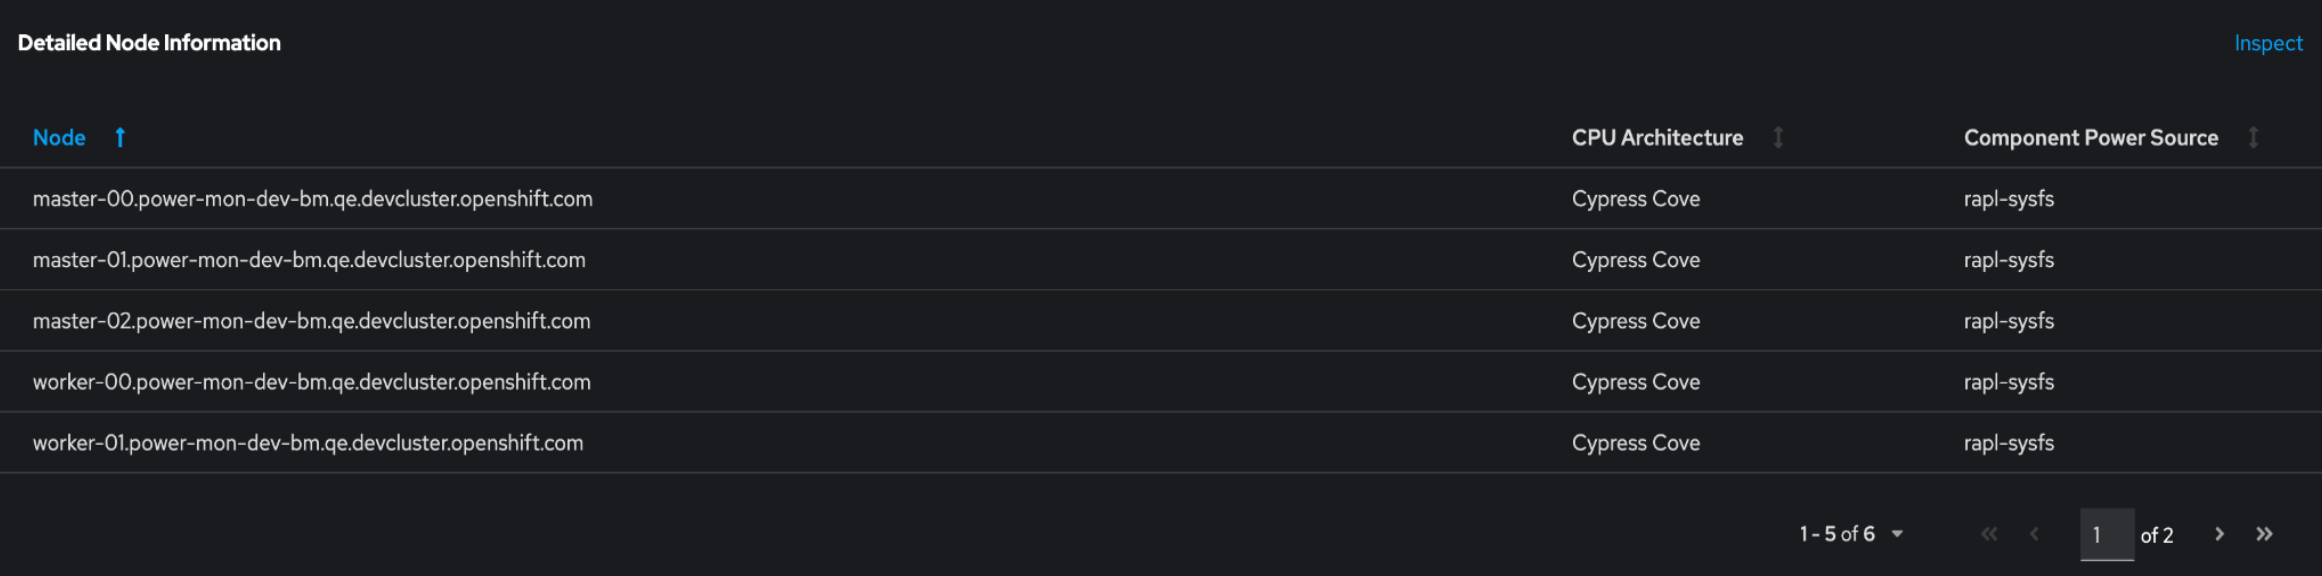
如果 Kepler 无法获取硬件功耗指标,则 Components Source 列会显示 estimator 作为电源源,这在技术预览中不被支持。如果发生这种情况,则节点中的值不准确。
电源监控/命名空间仪表板
此仪表板允许您按命名空间和 pod 查看指标。您可以观察以下信息:
- 功耗指标,如在 DRAM 和 PKG 中的消耗
- 最后一小时中的能源消耗指标,如核心组件和非核心组件的 DRAM 和 PKG 的消耗
此功能允许您调查关键峰值,并轻松识别高消耗的主要根本原因。
5.2. 访问电源监控仪表板
您可以从 OpenShift Container Platform Web 控制台的 Administrator 视角访问高级监控仪表板。
先决条件
- 访问 OpenShift Container Platform web 控制台。
-
以具有
cluster-admin角色的用户身份登录。 - 已安装 Power monitoring Operator。
- 已在集群中部署了 Kepler。
- 您已为用户定义的项目启用了监控。
流程
- 在 web 控制台的 Administrator 视角中,进入 Observe → Dashboards。
在 Dashboard 下拉列表中选择您要查看的电源监控仪表板:
- Power Monitoring / Overview
- Power Monitoring / Namespace
5.3. 电源监控指标概述
Power 监控 Operator 会公开以下指标,您可以使用 Observe → Metrics 标签页下的 OpenShift Container Platform Web 控制台查看这些指标。
此公开指标列表不是确定的。以后的发行版本中可能会添加或删除指标。
表 5.1. Power monitoring Operator 指标
| 指标名称 | 描述 |
|---|---|
|
| 一个容器消耗的、软件包和插槽聚合的 CPU、DRAM 和其他主机组件的能源消耗。 |
|
|
容器使用的 CPU 内核的总能源消耗。如果系统能够访问 |
|
| 一个容器的 DRAM 的总能源消耗。 |
|
| 容器使用的非核心组件所消耗的累积能源消耗。组件数量可能因系统而异。非核心指标特定于处理器模型,可能不适用于某些服务器 CPU。 |
|
| 容器使用的 CPU 插槽所消耗的累积能源。它包含所有核心和非核心组件。 |
|
| 主机组件的累积能源消耗,容器使用的 CPU 和 DRAM 除外。通常,这个指标是 ACPI 主机的能源消耗。 |
|
| 使用 BPF 跟踪的容器使用的总 CPU 时间。 |
|
| 使用硬件计数器的容器使用的总 CPU 周期。CPU 周期是与 CPU 频率直接相关的指标。在处理器以固定频率运行的系统上,CPU 周期和总 CPU 时间大致等同。在处理器运行的系统中,CPU 周期和总 CPU 时间有不同的值。 |
|
| 使用硬件计数器的容器使用的总 CPU 指令。CPU 指令是考虑使用 CPU 的指标。 |
|
| 使用硬件计数器的容器发生的总缓存未命中。 |
|
| 容器从控制组统计读取的总 CPU 时间。 |
|
| 容器从控制组统计读取的总内存(以字节为单位)。 |
|
| 容器从控制组统计读取的内核空间总数。 |
|
| 容器从控制组统计中读取的用户空间的总 CPU 时间。 |
|
| 传送到使用 BPF 跟踪的容器的网卡的数据包总数。 |
|
| 从容器网卡接收的数据包总数,使用 BPF 跟踪。 |
|
| 使用 BPF 跟踪的容器的块 I/O 调用总数。 |
|
| 节点元数据,如节点 CPU 架构。 |
|
| 在节点和操作系统上运行的所有容器使用的 CPU 内核使用的总能源消耗。 |
|
| 由在节点和操作系统上运行的所有容器使用的、非核心组件使用的累积能源消耗。组件数量可能因系统而异。 |
|
| 在节点和操作系统上运行的所有容器的总能源消耗。 |
|
| 由在节点和操作系统上运行的所有容器使用的 CPU 插槽使用的累积能源。它包含所有核心和非核心组件。 |
|
| 主机组件的累积能源消耗,不包括 CPU 和 DRAM,供在节点和操作系统上运行的所有容器使用。通常,这个指标是 ACPI 主机的能源消耗。 |
|
| 主机的总能源消耗。通常,这个指标是 Redfish BMC 或 ACPI 的主机能源消耗。 |
|
| 使用模型服务器中使用的容器资源利用率控制组指标标记的节点有多个指标。 |
|
| 在某个节点上利用 Intel QAT 加速器。如果系统包含 Intel QATs,Kepler 可以通过遥测来计算节点的 QAT 的利用率。 |
5.4. 其他资源
第 6 章 卸载电源监控
电源监控只是一个技术预览功能。技术预览功能不受红帽产品服务等级协议(SLA)支持,且功能可能并不完整。红帽不推荐在生产环境中使用它们。这些技术预览功能可以使用户提早试用新的功能,并有机会在开发阶段提供反馈意见。
有关红帽技术预览功能支持范围的更多信息,请参阅技术预览功能支持范围。
您可以通过删除 Kepler 实例,然后在 OpenShift Container Platform Web 控制台中使用 Power monitoring Operator 来卸载电源监控。
6.1. 删除 Kepler
您可以通过从 OpenShift Container Platform web 控制台删除 Kepler 自定义资源定义 (CRD) 的 Kepler 实例来删除 Kepler 实例。
先决条件
- 访问 OpenShift Container Platform web 控制台。
-
以具有
cluster-admin角色的用户身份登录。
流程
- 在 Web 控制台的 Administrator 视角中,进入 Operators → Installed Operators。
- 从 Installed Operators 列表中,点 Power monitoring for Red Hat OpenShift,再进入 Kepler 选项卡。
- 在列表中找到 Kepler 实例条目。
-
在这个条目中点
 并选择 Delete Kepler。
- 在 Delete Kepler? 对话框中,点 Delete 以删除 Kepler 实例。
6.2. 卸载 Power 监控 Operator
如果使用 OperatorHub 安装 Power monitoring Operator,您可以从 OpenShift Container Platform Web 控制台卸载它。
先决条件
- 访问 OpenShift Container Platform web 控制台。
-
以具有
cluster-admin角色的用户身份登录。
流程
删除 Kepler 实例。
警告在卸载 Power monitoring Operator 前,请确保已删除 Kepler 实例。
- 进入 Operators → Installed Operators。
- 在列表中找到 Red Hat OpenShift 的 Power monitoring 部分。
-
在这个条目中点
并选择 Uninstall Operator。
- 在 Uninstall Operator? 对话框中,点 Uninstall 卸载 Power monitoring Operator。