
Performance tuning for Red Hat JBoss Enterprise Application Platform
Instructions for evaluating Red Hat JBoss Enterprise Application Platform performance, and for configuring updates to improve performance.
Abstract
Providing feedback on JBoss EAP documentation
To report an error or to improve our documentation, log in to your Red Hat Jira account and submit an issue. If you do not have a Red Hat Jira account, then you will be prompted to create an account.
Procedure
- Click the following link to create a ticket.
- Enter a brief description of the issue in the Summary.
- Provide a detailed description of the issue or enhancement in the Description. Include a URL to where the issue occurs in the documentation.
- Clicking Submit creates and routes the issue to the appropriate documentation team.
Making open source more inclusive
Red Hat is committed to replacing problematic language in our code, documentation, and web properties. We are beginning with these four terms: master, slave, blacklist, and whitelist. Due to the enormity of this endeavor, these changes will be gradually implemented over upcoming releases. For more details on making our language more inclusive, see our CTO Chris Wright’s message.
Chapter 1. Introduction to performance tuning
A JBoss EAP installation is optimized by default. However, configurations to your environment, applications, and use of JBoss EAP subsystems can impact performance, meaning additional configuration might be needed.
This guide provides optimization recommendations for common JBoss EAP use cases, as well as instructions for monitoring performance and diagnosing performance issues.
You should stress test and verify all performance configuration changes under anticipated conditions in a staging or testing environment prior to deploying them to production.
1.1. About the use of EAP_HOME in this document
In this document, the variable EAP_HOME is used to denote the path to the JBoss EAP installation. Replace this variable with the actual path to your JBoss EAP installation.
-
If you installed the JBoss EAP compressed file, the install directory is the
jboss-eap-8.0directory where you extracted the compressed archive.
If you used the installer to install JBoss EAP, the default path for
EAP_HOMEis${user.home}/EAP-8.0.0:-
For Red Hat Enterprise Linux and Solaris:
/home/USER_NAME/EAP-8.0.0/ -
For Microsoft Windows:
C:\Users\USER_NAME\EAP-8.0.0\
-
For Red Hat Enterprise Linux and Solaris:
If you used the JBoss Tools installer to install and configure the JBoss EAP server, the default path for
EAP_HOMEis${user.home}/devstudio/runtimes/jboss-eap:-
For Red Hat Enterprise Linux:
/home/USER_NAME/devstudio/runtimes/jboss-eap/ -
For Microsoft Windows:
C:\Users\USER_NAME\devstudio\runtimes\jboss-eaporC:\Documents and Settings\USER_NAME\devstudio\runtimes\jboss-eap\
-
For Red Hat Enterprise Linux:
If you set the Target runtime to 8.0 or a later runtime version in JBoss Tools, your project is compatible with the Jakarta EE 8 specification.
EAP_HOME is not an environment variable. JBOSS_HOME is the environment variable used in scripts.
Chapter 2. Monitoring performance
You can monitor JBoss EAP performance using any tool that can examine JVMs running on your machine. Red Hat recommends that you use either JConsole, for which JBoss EAP includes a preconfigured wrapper script, or Java Mission Control (JMC). Both these tools provide basic monitoring of JVM processes, including memory usage, thread utilization, loaded classes, and other JVM metrics.
If you will be running one of these tools locally on the same machine that JBoss EAP is running on, then no configuration is necessary. However, if you will be running one of these tools to monitor JBoss EAP running on a remote machine, then some configuration is required for JBoss EAP to accept remote JMX connections.
2.1. Configuring JBoss EAP for remote monitoring connections
2.1.1. Configuring remote monitoring connections for a standalone server
Procedure
- Ensure that you have created a management user. You might want to create a separate management user to monitor your JBoss EAP server.
When starting JBoss EAP, bind the management interface to the IP address that you will use to remotely monitor the server:
$ EAP_HOME/bin/standalone.sh -bmanagement=IP_ADDRESS
WarningThis exposes all the JBoss EAP management interfaces, including the management console and management CLI, to the specified network. Ensure that you only bind the management interface to a private network.
Use the following URI with your management user name and password in your JVM monitoring tool to connect to the JBoss EAP server. The URI below uses the default management port (
9990).service:jmx:remote+http://IP_ADDRESS:9990
2.1.2. Configuring JBoss EAP remote monitoring connections for a managed domain host
Using the preceding procedure of binding the management interface on a managed domain host will only expose the host controller JVM for remote monitoring, and not the individual JBoss EAP servers running on that host.
To configure JBoss EAP to remotely monitor individual servers on a managed domain host, follow the procedure below.
Procedure
-
Create a new user in the
ApplicationRealmthat you will use to connect to the JBoss EAP servers for remote monitoring. To configure the
remotingsubsystem to use Elytron, execute the following commands:/profile=full/subsystem=jmx/remoting-connector=jmx:add(use-management-endpoint=false) /socket-binding-group=full-sockets/socket-binding=remoting:add(port=4447) /profile=full/subsystem=remoting/connector=remoting-connector:add(socket-binding=remoting,sasl-authentication-factory=application-sasl-authentication)
When starting your JBoss EAP managed domain host, bind one or both of the following interfaces to an IP address that you will use for monitoring.
If you want to connect to individual JBoss EAP server JVMs running on your managed domain host, bind the public interface:
$ EAP_HOME/bin/domain.sh -b=IP_ADDRESS
If you want to connect to the JBoss EAP host controller JVM, also bind the management interface:
$ EAP_HOME/bin/domain.sh -bmanagement=IP_ADDRESS
WarningThis exposes all the JBoss EAP management interfaces, including the management console and management CLI, to the specified network. Ensure that you only bind the management interface to a private network.
Use the following details in your JVM monitoring tool:
To connect to individual JBoss EAP server JVMs running on your managed domain host, use the following URI with your
ApplicationRealmuser name and password that was created earlier.service:jmx:remote+http://IP_ADDRESS:4447To connect to different JBoss EAP servers on a single host, add the respective server’s port offset value to the above port number.
To connect to the JBoss EAP host controller JVM, use the following URI with a management user name and password.
service:jmx:remote+http://IP_ADDRESS:9990
2.2. JConsole
A preconfigured JConsole wrapper script is bundled with JBoss EAP. Using this wrapper script ensures that all the required libraries are added to the class path, and also provides access to the JBoss EAP management CLI from within JConsole.
2.2.1. Connecting to a local JBoss EAP JVM using JConsole
To connect to a JBoss EAP JVM running on the same machine as JConsole:
Procedure
-
Run the
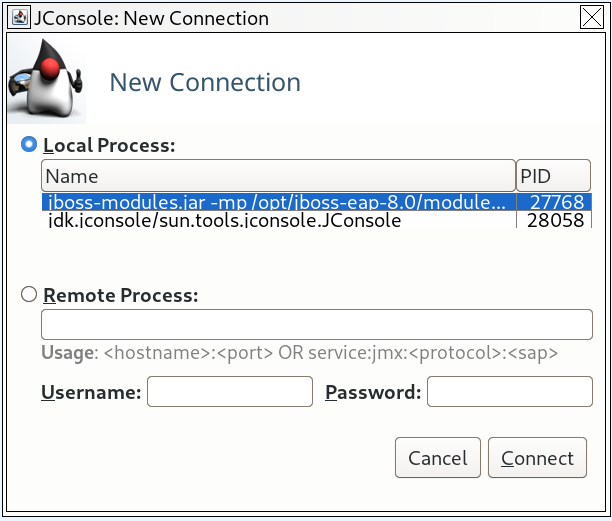
jconsolescript inEAP_HOME/bin. Under Local Process, select the JBoss EAP JVM process that you want to monitor.
For a standalone JBoss EAP server, there is one JBoss EAP JVM process.
Figure 2.1. JConsole Local Standalone JBoss EAP Server JVM
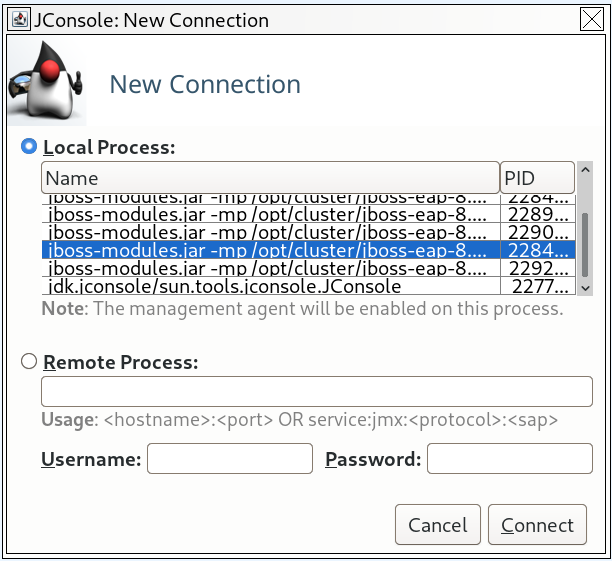
A JBoss EAP managed domain host has multiple JVM processes you can connect to: a host controller JVM process, a process controller JVM process, and a JVM process for each JBoss EAP server on the host. You can determine which JVM you have connected to by looking at the JVM arguments.
Figure 2.2. JConsole Local Managed Domain JBoss EAP JVMs
- Click Connect.
2.2.2. Connecting to a Remote JBoss EAP JVM Using JConsole
You can use JConsole to connect to a remote JBoss EAP JVM using the jconsole script.
Prerequisites
- Configure JBoss EAP for remote monitoring connections.
- Download and extract a ZIP installation of JBoss EAP to your local machine.
Procedure
-
Run the
jconsolescript inEAP_HOME/bin. Under Remote Process, insert the URI for the remote JBoss EAP JVM process that to want to monitor.
Figure 2.3. JConsole Remote JBoss EAP JVM
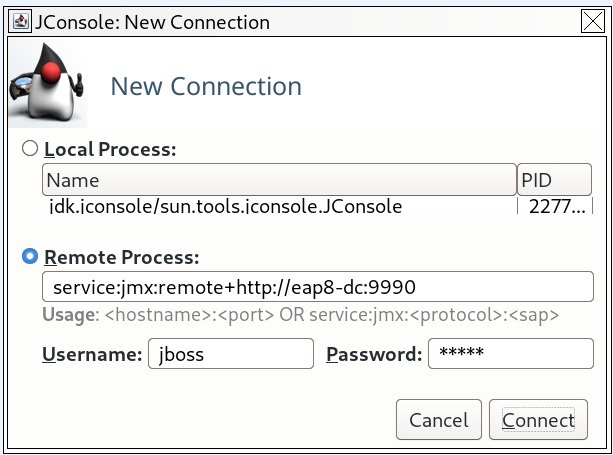
- Ensure that you provide the user name and password for the monitoring connection.
- Click Connect.
2.3. Java Mission Control
Developers can use Java Mission Control (JMC) to identify performance issues. JMC is a profiling and diagnostic tool that consists of the following components:
- Java Virtual Machine (JVM) Browser to view running Java applications and their related JVMs.
- Java Management (JMX) Console to monitor JVMs.
- Java Flight Recorder (JFR) to collect diagnostic data from running Java applications.
- Plug-ins for heap dump analysis.
Additional resources
- For more information about connecting JMC to local or remote JBoss EAP JVMs, see How to connect Java Mission Control with EAP remotely? on the Red Hat Customer Portal.
- For more information about downloading and installing JMC, see Install JDK Mission Control and Supported Plug-ins section of the Oracle JDK Mission Control user guide.
Chapter 3. Diagnosing performance issues
3.1. Enabling garbage collection logging
Examining garbage collection logs can be useful when attempting to troubleshoot Java performance issues, especially those related to memory usage.
Other than some additional disk I/O activity for writing the log files, enabling garbage collection logging does not significantly affect server performance.
Garbage collection logging is already enabled by default for a standalone JBoss EAP server running on OpenJDK or Oracle JDK. For a JBoss EAP managed domain, garbage collection logging can be enabled for the host controller, process controller, or individual JBoss EAP servers.
Get the correct JVM options for enabling garbage collection logging for your JDK. Replace the path in the options below to where you want the log to be created.
NoteThe Red Hat Customer Portal has a JVM Options Configuration Tool that can help you generate optimal JVM settings.
For OpenJDK 11 or Oracle JDK 11:
-verbose:gc -Xloggc:<path_to_directory>/gc.log -XX:+PrintGCDetails -XX:+PrintGCDateStamps -XX:+UseGCLogFileRotation -XX:NumberOfGCLogFiles=5 -XX:GCLogFileSize=3M -XX:-TraceClassUnloadingFor versions 9 or later of OpenJDK, Oracle JDK, or any JDK that supports JEP 271:
-Xlog:gc*:file=<path_to_directory>/gc.log:time,uptimemillis:filecount=5,filesize=3M
Additional resources
- For more information about JEP 271, see JEP 271: Unified GC Logging on the OpenJDK web page.
3.2. Java heap dumps
A Java heap dump is a snapshot of a JVM heap created at a certain point in time. Creating and analyzing heap dumps can be useful for diagnosing and troubleshooting issues with Java applications.
Depending on which JDK you are using, there are different ways of creating and analyzing a Java heap dump for a JBoss EAP process. This section covers common methods for Oracle JDK and OpenJDK.
3.2.1. Creating a heap dump using OpenJDK and Oracle JDK
3.2.1.1. Create an on-demand heap dump
You can use the jcmd command to create an on-demand heap dump for JBoss EAP running on OpenJDK or Oracle JDK.
Procedure
- Determine the process ID of the JVM that you want to create a heap dump from.
Create the heap dump with the following command:
$ jcmd JAVA_PID GC.heap_dump -all=true FILENAME.hprof
This creates a heap dump file in the HPROF format, usually located in
EAP_HOMEorEAP_HOME/bin. Alternatively, you can specify a file path to another directory.
3.2.1.2. Create a heap dump automatically on OutOfMemoryError
You can use the -XX:+HeapDumpOnOutOfMemoryError JVM option to automatically create a heap dump when an OutOfMemoryError exception is thrown.
This creates a heap dump file in the HPROF format, usually located in EAP_HOME or EAP_HOME/bin. Alternatively, you can set a custom path for the heap dump using -XX:HeapDumpPath=/path/. If you specify a file name using -XX:HeapDumpPath, for example, -XX:HeapDumpPath=/path/filename.hprof, the heap dumps will overwrite each other.
3.2.2. Analyzing a heap dump
3.2.2.1. Heap dump analysis tools
There are many tools that can analyze heap dump files and help identify issues. Red Hat Support recommends using the Eclipse Memory Analyzer tool (MAT), which can analyze heap dumps formatted in either HPROF or PHD formats.
Additional resources
For information on using Eclipse MAT, see the Eclipse MAT documentation.
3.2.2.2. Heap dump analysis tips
Sometimes the cause of the heap performance issues are obvious, but other times you may need an understanding of your application’s code and the specific circumstances that cause issues like an OutOfMemoryError. This can help to identify whether an issue is a memory leak, or if the heap is just not large enough.
Some suggestions for identifying memory usage issues include:
- If a single object is not found to be consuming too much memory, try grouping by class to see if many small objects are consuming a lot of memory.
-
Check if the biggest usage of memory is a thread. A good indicator of this is if the
OutOfMemoryError-triggered heap dump is much smaller than the specifiedXmxmaximum heap size. -
A technique to make memory leaks more detectable is to temporarily double the normal maximum heap size. When an
OutOfMemoryErroroccurs, the size of the objects related to the memory leak will be about half the size of the heap.
When the source of a memory issue is identified, you can view the paths from garbage collection roots to see what is keeping the objects alive.
3.3. Java Flight Recorder
3.3.1. About Java Flight Recorder
The Oracle JDK Mission Control user guide describes Java Flight Recorder (JFR) as a "profiling and event collection framework". Developers can use JFR with JDK Mission Control (JMC) to collect data about Java Virtual Machines (JVMs) and other Java applications. Developers can use this data to identify and fix performance issues.
JFR has been carefully designed so that it requires a low level of overhead (consumption of resources). This means that JFR profiling can run continuously in certain production environments with minimal impact. Developers can use JFR and JMC to quickly analyze runtime information after an incident.
JFR is available from Java OpenJDK 8u262 or later as part of the Java Diagnostic Command Tool.
Additional resources
- For more information about JFR, see section Flight Recorder in the Oracle JDK Mission Control user guide.
3.3.2. Java Flight Recorder profiling configurations
Developers can modify the profiling configurations to customize their instance of Java Flight Recorder (JFR). Two different profiling configurations are available with JFR:
-
default: provides a sparse sampling of information; low profiling detail -
profile: provides a more comprehensive sampling of information; medium profiling detail
Developers can modify either configuration files to enable additional event metrics sampling.
3.3.3. Enable Java Flight Recorder profile capture
Developers can use Java Flight Recorder (JFR) to profile a JBoss EAP installation on bare metal or using Red Hat OpenShift Container Platform.
To learn about using JFR with OpenShift, see Introduction to Cryostat: JDK Flight Recorder for containers.
3.3.3.1. Enable Java Flight Recorder profiling on bare metal
Developers can start a Java Flight Recorder (JFR) profile using the command line or the Java Management Extensions (JMX) with the Java Mission Control (JMC) desktop application.
3.3.3.2. Configure Java Flight Recorder profiling for JBoss EAP using Java Virtual Machine configuration flags
You can use configuration flags to configure Java Flight Recorder (JFR) profiling with JBoss EAP on Java Virtual Machines (JVMs).
Example JVM configuration
-XX:StartFlightRecording=delay=15s,duration=60s,name=jboss-eap-profile, filename=C:\TEMP\jboss-eap-profile.jfr,settings=default
The StartFlightRecording=delay configuration flag allows you to set the amount of time JFR waits after the JVM boots before starting a profiling session. In the preceding example, StartFlightRecording=delay is set to 15 seconds, which means profiling will start after a 15 second delay.
The duration configuration flag allows you to set the length of time for each profiling session. In the preceding example, duration is set to 60 seconds.
The name configuration flag allows you to set the in memory profile name. In this example, the in memory profile name is set to jboss-eap-profile.
The filename configuration flag allows you to set the filename and path where you would like the file to be saved. In this example, filename is set to C:\TEMP\jboss-eap-profile.jfr.
The settings configuration flag allows you to select a profiling configuration. In this example, settings is set to default. Note that the file extension for the profiling configuration is excluded.
After the profiling session is complete, a file will be created at the file path defined by the filename option.
3.3.3.3. Profiling using Java command tool for a running JBoss EAP Java Virtual Machine
You can use the Java Flight Recorder (JFR) JFR.start command to configure a running JBoss EAP Java Virtual Machine (JVM) for profiling using the Java command tool, jcmd.
Procedure
Use one of the following commands:
For a Linux operating system:
$ jcmd <PID> JFR.start duration=TIME filename=path/to/YOUR_PROFILE_NAME.jfr
For example:
JFR.startcommand for Linux example$ jcmd <PID> JFR.start duration=60s filename=/tmp/jboss-eap-profile.jfr
Once a JFR profiling session starts, you will receive the following confirmation message:
$ jcmd <PID> JFR.start duration=60s filename=/tmp/jboss-eap-profile.jfr
<PID>:
Started recording 1. The result will be written to:

/tmp/jboss-eap-profile.jfr
For a Windows operating system:
> jcmd.exe <PID> JFR.start duration=TIME filename=path/to/YOUR_PROFILE_NAME.jfr
For example:
JFR.startcommand for Windows example> jcmd.exe <PID> JFR.start duration=60s filename=C:\TEMP\jboss-eap-profile.jfr
Once a JFR profiling session starts, you will receive the following confirmation message:
> jcmd.exe <PID> JFR.start duration=60s filename=C:\TEMP\jboss-eap-profile.jfr
<PID>:
Started recording 1. The result will be written to:

C:\TEMP\jboss-eap-profile.jfr
The duration option allows you to set the length of time for each profiling session. In the preceding example commands, duration is set to 60 seconds.
The filename option allows you to set the filename and path where you would like the file to be saved. In the preceding example commands, filename is set to /tmp/jboss-eap-profile.jfr in the Linux example, and C:\TEMP\jboss-eap-profile.jfr in the Windows example.
3.3.3.4. Connect a local Java Virtual Machine using Java Mission Control
You can use Java Mission Control (JMC) to connect a local Java Virtual Machine (JVM) running on the same server as your instance of JMC.
Prerequisites
- Java Mission Control with JBoss EAP libraries is configured. See How to connect Java Mission Control with EAP remotely? for instructions.
-
JBoss EAP is configured for remote monitoring connections, and a user is created in the
ApplicationRealmfor monitoring.
Procedure
- Open Java Mission Control.
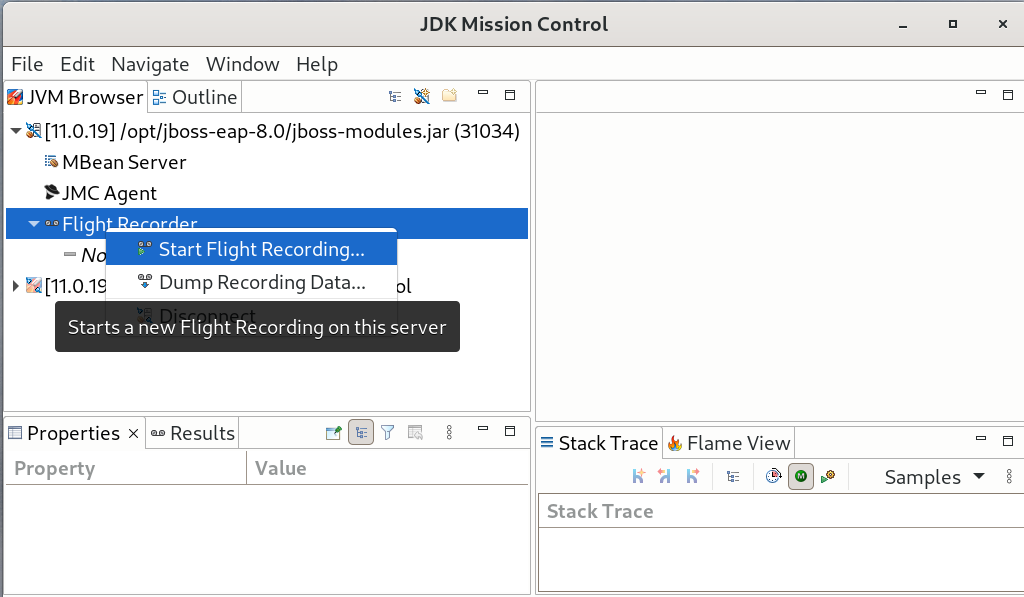
- In the JVM Browser pane, select the JVM to profile.
Expand the dropdown menu for the JVM to reveal the Flight Recorder item.
Right click Flight Recorder to open the sub-menu, select Start Flight Recording….
Figure 3.1. JVM Browser in JMC
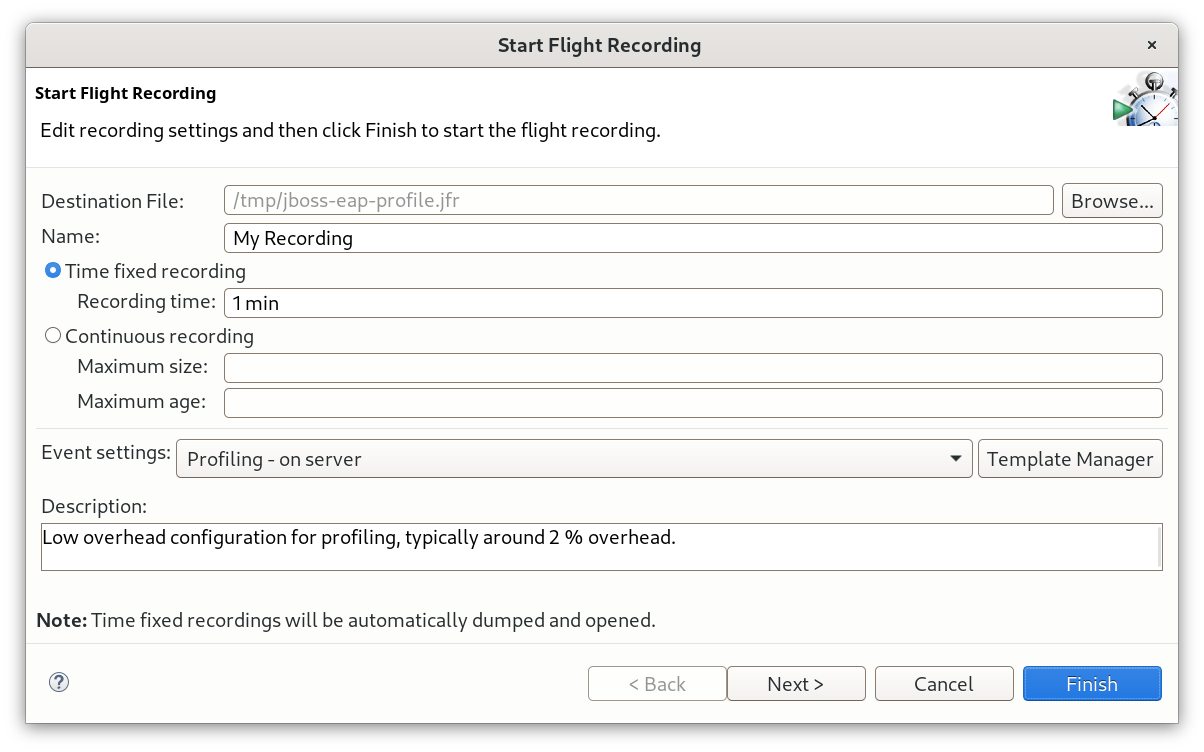
In the Start Flight Recording window configure options for profiling.
Figure 3.2. JVM profiling settings
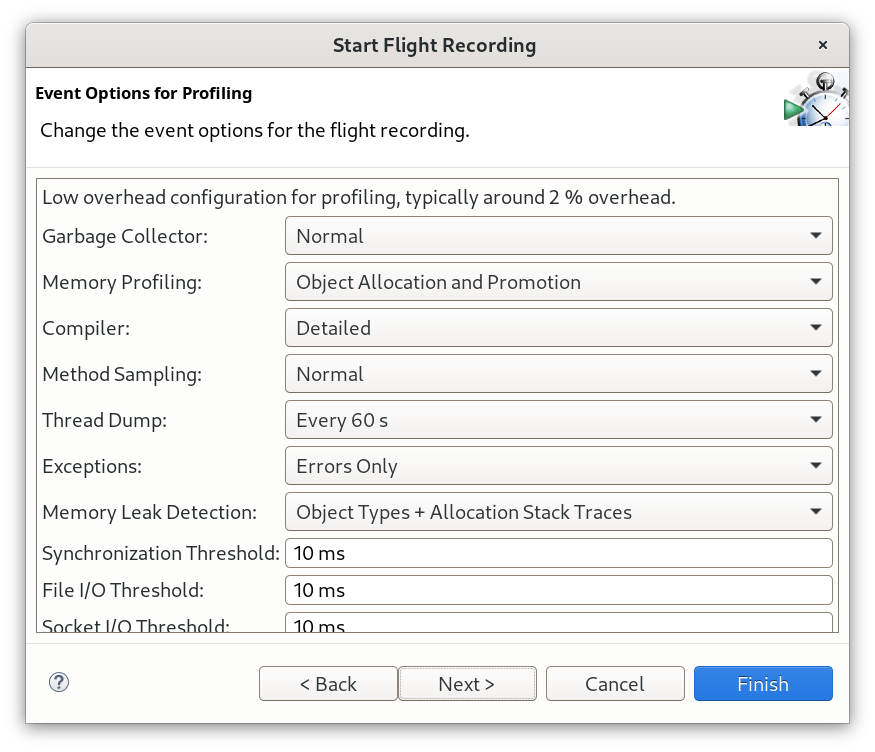
Click Next for detailed low level settings.
Figure 3.3. JVM profiling advanced settings
- Click Finish to start profiling.
3.3.3.5. Connect a remote Java Virtual Machine using Java Mission Control
You can use Java Mission Control (JMC) to connect to a remote Java Virtual Machine (JVM) profile.
Prerequisites
- Configure Java Mission Control with JBoss EAP libraries. See How to connect Java Mission Control with EAP remotely? for instructions.
-
Configure JBoss EAP for remote monitoring connections, with a user created in the
ApplicationRealmfor monitoring.
Procedure
- Open Java Mission Control.
- In the File menu, select Connect.
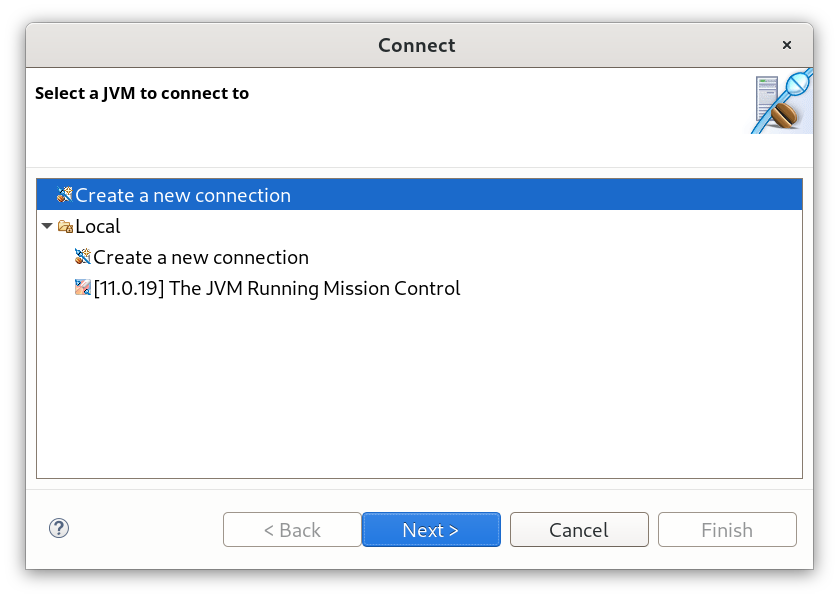
In the Connect window, select Create a new connection, then click Next.
Figure 3.4. Connect window in JMC
In the JVM Connection window, complete the details for your remote JBoss EAP JVM to be profiled.
Figure 3.5. JVM connection details in JMC
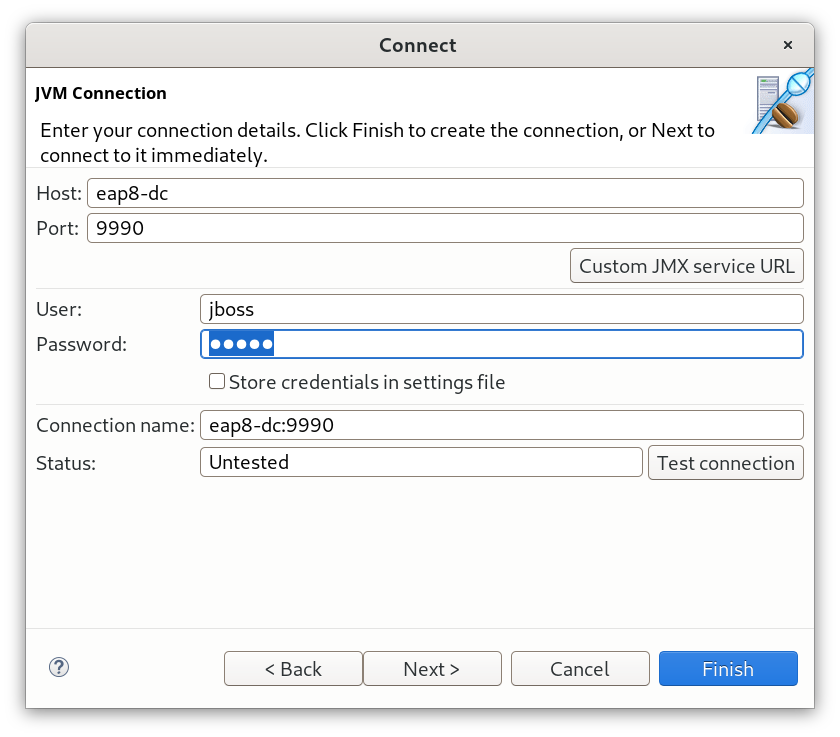
- In the Host field, add your hostname or an IP address.
- In the Port field, add your port number.
-
In the User field, add the user that you created in the
ApplicationRealm. -
In the Password field, add your password created in the
ApplicationRealm. - Optional To store credentials in a settings file, click the checkbox next to Store credentials in settings file.
Click Custom JMX Service URL to override the default setting.
Figure 3.6. JMX Service URL for JVM connection
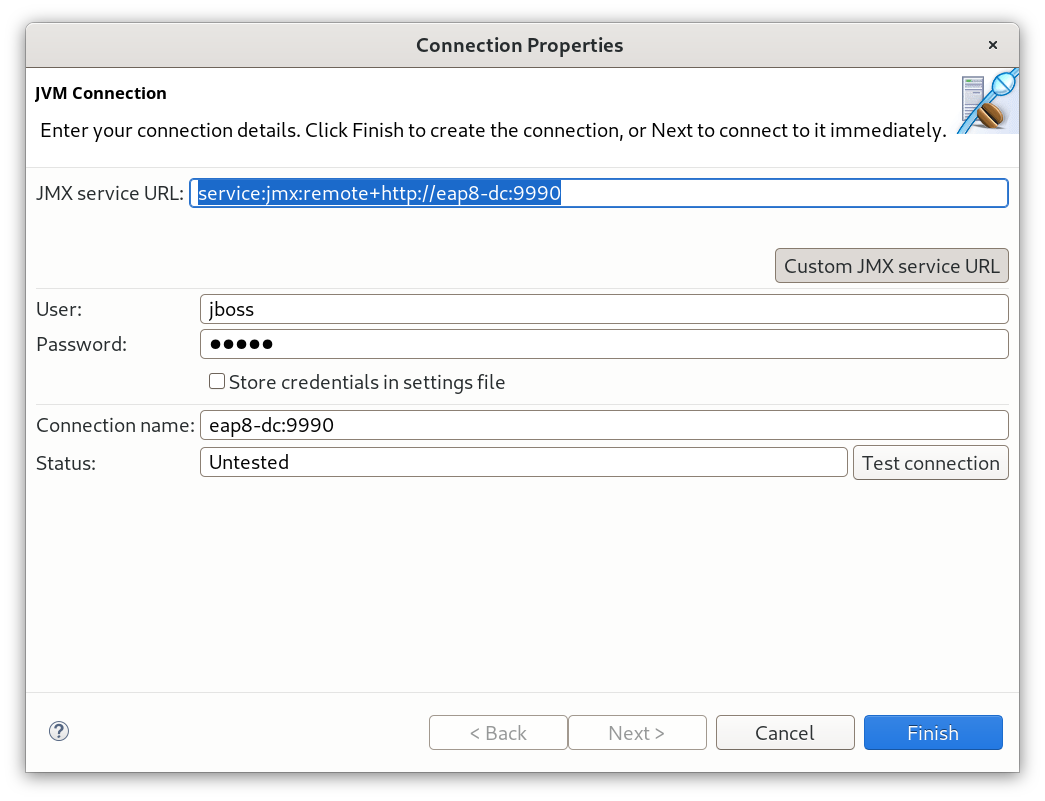
Change the JMX service URL to define the JBoss remoting protocol.
service:jmx:remote+http://<host>:9990
- Click Test connection to verify your settings.
- Click Finish to save your settings.
A JMXRMI Preferences not set warning message will appear.
Figure 3.7. JMXRMI preferences warning message
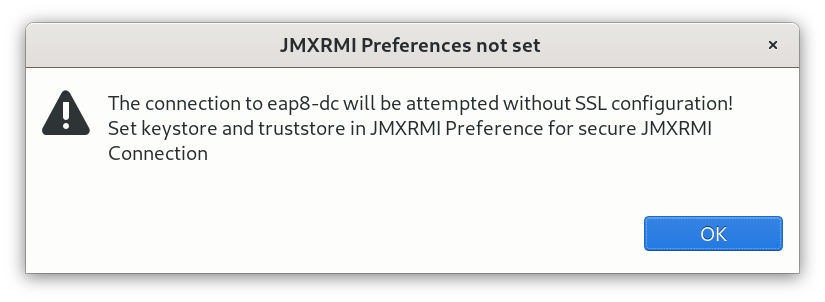
- Click OK to accept the connection attempt.
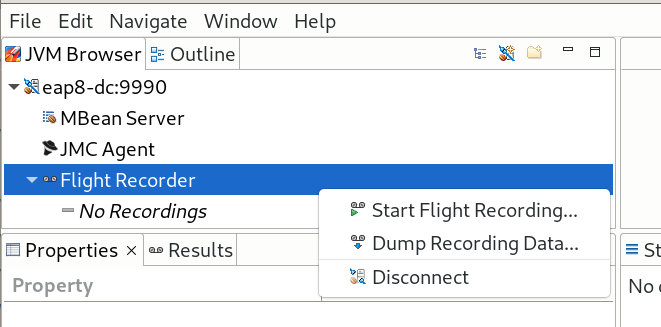
In the JVM Browser pane, select the JVM to profile.
- Expand the dropdown menu for the JVM to reveal the Flight Recorder item.
Right click Flight Recorder to open the sub-menu, then select Start Flight Recording….
Figure 3.8. Connect a remote JVM using JMC profile menu
In the Start Flight Recording window configure options for profiling.
Figure 3.9. JVM profiling settings
Click Next for detailed low level settings.
Figure 3.10. JVM profiling advanced settings
- Click Finish to start profiling.
3.4. Identifying high CPU utilization by Java threads
For customers using JBoss EAP on Red Hat Enterprise Linux or Solaris, the JVMPeg lab tool on the Red Hat Customer Portal helps collect and analyze Java thread information to identify high CPU utilization. Follow the instructions for using the JVMPeg lab tool instead of using the following procedure.
For OpenJDK and Oracle JDK environments, Java thread diagnostic information is available using the jstack utility.
Identify the process ID of the Java process that is utilizing a high percentage of the CPU.
It can also be useful to obtain per-thread CPU data on high-usage processes. This can be done using the
top -Hcommand on Red Hat Enterprise Linux systems.Using the
jstackutility, create a stack dump of the Java process. For example, on Linux and Solaris:jstack -l JAVA_PROCESS_ID > high-cpu-tdump.outYou might need to create multiple dumps at intervals to see any changes or trends over a period of time.
- Analyze the stack dumps. You can use a tool such as the Thread Dump Analyzer (TDA).
3.5. Runtime statistics for managed executor services and managed scheduled executor services
You can monitor the performance of managed executor services and managed scheduled executor services by viewing the runtime statistics generated with the management CLI attributes. You can view the runtime statistics for a standalone server or for an individual server mapped to a host.
The domain.xml configuration does not include a resource for the runtime statistic management CLI attributes, so you cannot use the management CLI attributes to view the runtime statistics for a managed domain.
Table 3.1. Displays management CLI attributes for monitoring the performance of managed executor services and of managed scheduled executor services.
| Attribute | Description |
|---|---|
| active-thread-count | The approximate number of threads that are actively executing tasks. |
| completed-task-count | The approximate total number of tasks that have completed execution. |
| hung-thread-count | The number of executor threads that are hung. |
| max-thread-count | The largest number of executor threads. |
| current-queue-size | The current size of the executor’s task queue. |
| task-count | The approximate total number of tasks that have been submitted for execution. |
| thread-count | The current number of executor threads. |
Example of viewing the runtime statistics for a managed executor service running on a standalone server.
[standalone@localhost:9990 /] /subsystem=ee/managed-executor-service=default:read-resource(include-runtime=true,recursive=true)
Example of the runtime statistics for a managed scheduled executor service running on a standalone server.
[standalone@localhost:9990 /] /subsystem=ee/managed-scheduled-executor-service=default:read-resource(include-runtime=true,recursive=true)
Example of viewing the runtime statistics for a managed executor service running on a server mapped to a host.
[domain@localhost:9990 /] /host=<host_name>/server=<server_name>/subsystem=ee/managed-executor-service=default:read-resource(include-runtime=true,recursive=true)
Example of the runtime statistics for a managed scheduled executor service running on a server mapped to a host.
[domain@localhost:9990 /] /host=<host_name>/server=<server_name>/subsystem=ee/managed-scheduled-executor-service=default:read-resource(include-runtime=true,recursive=true)
Chapter 4. JVM tuning
Configuring optimal JVM options for your applications and JBoss EAP environment is one of the most fundamental ways to tune performance. This chapter covers configuring some general JVM options.
Many of the JVM options listed in this chapter can be easily generated using the JVM Options Configuration Tool on the Red Hat Customer Portal.
4.1. Setting a fixed heap size
You must set an appropriate heap size to prevent out of memory errors.
The -Xms option sets the initial heap size, and -Xmx sets the maximum heap size. It is recommended for production environments that you set the initial and maximum heap size options to the same size, so that the heap size is fixed and pre-allocated.
For example, the following options set a 2048 MB heap size:
-Xms2048M -Xmx2048M
It is recommended that you test your applications under load in a development environment to determine the maximum memory usage. Your production heap size should be at least 25% higher than the tested maximum to allow room for overhead.
4.2. Configuring the garbage collector
Although the parallel garbage collector, also known as the throughput garbage collector, is the default garbage collector in Java 8 for server-class machines, Red Hat recommends using the G1 garbage collector, which is expected to be the default from Java 9 onward. The G1 garbage collector generally performs better than the CMS and parallel garbage collectors in most scenarios.
To enable the G1 collector, use the following JVM option:
-XX:+UseG1GC
4.2.1. Garbage collection logging options
Garbage collection logging is enabled by default for standalone JBoss EAP servers.
4.3. Enabling large pages
Enabling large pages for JBoss EAP JVMs results in pages that are locked in memory and cannot be swapped to disk like regular memory.
Especially for memory-intensive applications, the advantage of using large pages is that the heap cannot be paged or swapped to disk, and is thus always readily available.
One disadvantage of using large pages is that other processes running on the system might not have quick access to memory, which might result in excessive paging for these processes.
As with any other performance configuration change, it is recommended that you test the impact of the change in a testing environment.
You must ensure that your operating system configuration allows for processes to use large pages.
-
For Red Hat Enterprise Linux systems, you must explicitly configure
HugeTLBpages to guarantee that JBoss EAP processes will have access to large pages. For Windows Server systems, the user that is running JBoss EAP must have the large pages privilege assigned:
- Select Control Panel → Administrative Tools → Local Security Policy.
- Select Local Policies → User Rights Assignment.
- Double-click Lock pages in memory.
- Add the Windows Server users and user groups that you want to use large pages.
- Restart the machine.
-
For Red Hat Enterprise Linux systems, you must explicitly configure
Enable or disable large page support:
To explicitly enable large page support for JBoss EAP JVMs, use the following JVM option:
-XX:+UseLargePages
To explicitly disable large page support for JBoss EAP JVMs, use the following JVM option:
-XX:-UseLargePages
When starting JBoss EAP, ensure that there are no warnings related to reserving memory.
On Red Hat Enterprise Linux, an error might look like:
OpenJDK 64-Bit Server VM warning: Failed to reserve shared memory. (error = 1)
On Windows Server, an error might look like:
Java HotSpot(TM) 64-Bit Server VM warning: JVM cannot use large page memory because it does not have enough privilege to lock pages in memory.
If you do see warnings, verify that your operating system configuration and JVM options are configured correctly.
For more information, see the Oracle documentation on Java support for large pages.
4.4. Setting ulimits
For Red Hat Enterprise Linux and Solaris platforms, you must configure appropriate ulimit values for JBoss EAP JVM processes. The "soft" ulimit can be temporarily exceeded, while the "hard" ulimit is the strict ceiling for the usage of a resource. Appropriate ulimit values vary depending on your environment and applications.
If the limits applied to JBoss EAP processes are too low, you will see a warning like the following when starting JBoss EAP:
WARN [org.jboss.as.warn.fd-limit] (main) WFLYSRV0071: The operating system has limited the number of open files to 1024 for this process; a value of at least 4096 is recommended.
To see your current ulimit values, use the following commands:
For soft
ulimitvalues:ulimit -Sa
For hard
ulimitvalues:ulimit -Ha
To set the ulimit for the maximum number of open files, use the following commands with the number you want to apply:
To set the soft
ulimitfor the maximum number of open files:ulimit -Sn 4096To set the hard
ulimitfor the maximum number of open files:ulimit -Hn 4096
To guarantee that a ulimit setting is effective, it is recommended on production systems to set the soft and hard limits to the same value.
Additional resources
For more information on setting ulimit values using a configuration file, see How to set ulimit values on the Customer Portal.
4.5. Host controller and Process controller JVM tuning
JBoss EAP managed domain hosts have separate JVMs for the host controller and process controller.
You can tune the host controller and process controller JVM settings, but even for large managed domain environments, the default JVM configuration for the host controller and process controller should suffice.
The default configurations for host controller and process controller JVMs have been tested with a managed domain size of up to 20 JBoss EAP hosts each running 10 JBoss EAP servers, for a total domain size of 200 JBoss EAP servers.
If you experience issues with larger managed domains, you might need to monitor the host controller or process controller JVMs in your environment to determine appropriate values for JVM options such as heap size.
Chapter 5. Jakarta Enterprise Beans subsystem tuning
JBoss EAP can cache Jakarta Enterprise Beans to save initialization time. This is accomplished using bean pools.
There are two different bean pools that can be tuned in JBoss EAP: bean instance pools and bean thread pools.
Appropriate bean pool sizes depend on your environment and applications. It is recommended that you experiment with different bean pool sizes and perform stress testing in a development environment that emulates your expected real-world conditions.
5.1. Bean instance pools
Bean instance pools are used for Stateless Session Beans (SLSBs) and Message Driven Beans (MDBs). By default, SLSBs use the instance pool default-slsb-instance-pool, and MDBs use the instance pool default-mdb-instance-pool.
The size of a bean instance pool limits the number of instances of a particular enterprise bean that can be created at one time. If the pool for a particular enterprise bean is full, the client will block and wait for an instance to become available. If a client does not get an instance within the time set in the pool’s timeout attributes, an exception is thrown.
The size of a bean instance pool is configured using either derive-size or max-pool-size. The derive-size attribute allows you to configure the pool size using one of the following values:
-
from-worker-pools, which indicates that the maximum pool size is derived from the size of the total threads for all worker pools configured on the system. -
from-cpu-count, which indicates that the maximum pool size is derived from the total number of processors available on the system. Note that this is not necessarily a 1:1 mapping, and might be augmented by other factors.
If derive-size is undefined, then the value of max-pool-size is used for the size of the bean instance pool.
The derive-size attribute overrides any value specified in max-pool-size. derive-size must be undefined for the max-pool-size value to take effect.
You can configure an enterprise bean to use a specific instance pool. This allows for finer control of the instances available to each enterprise bean type.
5.1.1. Creating a bean instance pool
This section shows you how to create a new bean instance pool using the management CLI. You can also configure bean instance pools using the management console by navigating to the Jakarta Enterprise Beans subsystem from the Configuration tab, and then selecting the Bean Pool tab.
To create a new instance pool, use one of the following commands:
To create a bean instance pool with a derived maximum pool size:
/subsystem=ejb3/strict-max-bean-instance-pool=POOL_NAME:add(derive-size=DERIVE_OPTION,timeout-unit=TIMEOUT_UNIT,timeout=TIMEOUT_VALUE)
The following example creates a bean instance pool named
my_derived_poolwith a maximum size derived from the CPU count, and a timeout of 2 minutes:/subsystem=ejb3/strict-max-bean-instance-pool=my_derived_pool:add(derive-size=from-cpu-count,timeout-unit=MINUTES,timeout=2)
To create a bean instance pool with an explicit maximum pool size:
/subsystem=ejb3/strict-max-bean-instance-pool=POOL_NAME:add(max-pool-size=POOL_SIZE,timeout-unit=TIMEOUT_UNIT,timeout=TIMEOUT_VALUE)
The following example creates a bean instance pool named
my_poolwith a maximum of 30 instances and a timeout of 30 seconds:/subsystem=ejb3/strict-max-bean-instance-pool=my_pool:add(max-pool-size=30,timeout-unit=SECONDS,timeout=30)
5.1.2. Specifying the instance pool a bean should use
You can set a specific instance pool that a particular bean will use either by using the @org.jboss.ejb3.annotation.Pool annotation, or by modifying the jboss-ejb3.xml deployment descriptor of the bean.
5.1.3. Disabling the default bean instance pool
The default bean instance pool can be disabled, which results in an enterprise bean not using any instance pool by default. Instead, a new enterprise bean instance is created when a thread needs to invoke a method on an enterprise bean. This might be useful if you do not want any limit on the number of enterprise bean instances that are created.
To disable the default bean instance pool, use the following management CLI command:
/subsystem=ejb3:undefine-attribute(name=default-slsb-instance-pool)
If a bean is configured to use a particular bean instance pool, disabling the default instance pool does not affect the pool that the bean uses.
5.2. Bean thread pools
By default, a bean thread pool named default is used for asynchronous enterprise bean calls and enterprise bean timers.
From JBoss EAP 7 onward, remote enterprise bean requests are handled in the worker defined in the io subsystem by default.
If required, you can configure each of these enterprise bean services to use a different bean thread pool. This can be useful if you want finer control of each service’s access to a bean thread pool.
When determining an appropriate thread pool size, consider how many concurrent requests you expect will be processed at once.
5.2.1. Creating a bean thread pool
This section shows you how to create a new bean thread pool using the management CLI. You can also configure bean thread pools using the management console by navigating to the Jakarta Enterprise Beans subsystem from the Configuration tab and selecting Container → Thread Pool in the left menu.
To create a new thread pool, use the following command:
/subsystem=ejb3/thread-pool=POOL_NAME:add(max-threads=MAX_THREADS)
The following example creates a bean thread pool named my_thread_pool with a maximum of 30 threads:
/subsystem=ejb3/thread-pool=my_thread_pool:add(max-threads=30)
5.2.2. Configuring enterprise bean services to use a specific bean thread pool
The enterprise bean asynchronous invocation service and timer service can each be configured to use a specific bean thread pool. By default, both these services use the default bean thread pool.
This section shows you how to configure the above enterprise bean services to use a specific bean thread pool using the management CLI. You can also configure these services using the management console by navigating to the Enterprise Bean subsystem from the Configuration tab, selecting the Services tab, and choosing the appropriate service.
To configure an enterprise bean service to use a specific bean thread pool, use the following command:
/subsystem=ejb3/service=SERVICE_NAME:write-attribute(name=thread-pool-name,value=THREAD_POOL_NAME)
Replace SERVICE_NAME with the an enterprise bean service you want to configure:
-
asyncfor the enterprise bean asynchronous invocation service -
timer-servicefor the enterprise bean timer service
The following example sets the enterprise bean async service to use the bean thread pool named my_thread_pool:
/subsystem=ejb3/service=async:write-attribute(name=thread-pool-name,value=my_thread_pool)
5.3. Runtime deployment information for beans
You can add runtime deployment information to your beans for performance monitoring.
For details about the available runtime data, see the ejb3 subsystem in the JBoss EAP management model. An application can include the runtime data as annotations in the bean code or in the deployment descriptor. An application can use both options.
Additional resources
-
For more information about available runtime data, see the
ejb3subsystem in the JBoss EAP management model.
5.3.1. Command line options for retrieving runtime data from Jakarta enterprise beans
Runtime data from Jakarta Enterprise Beans is available from the management CLI so you can evaluate the performance of your Jakarta Enterprise Beans.
The command to retrieve runtime data for all types of beans uses the following pattern:
/deployment=<deployment_name>/subsystem=ejb3/<bean_type>=<bean_name>:read-resource(include-runtime)
Replace <deployment_name> with the name of the deployment .jar file for which to retrieve runtime data. Replace <bean_type> with the type of the bean for which to retrieve runtime data. The following options are valid for this placeholder:
-
stateless-session-bean -
stateful-session-bean -
singleton-bean -
message-driven-bean
Replace <bean_name> with the name of the bean for which you to retrieve runtime data.
The system delivers the result to stdout formatted as JavaScript Object Notation (JSON) data.
Example command to retrieve runtime data for a singleton bean named ManagedSingletonBean deployed in a file named ejb-management.jar
/deployment=ejb-management.jar/subsystem=ejb3/singleton-bean=ManagedSingletonBean:read-resource(include-runtime)
Example output runtime data for the singleton bean
{
    "outcome" => "success",
    "result" => {
        "async-methods" => ["void async(int, int)"],
        "business-local" => ["sample.ManagedSingletonBean"],
        "business-remote" => ["sample.BusinessInterface"],
        "component-class-name" => "sample.ManagedSingletonBean",
        "concurrency-management-type" => undefined,
        "declared-roles" => [
            "Role3",
            "Role2",
            "Role1"
        ],
        "depends-on" => undefined,
        "execution-time" => 156L,
        "init-on-startup" => false,
        "invocations" => 3L,
        "jndi-names" => [
            "java:module/ManagedSingletonBean!sample.ManagedSingletonBean",
            "java:global/ejb-management/ManagedSingletonBean!sample.ManagedSingletonBean",
            "java:app/ejb-management/ManagedSingletonBean!sample.ManagedSingletonBean",
            "java:app/ejb-management/ManagedSingletonBean!sample.BusinessInterface",
            "java:global/ejb-management/ManagedSingletonBean!sample.BusinessInterface",
            "java:module/ManagedSingletonBean!sample.BusinessInterface"
        ],
        "methods" => {"doIt" => {
            "execution-time" => 156L,
            "invocations" => 3L,
            "wait-time" => 0L
        }},
        "peak-concurrent-invocations" => 1L,
        "run-as-role" => "Role3",
        "security-domain" => "other",
        "timeout-method" => "public void sample.ManagedSingletonBean.timeout(javax.ejb.Timer)",
        "timers" => [{
            "time-remaining" => 4304279L,
            "next-timeout" => 1577768415000L,
            "calendar-timer" => true,
            "persistent" => false,
            "info" => "timer1",
            "schedule" => {
                "year" => "*",
                "month" => "*",
                "day-of-month" => "*",
                "day-of-week" => "*",
                "hour" => "0",
                "minute" => "0",
                "second" => "15",
                "timezone" => undefined,
                "start" => undefined,
                "end" => undefined
            }
        }],
        "transaction-type" => "CONTAINER",
        "wait-time" => 0L,
        "service" => {"timer-service" => undefined}
    }
}
Example command to retrieve runtime data for a message-driven bean named NoTimerMDB deployed in a file named ejb-management.jar
/deployment=ejb-management.jar/subsystem=ejb3/message-driven-bean=NoTimerMDB:read-resource(include-runtime)
Example output for the message-driven bean
{
    "outcome" => "success",
    "result" => {
        "activation-config" => [
            ("destination" => "java:/queue/NoTimerMDB-queue"),
            ("destinationType" => "javax.jms.Queue"),
            ("acknowledgeMode" => "Auto-acknowledge")
        ],
        "component-class-name" => "sample.NoTimerMDB",
        "declared-roles" => [
            "Role3",
            "Role2",
            "Role1"
        ],
        "delivery-active" => true,
        "execution-time" => 0L,
        "invocations" => 0L,
        "message-destination-link" => "queue/NoTimerMDB-queue",
        "message-destination-type" => "javax.jms.Queue",
        "messaging-type" => "javax.jms.MessageListener",
        "methods" => {},
        "peak-concurrent-invocations" => 0L,
        "pool-available-count" => 16,
        "pool-create-count" => 0,
        "pool-current-size" => 0,
        "pool-max-size" => 16,
        "pool-name" => "mdb-strict-max-pool",
        "pool-remove-count" => 0,
        "run-as-role" => "Role3",
        "security-domain" => "other",
        "timeout-method" => undefined,
        "timers" => [],
        "transaction-type" => "CONTAINER",
        "wait-time" => 0L,
        "service" => undefined
    }
}
5.4. Exceptions that indicate an enterprise bean subsystem tuning might be required
The Stateless Jakarta Enterprise Beans instance pool is not large enough or the timeout is too low
javax.ejb.EJBException: JBAS014516: Failed to acquire a permit within 20 SECONDS
     at org.jboss.as.ejb3.pool.strictmax.StrictMaxPool.get(StrictMaxPool.java:109)
The enterprise bean thread pool is not large enough, or an enterprise bean is taking longer to process than the invocation timeout
java.util.concurrent.TimeoutException: No invocation response received in 300000 milliseconds
5.4.1. Default global timeout values for stateful session beans
In the ejb3 subsystem, you can configure a default global timeout value for all stateful session beans (SFSBs) that are deployed on your server instance by using the default-stateful-bean-session-timeout attribute.
With the default-stateful-bean-session-timeout attribute, you can use the following management CLI operations on the ejb3 subsystem:
-
The
read-attributeoperation in the management CLI to view the current global timeout value for the attribute. -
The
write-attributeoperation to configure the attribute by using the management CLI.
Attribute behavior varies according to the server mode. For example:
- When running in the standalone server, the configured value gets applied to all SFSBs deployed on the application server.
- When running a server in a managed domain, all SFSBs that are deployed on server instances within server groups receive concurrent timeout values.
When you change the global timeout value for the attribute, the updated settings only apply to new deployments. You must reload the server to apply the new settings to current deployments.
By default, the attribute value is set at -1, which means that deployed SFSBs are configured to never time out. However, you can configure two of the following types of valid values for the attribute:
-
When you set the attribute value to
0, the attribute immediately marks eligible SFSBs for removal by theejbcontainer. -
When you set the attribute value greater than
0, the SFSBs remain idle for the specified time in milliseconds before theejbcontainer removes the eligible SFSBs.
You can still use the pre-existing @StatefulTimeout annotation or the stateful-timeout element, which is located in the ejb-jar.xml deployment descriptor, to configure the timeout value for an SFSB. However, setting such a configuration overrides the default global timeout value to the SFSB.
Two methods exist for verifying a new value you set for the attribute:
-
Use the
read-attributeoperation in the management CLI. -
Examine the
ejb3subsystem section of the server’s configuration file.
Additional resources
- For more information about viewing the current global timeout value for an attribute, see Display an Attribute Value in the Management CLI guide.
- For more information about updating the current global timeout value for an attribute, see Update an Attribute in the Management CLI guide.
Chapter 6. Datasource and Resource adapter tuning
Connection pools are the principal tool that JBoss EAP uses to optimize performance for environments that use datasources, such as relational databases, or resource adapters.
Allocating and deallocating resources for datasource and resource adapter connections is very expensive in terms of time and system resources. Connection pooling reduces the cost of connections by creating a 'pool' of connections that are available to applications.
Before configuring your connection pool for optimal performance, you must monitor the datasource pool statistics or resource adapter statistics under load to determine the appropriate settings for your environment.
6.1. Monitoring pool statistics
6.1.1. Datasource statistics
When statistics collection is enabled for a datasource, you can view runtime statistics for the datasource.
6.1.1.1. Enabling datasource statistics
By default, datasource statistics are not enabled. You can enable datasource statistics collection using the management CLI or the management console.
6.1.1.1.1. Enable datasource statistics using the management CLI
The following management CLI command enables the collection of statistics for the ExampleDS datasource.
In a managed domain, precede this command with /profile=PROFILE_NAME.
/subsystem=datasources/data-source=ExampleDS:write-attribute(name=statistics-enabled,value=true)
Reload the server for the changes to take effect.
6.1.1.1.2. Enable datasource statistics using the management console
Use the following steps to enable statistics collection for a datasource using the management console.
Procedure
- Navigate to Configuration → Subsystems → Datasources & Drivers → Datasources.
- Select the datasource and click View.
- Click Edit under the Attributes tab.
- Set the Statistics Enabled field to ON and click Save. A popup appears indicating that the changes require a reload in order to take effect.
Reload the server.
- For a standalone server, click the Reload link from the popup to reload the server.
- For a managed domain, click the Topology link from the popup. From the Topology tab, select the appropriate server and select the Reload drop down option to reload the server.
6.1.1.2. Viewing datasource statistics
You can view runtime statistics for a datasource using the management CLI or management console.
6.1.1.2.1. View datasource statistics using the management CLI
The following management CLI command retrieves the core pool statistics for the ExampleDS datasource.
In a managed domain, precede these commands with /host=HOST_NAME/server=SERVER_NAME.
/subsystem=datasources/data-source=ExampleDS/statistics=pool:read-resource(include-runtime=true)
{
    "outcome" => "success",
    "result" => {
        "ActiveCount" => 1,
        "AvailableCount" => 20,
        "AverageBlockingTime" => 0L,
        "AverageCreationTime" => 122L,
        "AverageGetTime" => 128L,
        "AveragePoolTime" => 0L,
        "AverageUsageTime" => 0L,
        "BlockingFailureCount" => 0,
        "CreatedCount" => 1,
        "DestroyedCount" => 0,
        "IdleCount" => 1,
        ...
}
The following management CLI command retrieves the JDBC statistics for the ExampleDS datasource.
/subsystem=datasources/data-source=ExampleDS/statistics=jdbc:read-resource(include-runtime=true)
{
    "outcome" => "success",
    "result" => {
        "PreparedStatementCacheAccessCount" => 0L,
        "PreparedStatementCacheAddCount" => 0L,
        "PreparedStatementCacheCurrentSize" => 0,
        "PreparedStatementCacheDeleteCount" => 0L,
        "PreparedStatementCacheHitCount" => 0L,
        "PreparedStatementCacheMissCount" => 0L,
        "statistics-enabled" => true
    }
}
Since statistics are runtime information, be sure to specify the include-runtime=true argument.
6.1.1.2.2. View datasource statistics using the management console
To view datasource statistics from the management console, navigate to the Datasources subsystem from the Runtime tab, select a datasource, and click View.
6.1.2. Resource adapter statistics
You can view core runtime statistics for deployed resource adapters. See the Resource adapter statistics appendix for a detailed list of all available statistics.
6.1.2.1. Enable resource adapter statistics
By default, resource adapter statistics are not enabled. The following management CLI command enables the collection of statistics for a simple resource adapter myRA.rar with a connection factory bound in JNDI as java:/eis/AcmeConnectionFactory:
In a managed domain, precede the command with /host=HOST_NAME/server=SERVER_NAME/.
/deployment=myRA.rar/subsystem=resource-adapters/statistics=statistics/connection-definitions=java\:\/eis\/AcmeConnectionFactory:write-attribute(name=statistics-enabled,value=true)
6.1.2.2. View resource adapter statistics
Resource adapter statistics can be retrieved from the management CLI. The following management CLI command returns statistics for the resource adapter myRA.rar with a connection factory bound in JNDI as java:/eis/AcmeConnectionFactory.
In a managed domain, precede the command with /host=HOST_NAME/server=SERVER_NAME/.
deployment=myRA.rar/subsystem=resource-adapters/statistics=statistics/connection-definitions=java\:\/eis\/AcmeConnectionFactory:read-resource(include-runtime=true)
{
    "outcome" => "success",
    "result" => {
        "ActiveCount" => "1",
        "AvailableCount" => "20",
        "AverageBlockingTime" => "0",
        "AverageCreationTime" => "0",
        "CreatedCount" => "1",
        "DestroyedCount" => "0",
        "InUseCount" => "0",
        "MaxCreationTime" => "0",
        "MaxUsedCount" => "1",
        "MaxWaitCount" => "0",
        "MaxWaitTime" => "0",
        "TimedOut" => "0",
        "TotalBlockingTime" => "0",
        "TotalCreationTime" => "0"
    }
}
Since statistics are runtime information, be sure to specify the include-runtime=true argument.
6.2. Pool attributes
This section details advice for selected pool attributes that can be configured for optimal datasource or resource adapter performance.
- Minimum Pool Size
The
min-pool-sizeattribute defines the minimum size of the connection pool. The default minimum is zero connections. With a zeromin-pool-size, connections are created and placed in the pool when the first transactions occur.If
min-pool-sizeis too small, it results in increased latency while executing initial database commands because new connections might need to be established. Ifmin-pool-sizeis too large, it results in wasted connections to the datasource or resource adapter.During periods of inactivity the connection pool will shrink, possibly to the
min-pool-sizevalue.Red Hat recommends that you set
min-pool-sizeto the number of connections that allow for ideal on-demand throughput for your applications.- Maximum Pool Size
The
max-pool-sizeattribute defines the maximum size of the connection pool. It is an important performance parameter because it limits the number of active connections, and thus also limits the amount of concurrent activity.If
max-pool-sizeis too small, it can result in requests being unnecessarily blocked. Ifmax-pool-sizeis too large, it can result in your JBoss EAP environment, datasource, or resource adapter using more resources than it can handle.Red Hat recommends that you set the
max-pool-sizeto at least 15% higher than an acceptableMaxUsedCountobserved after monitoring performance under load. This allows some buffer for higher than expected conditions.- Prefill
The
pool-prefillattribute specifies whether JBoss EAP will prefill the connection pool with the minimum number of connections when JBoss EAP starts. The default value isfalse.When
pool-prefillis set totrue, JBoss EAP uses more resources at startup, but there will be less latency for initial transactions.Red Hat recommends to set
pool-prefilltotrueif you have optimized themin-pool-size.- Strict Minimum
The
pool-use-strict-minattribute specifies whether JBoss EAP allows the number of connections in the pool to fall below the specified minimum.If
pool-use-strict-minis set totrue, JBoss EAP will not allow the number of connections to temporarily fall below the specified minimum. The default value isfalse.Although a minimum number of pool connections is specified, when JBoss EAP closes connections, for instance, if the connection is idle and has reached the timeout, the closure may cause the total number of connections to temporarily fall below the minimum before a new connection is created and added to the pool.
- Timeouts
There are a number of timeout options that are configurable for a connection pool, but a significant one for performance tuning is
idle-timeout-minutes.The
idle-timeout-minutesattribute specifies the maximum time, in minutes, a connection may be idle before being closed. As idle connections are closed, the number of connections in the pool will shrink down to the specified minimum.The longer the timeout, the more resources are used but requests might be served faster. The lower the timeout, the less resources are used but requests might need to wait for a new connection to be created.
6.3. Configuring pool attributes
6.3.1. Configuring datasource pool attributes
You can configure datasource pool attributes using either the management CLI or the management console.
Prerequisites
- Install a JDBC driver.
- Create a datasource.
Procedure
- To use the management console, navigate to Configuration → Subsystems → Datasources & Drivers → Datasources, select your datasource, and click View. The pool options are configurable under the datasource Pool tab. Timeout options are configurable under the datasource Timeouts tab.
To use the management CLI, execute the following command:
/subsystem=datasources/data-source=DATASOURCE_NAME/:write-attribute(name=ATTRIBUTE_NAME,value=ATTRIBUTE_VALUE)
For example, to set the
ExampleDSdatasourcemin-pool-sizeattribute to a value of 5 connections, use the following command:/subsystem=datasources/data-source=ExampleDS/:write-attribute(name=min-pool-size,value=5)
6.3.2. Configuring resource adapter pool attributes
You can configure resource adapter pool attributes using either the management CLI or the management console.
Prerequisites
- Deploy your resource adapter and add a connection definition.
Procedure
- To use the management console, navigate to Configuration → Subsystems → Resource Adapters, select your resource adapter, click View, and select Connection Definitions in the left menu. The pool options are configurable under the Pool tab. Timeout options are configurable under the Attributes tab.
To use the management CLI, execute the following command:
/subsystem=resource-adapters/resource-adapter=RESOURCE_ADAPTER_NAME/connection-definitions=CONNECTION_DEFINITION_NAME:write-attribute(name=ATTRIBUTE_NAME,value=ATTRIBUTE_VALUE)
For example, to set the
my_RAresource adaptermy_CDconnection definitionmin-pool-sizeattribute to a value of 5 connections, use the following command:/subsystem=resource-adapters/resource-adapter=my_RA/connection-definitions=my_CD:write-attribute(name=min-pool-size,value=5)
Chapter 7. Messaging subsystem tuning
When statistics collection is enabled for a messaging server in the messaging-activemq subsystem, you can view runtime statistics for resources on the messaging server.
7.1. Enabling messaging statistics
Because it can negatively impact performance, statistics collection for the messaging-activemq subsystem is not enabled by default. You do not need to enable queue statistics to obtain basic information, such as the number of messages on a queue or the number of messages added to a queue. Those statistics are available using queue attributes without requiring that you set statistics-enabled to true.
You can enable additional statistics collection using the management CLI or the management console.
7.1.1. Enable messaging statistics using the management CLI
The following management CLI command enables the collection of statistics for the default messaging server.
/subsystem=messaging-activemq/server=default:write-attribute(name=statistics-enabled,value=true)
Pooled connection factory statistics are enabled separately from the other messaging server statistics. Use the following command to enable statistics for a pooled connection factory.
/subsystem=messaging-activemq/server=default/pooled-connection-factory=activemq-ra:write-attribute(name=statistics-enabled,value=true)
Reload the server for the changes to take effect.
7.1.2. Enable messaging statistics using the management console
Use the following steps to enable statistics collection for a messaging server using the management console.
Procedure
- Navigate to Configuration → Subsystems → Messaging (ActiveMQ) → Server.
- Select the server and click View.
- Click Edit under the Statistics tab.
- Set the Statistics Enabled field to ON and click Save.
Pooled connection factory statistics are enabled separately from the other messaging server statistics. Use the following steps to enable statistics collection for a pooled connection factory.
- Navigate to Configuration → Subsystems → Messaging (ActiveMQ) → Server.
- Select the server, select Connections, and click View.
- Select the Pooled Connection Factory tab.
- Select the pooled connection factory and click Edit under the Attributes tab.
- Set the Statistics Enabled field to ON and click Save.
- Reload the server for the changes to take effect.
7.2. Viewing messaging statistics
You can view runtime statistics for a messaging server using the management CLI or management console.
7.2.1. View messaging statistics using the management CLI
You can view messaging statistics using the following management CLI commands. Be sure to include the include-runtime=true argument as statistics are runtime information.
- View statistics for a queue.
/subsystem=messaging-activemq/server=default/jms-queue=DLQ:read-resource(include-runtime=true)
{
    "outcome" => "success",
    "result" => {
        "consumer-count" => 0,
        "dead-letter-address" => "jms.queue.DLQ",
        "delivering-count" => 0,
        "durable" => true,
        ...
    }
}- View statistics for a topic.
/subsystem=messaging-activemq/server=default/jms-topic=testTopic:read-resource(include-runtime=true)
{
    "outcome" => "success",
    "result" => {
        "delivering-count" => 0,
        "durable-message-count" => 0,
        "durable-subscription-count" => 0,
        ...
    }
}- View statistics for a pooled connection factory.
/subsystem=messaging-activemq/server=default/pooled-connection-factory=activemq-ra/statistics=pool:read-resource(include-runtime=true)
{
    "outcome" => "success",
    "result" => {
        "ActiveCount" => 1,
        "AvailableCount" => 20,
        "AverageBlockingTime" => 0L,
        "AverageCreationTime" => 13L,
        "AverageGetTime" => 14L,
        ...
    }
}Pooled connection factory statistics are enabled separately from the other messaging server statistics.
7.2.2. View messaging statistics using the management console
To view messaging statistics from the management console, navigate to the Messaging (ActiveMQ) subsystem from the Runtime tab, and select the server. Select a destination to view its statistics.
The Prepared Transactions page is where you can view, commit, and roll back prepared transactions.
7.3. Configure message counters
You can configure the following message counter attributes for a messaging server.
-
message-counter-max-day-history: The number of days the message counter history is kept. -
message-counter-sample-period: How often, in milliseconds, the queue is sampled. The management CLI command to configure these options uses the following syntax. Be sure to replace `STATISTICS_NAME` and `STATISTICS_VALUE` with the statistic name and value you want to configure.
/subsystem=messaging-activemq/server=default::write-attribute(name=STATISTICS_NAME,value=STATISTICS_VALUE)
For example, use the following commands to set the message-counter-max-day-history to five days and the message-counter-sample-period to two seconds.
/subsystem=messaging-activemq/server=default:write-attribute(name=message-counter-max-day-history,value=5)
/subsystem=messaging-activemq/server=default:write-attribute(name=message-counter-sample-period,value=2000)
7.4. View message counter and history for a queue
You can view the message counter and message counter history for a queue using the following management CLI operations.
-
list-message-counter-as-json -
list-message-counter-as-html -
list-message-counter-history-as-json -
list-message-counter-history-as-html
The management CLI command to use display these values uses the following syntax. Be sure to replace `QUEUE_NAME` and `OPERATION_NAME` with the queue name and operation you want to use.
/subsystem=messaging-activemq/server=default/jms-queue=QUEUE_NAME:OPERATION_NAME
For example, use the following command to view the message counter for the TestQueue queue in JSON format.
/subsystem=messaging-activemq/server=default/jms-queue=TestQueue:list-message-counter-as-json
{
    "outcome" => "success",
    "result" => "{\"destinationName\":\"TestQueue\",\"destinationSubscription\":null,\"destinationDurable\":true,\"count\":0,\"countDelta\":0,\"messageCount\":0,\"messageCountDelta\":0,\"lastAddTimestamp\":\"12/31/69 7:00:00 PM\",\"updateTimestamp\":\"2/20/18 2:24:05 PM\"}"
}
7.5. Reset message counter for a queue
You can reset the message counter for a queue using the reset-message-counter management CLI operation.
/subsystem=messaging-activemq/server=default/jms-queue=TestQueue:reset-message-counter
{
    "outcome" => "success",
    "result" => undefined
}
7.6. Runtime operations using the management console
Using the management console you can:
- Perform forced failover to another messaging server
- Reset all message counters for a messaging server
- Reset all message counters history for a messaging server
- View information related to a messaging server
- Close connections for a messaging server
- Roll back transactions
- Commit transactions
7.6.1. Perform forced failover to another messaging server
You can use the management console to perform a forced failover to another messaging server.
Procedure
Access the management console and navigate to Server using either of the following:
- Runtime→ Browse By → Hosts → Host → Server
- Runtime→ Browse By → Server Groups → Server Group → Server
- Click Messaging ActiveMQ → Server
- Click the arrow button next to View and click Force Failover.
- On the Force Failover window, click Yes.
7.6.2. Resetting all message counters for a messaging server
You can use the management console to reset all message counters for a messaging server.
Procedure
Access the management console and navigate to Server using either of the following:
- Runtime→ Browse By → Hosts → Host → Server
- Runtime→ Browse By → Server Groups → Server Group → Server
- Click Messaging ActiveMQ → Server
- Click the arrow button next to View and click Reset.
On the Reset window, click the toggle button next to Reset all message counters to enable the functionality.
The button now displays
ONin a blue background.- Click Reset.
7.6.3. Resetting message counters history for a messaging server
You can use the management console to reset message counters history for a messaging server.
Procedure
Access the management console and navigate to Server using either of the following:
- Runtime→ Browse By → Hosts → Host → Server
- Runtime→ Browse By → Server Groups → Server Group → Server
- Click Messaging ActiveMQ → Server
- Click the arrow button next to View and click Reset.
On the Reset window, click the toggle button next to Reset all message counters history to enable the functionality.
The button now displays
ONin a blue background.- Click Reset.
7.6.5. Close connections for a messaging server
You can close connections by providing an IP address, an ActiveMQ address match or a user name.
To close connections for a messaging server:
Procedure
Access the management console and navigate to Server using either of the following:
- Runtime→ Browse By → Hosts → Host → Server
- Runtime→ Browse By → Server Groups → Server Group → Server
- Click Messaging ActiveMQ → Server and then click View.
- On the navigation pane, click Connections.
- On the Close window, click the appropriate tab based on which connection you want to close.
- Based on your selection, enter the IP address, ActiveMQ address match, or the user name, and then click Close.
7.6.6. Rolling back transactions for a messaging server
You can use the management console to roll back transactions for a messaging server.
Procedure
Access the management console and navigate to Server using either of the following:
- Runtime→ Browse By → Hosts → Host → Server
- Runtime→ Browse By → Server Groups → Server Group → Server
- Click Messaging ActiveMQ → Server and then click View.
- On the navigation pane, click Transactions.
- Select the transaction you want to roll back and click Rollback.
7.6.7. Committing transactions for a messaging server
You can use the management console to commit transactions for a messaging server.
Procedure
Access the management console and navigate to Server using either of the following:
- Runtime→ Browse By → Hosts → Host → Server
- Runtime→ Browse By → Server Groups → Server Group → Server
- Click Messaging ActiveMQ → Server and then click View.
- On the navigation pane, click Transactions.
- Select the transaction you want to commit and click Commit.
7.7. Tuning Jakarta Messaging
If you use the Jakarta Messaging API, review the following information for tips on how to improve performance.
Disable the message ID.
If you do not need message IDs, disable them by using the
setDisableMessageID()method on theMessageProducerclass. Setting the value to true eliminates the overhead of creating a unique ID and decreases the size of the message.Disable the message timestamp.
If you do not need message timestamps, disable them by using the
setDisableMessageTimeStamp()method on theMessageProducerclass. Setting the value to true eliminates the overhead of creating the timestamp and decreases the size of the message.Avoid using
ObjectMessage.ObjectMessageis used to send a message that contains a serialized object, meaning the body of the message, or payload, is sent over the wire as a stream of bytes. The Java serialized form of even small objects is quite large and takes up a lot of space on the wire. It is also slow when compared to custom marshalling techniques. UseObjectMessageonly if you cannot use one of the other message types, for example, if you do not know the type of the payload until runtime.Avoid
AUTO_ACKNOWLEDGE.The choice of acknowledgement mode in a consumer impacts performance because of the additional overhead and traffic incurred by sending the acknowledgment message sent over the network.
AUTO_ACKNOWLEDGEincurs this overhead because it requires an acknowledgement to be sent from the server for each message received on the client. If you can, useDUPS_OK_ACKNOWLEDGE, which acknowledges messages in a lazy manner,CLIENT_ACKNOWLEDGE, meaning the client code will call a method to acknowledge the message, or batch up many acknowledgements with one acknowledge or commit in a transacted session.Avoid durable messages.
By default, Jakarta Messaging messages are durable. If you do not need durable messages, set them to be
non-durable. Durable messages incur a lot of overhead because they are persisted to storage.Use
TRANSACTED_SESSIONmode to send and receive messages in a single transaction.By batching messages in a single transaction, the ActiveMQ Artemis server integrated in JBoss EAP requires only one network round trip on the commit, not on every send or receive.
7.8. Tuning persistence
Put the message journal on its own physical volume.
One of the advantages of an append-only journal is that disk head movement is minimized. This advantage is lost if the disk is shared. When multiple processes, such as a transaction coordinator, databases, and other journals, read and write from the same disk, performance is impacted because the disk head must skip around between different files. If you are using paging or large messages, make sure they are also put on separate volumes.
Tune the
journal-min-filesvalue.Set the
journal-min-filesparameter to the number of files that fits your average sustainable rate. If you frequently see new files being created on the journal data directory, meaning a lot data is being persisted, you need to increase the minimal number of files. This allows the journal to reuse, rather than create, new data files.Optimize the journal file size.
The journal file size must be aligned to the capacity of a cylinder on the disk. The default value of
10MBshould be enough on most systems.Use the
AIOjournal type.For Linux operating systems, keep your journal type as
AIO.AIOscales better than JavaNIO.Tune the
journal-buffer-timeoutvalue.Increasing the
journal-buffer-timeoutvalue results in increased throughput at the expense of latency.Tune the
journal-max-iovalue.If you are using
AIO, you might be able improve performance by increasing thejournal-max-ioparameter value. Do not change this value if you are usingNIO.
7.9. Other tuning options
This section describes other places in JBoss EAP messaging that can be tuned.
Use asynchronous send acknowledgements.
If you need to send non-transactional, durable messages and do not need a guarantee that they have reached the server by the time the call to
send()returns, do not set them to be sent blocking. Instead use asynchronous send acknowledgements to get your send acknowledgements returned in a separate stream. However, in the case of a server crash, some messages might be lost.Use
pre-acknowledgemode.With
pre-acknowledgemode, messages are acknowledged before they are sent to the client. This reduces the amount of acknowledgment traffic on the wire. However, if that client crashes, messages will not be redelivered if the client reconnects.Disable security.
There is a small performance boost when you disable security by setting the
security-enabledattribute to false.Disable persistence.
You can turn off message persistence altogether by setting
persistence-enabledtofalse.Sync transactions lazily.
Setting
journal-sync-transactionaltofalseprovides better transactional persistent performance at the expense of some possibility of loss of transactions on failure.Sync non-transactional lazily.
Setting
journal-sync-non-transactionaltofalseprovides better non-transactional persistent performance at the expense of some possibility of loss of durable messages on failure.Send messages non-blocking.
To avoid waiting for a network round trip for every message sent, set
block-on-durable-sendandblock-on-non-durable-sendtofalseif you are using Jakarta Messaging and JNDI, or set it directly on theServerLocatorby calling thesetBlockOnDurableSend()andsetBlockOnNonDurableSend()methods.Optimize the
consumer-window-size.If you have very fast consumers, you can increase the
consumer-window-sizeto effectively disable consumer flow control.Use the core API instead of the Jakarta Messaging API.
Jakarta Messaging operations must be translated into core operations before the server can handle them, resulting in lower performance than when you use the core API. When using the core API, try to use methods that take
SimpleStringas much as possible.SimpleString, unlikejava.lang.String, does not require copying before it is written to the wire, so if you reuseSimpleStringinstances between calls, you can avoid some unnecessary copying. Note that the core API is not portable to other brokers.
7.10. Avoiding anti-patterns
Reuse connections, sessions, consumers, and producers where possible.
The most common messaging anti-pattern is the creation of a new connection, session, and producer for every message sent or consumed. These objects take time to create and may involve several network round trips, so it is a poor use of resources. Always reuse them.
Some popular libraries such as the Spring Messaging Template use these anti-patterns. If you are using the Spring Messaging Template, you may see poor performance. The Spring Messaging Template can only safely be used in an application server which caches Jakarta Messaging sessions, for example, using Jakarta Connectors, and only then for sending messages. It cannot safely be used for synchronously consuming messages, even in an application server.
Avoid fat messages.
Verbose formats such as XML take up a lot of space on the wire and performance suffers as result. Avoid XML in message bodies if you can.
Do not create temporary queues for each request.
This common anti-pattern involves the temporary queue request-response pattern. With the temporary queue request-response pattern, a message is sent to a target, and a reply-to header is set with the address of a local temporary queue. When the recipient receives the message, they process it, and then send back a response to the address specified in the reply-to header. A common mistake made with this pattern is to create a new temporary queue on each message sent, which drastically reduces performance. Instead, the temporary queue should be reused for many requests.
Do not use message driven beans unless it is necessary.
Using MDBs to consume messages is slower than consuming messages using a simple Jakarta Messaging message consumer.
Chapter 8. Logging subsystem tuning
You can further improve upon JBoss EAP logging subsystem performance in production environments by disabling logging to console, configuring appropriate logging levels, and specifying the best location to store log files.
8.1. Disabling logging to the console
Disabling console logging can improve JBoss EAP performance. Although outputting logs to the console can be useful in development and testing environments, for production environments it is not necessary in most cases. The JBoss EAP root logger includes a console log handler for all default standalone server profiles except standalone-full-ha. The default managed domain profiles do not include a console handler.
To remove the default console handler from the root logger, use the following management CLI command.
/subsystem=logging/root-logger=ROOT:remove-handler(name=CONSOLE)
8.2. Configuring logging levels
For ideal performance, you must configure the logging levels for your production environment appropriately. For example, although INFO or DEBUG levels might be appropriate for development or testing environments, in most cases you should set your production environment logging level to something higher, such as WARN or ERROR.
8.3. Configuring the location of log files
You should consider the storage location of log files as a potential performance issue. If you save logs to a file system or disk configuration that has poor I/O throughput, it has the potential to affect the whole platform’s performance.
To prevent logging from impacting JBoss EAP performance, it is recommended that you set log locations to high-performance dedicated disks that have a lot of space.
Chapter 9. Undertow subsystem tuning
The non-blocking I/O (NIO) undertow subsystem introduced in JBoss EAP 7 has greatly improved performance compared to the previous web subsystem in JBoss EAP 6. Opportunities for tuning the undertow subsystem for your environment include:
- Buffer cache configuration
- Byte buffer pools configuration
- Jakarta Server Pages configuration options
- Listener configuration options
- Session attribute marshalling
9.1. Buffer cache configuration
A buffer cache stores static files handled by the undertow subsystem. This includes images, static HTML, CSS, and JavaScript files. You can specify a default buffer cache for each Undertow servlet container. Having an optimized buffer cache for your servlet container can improve Undertow performance for serving static files.
Buffers in a buffer cache are allocated in regions and are of a fixed size. There are three configurable attributes for each buffer cache:
- buffer-size
- The size of an individual buffer, in bytes. The default is 1024 bytes. Set the buffer size to entirely store your largest static file.
- buffers-per-region
- The number of buffers per region. The default is 1024.
- max-regions
- The maximum number of regions, which sets a maximum amount of memory allocated to the buffer cache. The default is 10 regions.
You can calculate the maximum amount memory used by a buffer cache by multiplying the buffer size, the number of buffers per region, and the maximum number of regions. For example, the default buffer cache is 1024 bytes * 1024 buffers per region * 10 regions = 10 MB.
Configure your buffer caches based on the size of your static files, and the results from testing expected loads in a development environment. When determining the effect on performance, consider the balance of the buffer cache performance benefit versus the memory used.
9.2. Byte buffer pools configuration
Undertow byte buffer pools are used to allocate pooled NIO ByteBuffer instances. All listeners have a byte buffer pool and you can use different buffer pools and workers for each listener. Byte buffer pools can be shared between different server instances.
The main byte buffer pool attribute that significantly affects performance is buffer-size. The default is calculated based on the RAM resources of your system and is sufficient in most cases. If you are configuring this attribute manually, an ideal size for most servers is 16 KB.
9.3. Jakarta Server Pages configuration options
The following Jakarta Server Pages configuration options for Undertow servlet containers provide optimizations for how Jakarta Server Pages are compiled into Java bytecode:
- generate-strings-as-char-arrays
- If your Jakarta Server Pages contain a lot of String constants, enabling this option optimizes scriptlets by converting the String constants to char arrays.
- optimize-scriptlets
- If your Jakarta Server Pages contain many String concatenations, enabling this option optimizes scriptlets by removing String concatenation for every Jakarta Server Pages request.
- trim-spaces
- If your Jakarta Server Pages contain a lot of white space, enabling this option trims the white space from HTTP requests and reduces HTTP request payload.
9.3.1. Enabling Jakarta Server Pages options using the management console
To enable the Undertow Jakarta Server Pages configuration options using the management console, complete the following steps:
Procedure
- Navigate to Configuration → Subsystems → Web (Undertow) → Servlet Container.
- Select the servlet container you want to configure and click View.
- Select Jakarta Server Pages and click Edit.
- For each option you want to enable, set the field to ON, and then click Save.
9.3.2. Enabling Jakarta Server Pages options using the management CLI
To enable the Undertow Jakarta Server Pages configuration options using the management CLI, complete the following steps:
Procedure
- Use the following command:
/subsystem=undertow/servlet-container=__SERVLET_CONTAINER__/setting=jsp/:write-attribute(name=__OPTION_NAME__,value=true)
For example, to enable generate-strings-as-char-arrays for the default servlet container, use the following command:
/subsystem=undertow/servlet-container=default/setting=jsp/:write-attribute(name=generate-strings-as-char-arrays,value=true)
9.4. Listener configuration options
Depending on your applications and environment, you can configure multiple listeners specific to certain types of traffic, for example, traffic on specific ports, and then configure options for each listener.
The following are selected performance-related options that can be configured on HTTP, HTTPS, and AJP listeners.
max-connectionsThe maximum number of concurrent connections that the listener can handle. By default this attribute is undefined, which results in unlimited connections.
You can use this option to set a ceiling on the number of connections a listener can handle, which might be useful to cap resource usage. In configuring this value you should consider your workload and traffic type. Also see
no-request-timeoutbelow.no-request-timeoutThe length of time in milliseconds that a connection is idle before it is closed. The default value is 60000 milliseconds (1 minute).
Tuning this option in your environment for optimal connection efficiency can help improve network performance. If idle connections are prematurely closed, there are overheads in re-establishing connections. If idle connections are open for too long, they unnecessarily use resources.
max-header-sizeThe maximum size of an HTTP request header, in bytes. The default is 1048576 (1024KB).
Limiting the header size can be useful to prevent certain types of denial of service attacks.
buffer-poolSpecifies the buffer pool in the
iosubsystem to use for the listener. By default, all listeners use thedefaultbuffer pool.You can use this option to configure each listener to use a unique buffer pool, or have multiple listeners use the same buffer pool.
workerThe
undertowsubsystem relies on theiosubsystem to provide XNIO workers. This option specifies the XNIO worker that the listener uses. By default, a listener uses thedefaultworker in theiosubsystem.It might be useful to configure each listener to use a specific worker so you can assign different worker resources to certain types of network traffic.
9.4.1. Configuring listener options using the management console
To configure the listener options using the management console, complete the following steps:
Procedure
- Navigate to Configuration → Subsystems → Web (Undertow) → Server.
- Select the server you want to configure and click View.
- In the left menu, select Listener then select the type of listener to configure, for example HTTP Listener, and select the listener in the table.
- CLick Edit, modify the options you want to configure, and click Save.
9.4.2. Configuring listener options using the management CLI
To configure the listener options using the management CLI, complete the following steps:
Procedure
- Use the following command:
/subsystem=undertow/server=SERVER_NAME/LISTENER_TYPE=LISTENER_NAME:write-attribute(name=OPTION_NAME,value=OPTION_VALUE)
For example, to set max-connections to 100000 for the default HTTP listener in the default-server Undertow server, use the following command:
/subsystem=undertow/server=default-server/http-listener=default:write-attribute(name=max-connections,value=100000)
Chapter 10. IO subsystem tuning
The io subsystem defines XNIO workers and buffer pools that are used by other JBoss EAP subsystems, such as Undertow and Remoting.
10.1. Configuring workers
You can create multiple separate workers that each have their own performance configuration and which handle different I/O tasks. For example, you could create one worker to handle HTTP I/O, and another worker to handle Jakarta Enterprise Beans I/O, and then separately configure the attributes of each worker for specific load requirements.
Worker attributes that significantly affect performance include io-threads which sets the total number of I/O threads that a worker can use, and task-max-threads which sets the maximum number of threads that can be used for a particular task. The defaults for these two attributes are calculated based on the server’s CPU count.
10.1.1. Monitoring worker statistics
You can view a worker’s runtime statistics using the management CLI. This exposes worker statistics such as connection count, thread count, and queue size.
The following command displays runtime statistics for the default worker:
/subsystem=io/worker=default:read-resource(include-runtime=true,recursive=true)
The number of core threads, which is tracked by the core-pool-size statistic, is currently always set to the same value as the maximum number of threads, which is tracked by the max-pool-size statistic.
10.2. Configuring buffer pools
IO buffer pools are deprecated, but they are still set as the default in the current release.
A buffer pool in the io subsystem is a pooled NIO buffer instance that is used specifically for I/O operations. Like workers, you can create separate buffer pools which can be dedicated to handle specific I/O tasks.
The main buffer pool attribute that significantly affects performance is buffer-size. The default is calculated based on the RAM resources of your system, and is sufficient in most cases. If you are configuring this attribute manually, an ideal size for most servers is 16KB.
Chapter 11. JGroups subsystem tuning
For optimal network performance it is recommended that you use UDP multicast for JGroups in environments that support it.
TCP has more overhead and is often considered slower than UDP since it handles error checking, packet ordering, and congestion control itself. JGroups handles these features for UDP, whereas TCP guarantees them itself. TCP is a good choice when using JGroups on unreliable or high congestion networks, or when multicast is not available.
This chapter assumes that you have chosen your JGroups stack transport protocol (UDP or TCP) and communications protocols that JGroups cluster communications will use.
11.1. Monitoring JGroups statistics
You can enable statistics for the jgroups subsystem to monitor JBoss EAP clustering using the management CLI or through JMX.
Enabling statistics adversely affects performance. Only enable statistics when necessary.
Procedure
Use the following command to enable statistics for a JGroups channel.
NoteIn a managed domain, precede these commands with
/profile=PROFILE_NAME./subsystem=jgroups/channel=CHANNEL_NAME:write-attribute(name=statistics-enabled,value=true)
For example, use the following command to enable statistics for the default
eechannel./subsystem=jgroups/channel=ee:write-attribute(name=statistics-enabled,value=true)
Reload the JBoss EAP server.
reload
You can now see JGroups statistics using either the management CLI, or through JMX with a JVM monitoring tool:
To use the management CLI, use the
:read-resource(include-runtime=true)command on the JGroups channel or protocol that you want to see the statistics for.NoteIn a managed domain, precede these commands with
/host=HOST_NAME/server=SERVER_NAME.For example:
To see the statistics for the
eechannel, use the following command:/subsystem=jgroups/channel=ee:read-resource(include-runtime=true)
To see the statistics for the
FD_ALLprotocol in theeechannel, use the following command:/subsystem=jgroups/channel=ee/protocol=FD_ALL:read-resource(include-runtime=true)
- To connect to JBoss EAP using a JVM monitoring tool, see the Monitoring Performance chapter. You can see the statistics on JGroups MBeans through the JMX connection.
11.2. Networking and jumbo frames
Where possible, it is recommended that the network interface for JGroups traffic should be part of a dedicated Virtual Local Area Network (VLAN). This allows you to separate cluster communications from other JBoss EAP network traffic to more easily control cluster network performance, throughput, and security.
Another network configuration to consider to improve cluster performance is to enable jumbo frames. If your network environment supports it, enabling jumbo frames by increasing the Maximum Transmission Unit (MTU) can help boost network performance, especially in high throughput environments.
To use jumbo frames, all NICs and switches in your network must support it.
Additional resources
See the Red Hat Customer Portal for instructions on enabling jumbo frames for Red Hat Enterprise Linux.
11.3. Message bundling
Message bundling in JGroups improves network performance by assembling multiple small messages into larger bundles. Rather than sending out many small messages over the network to cluster nodes, instead messages are queued until the maximum bundle size is reached or there are no more messages to send. The queued messages are assembled into a larger message bundle and then sent.
This bundling reduces communications overhead, especially in TCP environments where there is a higher overhead for network communications.
11.3.1. Configuring message bundling
JGroups message bundling is configured using the max_bundle_size property. The default max_bundle_size is 64KB.
The performance improvements of tuning the bundle size depend on your environment, and whether more efficient network traffic is balanced against a possible delay of communications while the bundle is assembled.
Procedure
Use the following management CLI command to configure
max_bundle_size./subsystem=jgroups/stack=STACK_NAME/transport=TRANSPORT_TYPE/property=max_bundle_size:add(value=BUNDLE_SIZE)
For example, to set
max_bundle_sizeto 60K for the defaultudpstack:/subsystem=jgroups/stack=udp/transport=UDP/property=max_bundle_size:add(value=60K)
11.4. JGroups thread pools
The jgroups subsystem uses its own thread pools for processing cluster communication. JGroups contains thread pools for default, internal, oob, and timer functions which you can configure individually. Each JGroups thread pool includes configurable attributes for keepalive-time, max-threads, min-threads, and queue-length.
Appropriate values for each thread pool attribute depend on your environment, but for most situations the default values should suffice.
11.5. JGroups send and receive buffers
The jgroups subsystem has configurable send and receive buffers for both UDP and TCP stacks.
Appropriate values for JGroups buffers depend on your environment, but for most situations the default values should suffice. It is recommended that you test your cluster under load in a development environment to tune appropriate values for the buffer sizes.
Your operating system may limit the available buffer sizes and JBoss EAP may not be able to use its configured buffer values.
Chapter 12. Transactions subsystem tuning
If your environment uses XA distributed transactions, you can tune the transaction manager’s log store for better performance.
The default transaction log store uses a simple file store. For XA transactions this type of log store can be inefficient, as it creates one system file for each transaction log. Especially for XA transactions, a journal store is much more efficient as it uses a journal that consists of one file for all transactions.
For better XA transaction performance, it is recommended that you use a journal log store. For Red Hat Enterprise Linux systems, you can additionally enable asynchronous I/O (AIO) on the journal store to further improve performance.
For Red Hat Enterprise Linux systems, if you are enabling asynchronous I/O (AIO) on the journal store, ensure that the libaio package is installed.
12.1. Enable the journal log store using the management console
You can use the management console to enable the journal log store.
Procedure
- Navigate to Configuration → Subsystems → Transaction → and click View.
- In the Configuration tab, click Edit.
- Set the Use Journal Store field to ON.
- Optional: For Red Hat Enterprise Linux systems, set the Journal Store Enable Async IO field to ON.
- Click Save.
12.2. Enable the journal log store Using the management CLI
You can use the management CLI to enable the journal log store.
Procedure
To enable the journal log store using the management CLI, use the following command:
/subsystem=transactions:write-attribute(name=use-journal-store,value=true)
Optional: For Red Hat Enterprise Linux systems, use the following command to enable journal log store asynchronous I/O:
/subsystem=transactions:write-attribute(name=journal-store-enable-async-io, value=true)
Appendix A. Reference Material
A.1. Datasource statistics
Table A.1. Core pool statistics
| Name | Description |
|---|---|
| ActiveCount | The number of active connections. Each of the connections is either in use by an application or available in the pool. |
| AvailableCount | The number of available connections in the pool. |
| AverageBlockingTime | The average time spent blocking on obtaining an exclusive lock on the pool. This value is in milliseconds. |
| AverageCreationTime | The average time spent creating a connection. This value is in milliseconds. |
| AverageGetTime | The average time spent obtaining a connection. |
| AveragePoolTime | The average time that a connection spent in the pool. |
| AverageUsageTime | The average time spent using a connection. |
| BlockingFailureCount | The number of failures trying to obtain a connection. |
| CreatedCount | The number of connections created. |
| DestroyedCount | The number of connections destroyed. |
| IdleCount | The number of connections that are currently idle. |
| InUseCount | The number of connections currently in use. |
| MaxCreationTime | The maximum time it took to create a connection. This value is in milliseconds. |
| MaxGetTime | The maximum time for obtaining a connection. |
| MaxPoolTime | The maximum time for a connection in the pool. |
| MaxUsageTime | The maximum time using a connection. |
| MaxUsedCount | The maximum number of connections used. |
| MaxWaitCount | The maximum number of requests waiting for a connection at the same time. |
| MaxWaitTime | The maximum time spent waiting for an exclusive lock on the pool. |
| TimedOut | The number of timed out connections. |
| TotalBlockingTime | The total time spent waiting for an exclusive lock on the pool. This value is in milliseconds. |
| TotalCreationTime | The total time spent creating connections. This value is in milliseconds. |
| TotalGetTime | The total time spent obtaining connections. |
| TotalPoolTime | The total time spent by connections in the pool. |
| TotalUsageTime | The total time spent using connections. |
| WaitCount | The number of requests that had to wait to obtain a connection. |
| XACommitAverageTime | The average time for an XAResource commit invocation. |
| XACommitCount | The number of XAResource commit invocations. |
| XACommitMaxTime | The maximum time for an XAResource commit invocation. |
| XACommitTotalTime | The total time for all XAResource commit invocations. |
| XAEndAverageTime | The average time for an XAResource end invocation. |
| XAEndCount | The number of XAResource end invocations. |
| XAEndMaxTime | The maximum time for an XAResource end invocation. |
| XAEndTotalTime | The total time for all XAResource end invocations. |
| XAForgetAverageTime | The average time for an XAResource forget invocation. |
| XAForgetCount | The number of XAResource forget invocations. |
| XAForgetMaxTime | The maximum time for an XAResource forget invocation. |
| XAForgetTotalTime | The total time for all XAResource forget invocations. |
| XAPrepareAverageTime | The average time for an XAResource prepare invocation. |
| XAPrepareCount | The number of XAResource prepare invocations. |
| XAPrepareMaxTime | The maximum time for an XAResource prepare invocation. |
| XAPrepareTotalTime | The total time for all XAResource prepare invocations. |
| XARecoverAverageTime | The average time for an XAResource recover invocation. |
| XARecoverCount | The number of XAResource recover invocations. |
| XARecoverMaxTime | The maximum time for an XAResource recover invocation. |
| XARecoverTotalTime | The total time for all XAResource recover invocations. |
| XARollbackAverageTime | The average time for an XAResource rollback invocation. |
| XARollbackCount | The number of XAResource rollback invocations. |
| XARollbackMaxTime | The maximum time for an XAResource rollback invocation. |
| XARollbackTotalTime | The total time for all XAResource rollback invocations. |
| XAStartAverageTime | The average time for an XAResource start invocation. |
| XAStartCount | The number of XAResource start invocations. |
| XAStartMaxTime | The maximum time for an XAResource start invocation. |
| XAStartTotalTime | The total time for all XAResource start invocations. |
Table A.2. JDBC statistics
| Name | Description |
|---|---|
| PreparedStatementCacheAccessCount | The number of times that the statement cache was accessed. |
| PreparedStatementCacheAddCount | The number of statements added to the statement cache. |
| PreparedStatementCacheCurrentSize | The number of prepared and callable statements currently cached in the statement cache. |
| PreparedStatementCacheDeleteCount | The number of statements discarded from the cache. |
| PreparedStatementCacheHitCount | The number of times that statements from the cache were used. |
| PreparedStatementCacheMissCount | The number of times that a statement request could not be satisfied with a statement from the cache. |
A.2. Resource adapter statistics
Table A.3. Resource adapter statistics
| Name | Description |
|---|---|
| ActiveCount | The number of active connections. Each of the connections is either in use by an application or available in the pool |
| AvailableCount | The number of available connections in the pool. |
| AverageBlockingTime | The average time spent blocking on obtaining an exclusive lock on the pool. The value is in milliseconds. |
| AverageCreationTime | The average time spent creating a connection. The value is in milliseconds. |
| CreatedCount | The number of connections created. |
| DestroyedCount | The number of connections destroyed. |
| InUseCount | The number of connections currently in use. |
| MaxCreationTime | The maximum time it took to create a connection. The value is in milliseconds. |
| MaxUsedCount | The maximum number of connections used. |
| MaxWaitCount | The maximum number of requests waiting for a connection at the same time. |
| MaxWaitTime | The maximum time spent waiting for an exclusive lock on the pool. |
| TimedOut | The number of timed out connections. |
| TotalBlockingTime | The total time spent waiting for an exclusive lock on the pool. The value is in milliseconds. |
| TotalCreationTime | The total time spent creating connections. The value is in milliseconds. |
| WaitCount | The number of requests that had to wait for a connection. |
A.3. IO subsystem attributes
Attribute names in these tables are listed as they appear in the management model, for example, when using the management CLI. See the schema definition file located at EAP_HOME/docs/schema/wildfly-io_2_0.xsd to view the elements as they appear in the XML, as there may be differences from the management model.
Table A.4. worker attributes
| Attribute | Default | Description |
|---|---|---|
| io-threads | The number of I/O threads to create for the worker. If not specified, the number of threads is set to the number of CPUs × 2. | |
| stack-size | 0 | The stack size, in bytes, to attempt to use for worker threads. |
| task-keepalive | 60000 | The number of milliseconds to keep non-core task threads alive. |
| task-core-threads | 2 | The number of threads for the core task thread pool. |
| task-max-threads |
The maximum number of threads for the worker task thread pool. If not specified, the maximum number of threads is set to the number of CPUs × 16, taking the |
Table A.5. buffer-pool attributes
| Attribute | Default | Description |
|---|---|---|
| buffer-size | The size, in bytes, of each buffer slice. If not specified, the size is set based on the available RAM of your system:
| |
| buffers-per-slice | How many slices, or sections, to divide the larger buffer into. This can be more memory efficient than allocating many separate buffers. If not specified, the number of slices is set based on the available RAM of your system: * 10 for less than 128 MB RAM * 20 for more than 128 MB RAM | |
| direct-buffers | Whether the buffer pool uses direct buffers, which are faster in many cases with NIO. Note that some platforms do not support direct buffers. |
IO buffer pools are deprecated as of JBoss EAP 7.2. While they are still set as the default in the current release, they will be replaced by Undertow byte buffer pools in a future release.
Revised on 2024-02-21 14:03:06 UTC